

The DOI matches its Crossref record; 5 of the 5 references it cites were found in a registry or an index.
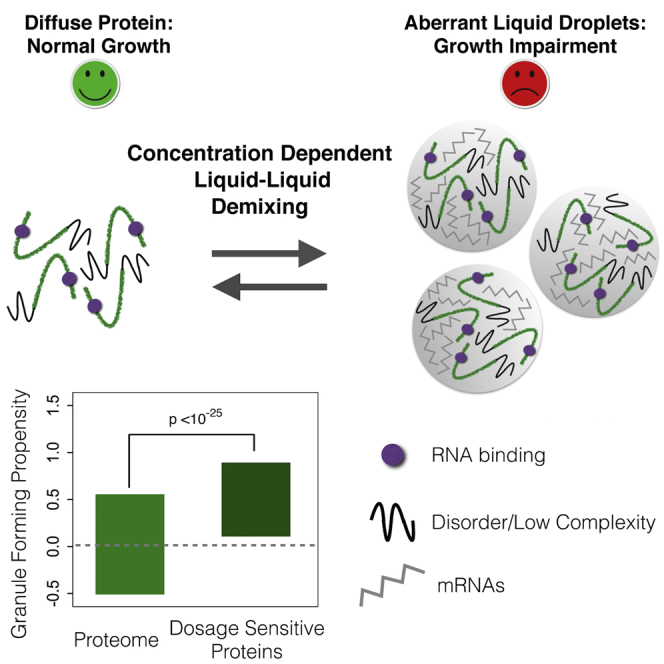
A Concentration-Dependent Liquid Phase Separation Can Cause Toxicity upon Increased Protein Expression
Overview
The claims and statistics of this paper haven’t been checked yet.
Run the check — free, no account needed. It reads the open-access text and checks the sources it cites.
Integrity signals
Registry
Cites
Statistics
Figures
Verification
Claims the paper makes
The claims and statistics of this paper haven’t been checked yet.
Run the check — free, no account needed. It reads the open-access text and checks the sources it cites.
Claims other papers make about this one
Each is checked against this paper’s own text: does it say what the citing paper says it does?
In the citing paper
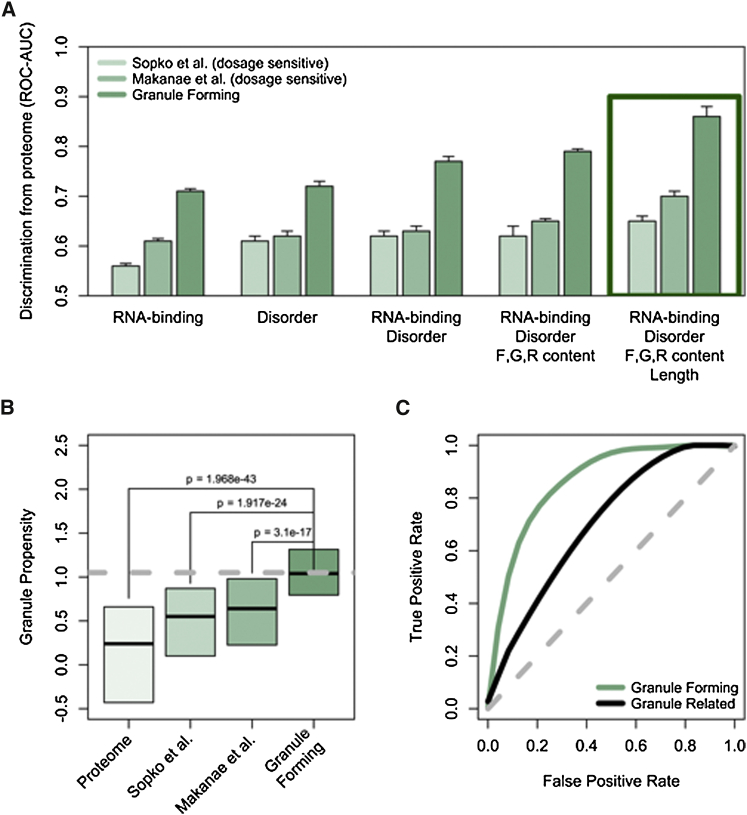
“The overall granule propensity calculated with catGranule for hTau40 was 1.69 (Fig. 1c). Thus, the granule propensity of hTau40 is by 1.69 standard deviations larger than that predicted across the yeast proteome42.”
From Liquid–liquid phase separation of the microtubule-binding repeats of the Alzheimer-related protein Tau (2017) · cites this paper as [42]
Self-check
Percentages, sums and reported differences re-computed from the paper’s own numbers.
The self-check needs the paper’s full text.
Citations
Cites
Insights into RNA Biology from an Atlas of Mammalian mRNA-Binding Proteins
Castello, A., Fischer, B., Eichelbaum, K., Horos, R., Beckmann, B. M., Strein, C., Davey, N. E., Humphreys, D. T., Preiss, T., Steinmetz, L. M., et al. (2012) · Cell · doi:10.1016/j.cell.2012.04.031 · Cited by 2,132
Kato, M., Han, T. W., Xie, S., Shi, K., Du, X., Wu, L. C., Mirzaei, H., Goldsmith, E. J., Longgood, J., Pei, J., et al. (2012) · Cell · doi:10.1016/j.cell.2012.04.017 · Cited by 2,012
Misfolded proteins partition between two distinct quality control compartments
Kaganovich, D., Kopito, R., & Frydman, J. (2008) · Nature · doi:10.1038/nature07195 · Cited by 932
Kayed, R., Head, E., Sarsoza, F., Saing, T., Cotman, C. W., Necula, M., Margol, L., Wu, J., Breydo, L., Thompson, J. L., et al. (2007) · Molecular Neurodegeneration · doi:10.1186/1750-1326-2-18 · Cited by 773
Hall, B. G., Acar, H., Nandipati, A., & Barlow, M. (2014) · Molecular Biology and Evolution · doi:10.1093/molbev/mst187 · Cited by 507
Research works printed but not linked: 44
- Brangwynne, 2009, Germline P granules are liquid droplets that localize by controlled dissolution/condensation, Science, 324, 1729, 10.1126/science.1172046 · DOI
- Brangwynne, 2011, Active liquid-like behavior of nucleoli determines their size and shape in Xenopus laevis oocytes, Proc. Natl. Acad. Sci. USA, 108, 4334, 10.1073/pnas.1017150108 · DOI
- Decker, 2012, P-bodies and stress granules: possible roles in the control of translation and mRNA degradation, Cold Spring Harb. Perspect. Biol., 4, a012286, 10.1101/cshperspect.a012286 · DOI
- Deléage, 1987, An algorithm for protein secondary structure prediction based on class prediction, Protein Eng., 1, 289, 10.1093/protein/1.4.289 · DOI
- Dinkel, 2016, ELM 2016--data update and new functionality of the eukaryotic linear motif resource, Nucleic Acids Res., 44, D294, 10.1093/nar/gkv1291 · DOI
- Geiler-Samerotte, 2011, Misfolded proteins impose a dosage-dependent fitness cost and trigger a cytosolic unfolded protein response in yeast, Proc. Natl. Acad. Sci. USA, 108, 680, 10.1073/pnas.1017570108 · DOI
- Gelperin, 2005, Biochemical and genetic analysis of the yeast proteome with a movable ORF collection, Genes Dev., 19, 2816, 10.1101/gad.1362105 · DOI
- Girirajan, 2011, Human copy number variation and complex genetic disease, Annu. Rev. Genet., 45, 203, 10.1146/annurev-genet-102209-163544 · DOI
- Hyman, 2014, Liquid-liquid phase separation in biology, Annu. Rev. Cell Dev. Biol., 30, 39, 10.1146/annurev-cellbio-100913-013325 · DOI · Paper page
- Isogai, 1980, Characterization of multiple bends in proteins, Biopolymers, 19, 1183, 10.1002/bip.1980.360190607 · DOI
- Jain, 2016, ATPase-modulated stress granules contain a diverse proteome and substructure, Cell, 164, 487, 10.1016/j.cell.2015.12.038 · DOI
- Janke, 2004, A versatile toolbox for PCR-based tagging of yeast genes: new fluorescent proteins, more markers and promoter substitution cassettes, Yeast, 21, 947, 10.1002/yea.1142 · DOI
- Kedersha, 2005, Stress granules and processing bodies are dynamically linked sites of mRNP remodeling, J. Cell Biol., 169, 871, 10.1083/jcb.200502088 · DOI
- Kim, 2013, Mutations in prion-like domains in hnRNPA2B1 and hnRNPA1 cause multisystem proteinopathy and ALS, Nature, 495, 467, 10.1038/nature11922 · DOI
- Klus, 2014, The cleverSuite approach for protein characterization: predictions of structural properties, solubility, chaperone requirements and RNA-binding abilities, Bioinformatics, 30, 1601, 10.1093/bioinformatics/btu074 · DOI
- Kroschwald, 2015, Promiscuous interactions and protein disaggregases determine the material state of stress-inducible RNP granules, eLife, 4, e06807, 10.7554/eLife.06807 · DOI
- Lavut, 2012, Sequestration of highly expressed mRNAs in cytoplasmic granules, P-bodies, and stress granules enhances cell viability, PLoS Genet., 8, e1002527, 10.1371/journal.pgen.1002527 · DOI
- Lee, 2013, Spatial organization of the cell cytoplasm by position-dependent phase separation, Phys. Rev. Lett., 111, 088101, 10.1103/PhysRevLett.111.088101 · DOI
- Lin, 2015, Formation and maturation of phase-separated liquid droplets by RNA-binding proteins, Mol. Cell, 60, 208, 10.1016/j.molcel.2015.08.018 · DOI
- Makanae, 2013, Identification of dosage-sensitive genes in Saccharomyces cerevisiae using the genetic tug-of-war method, Genome Res., 23, 300, 10.1101/gr.146662.112 · DOI
- Malinovska, 2013, Protein disorder, prion propensities, and self-organizing macromolecular collectives, Biochim. Biophys. Acta, 1834, 918, 10.1016/j.bbapap.2013.01.003 · DOI
- Mitchell, 2013, Global analysis of yeast mRNPs, Nat. Struct. Mol. Biol., 20, 127, 10.1038/nsmb.2468 · DOI
- Ogrodnik, 2014, Dynamic JUNQ inclusion bodies are asymmetrically inherited in mammalian cell lines through the asymmetric partitioning of vimentin, Proc. Natl. Acad. Sci. USA, 111, 8049, 10.1073/pnas.1324035111 · DOI
- Papp, 2003, Dosage sensitivity and the evolution of gene families in yeast, Nature, 424, 194, 10.1038/nature01771 · DOI · Paper page
- Parker, 2007, P bodies and the control of mRNA translation and degradation, Mol. Cell, 25, 635, 10.1016/j.molcel.2007.02.011 · DOI · Paper page
- Patel, 2007, Natively unfolded nucleoporins gate protein diffusion across the nuclear pore complex, Cell, 129, 83, 10.1016/j.cell.2007.01.044 · DOI
- Patel, 2015, A liquid-to-solid phase transition of the ALS protein FUS accelerated by disease mutation, Cell, 162, 1066, 10.1016/j.cell.2015.07.047 · DOI · Paper page
- Rapsomaniki, 2012, easyFRAP: an interactive, easy-to-use tool for qualitative and quantitative analysis of FRAP data, Bioinformatics, 28, 1800, 10.1093/bioinformatics/bts241 · DOI
- Schisa, 2001, P granules and mRNA, Development, 128, 1
- Sopko, 2006, Mapping pathways and phenotypes by systematic gene overexpression, Mol. Cell, 21, 319, 10.1016/j.molcel.2005.12.011 · DOI
- Tartaglia, 2007, Life on the edge: a link between gene expression levels and aggregation rates of human proteins, Trends Biochem. Sci., 32, 204, 10.1016/j.tibs.2007.03.005 · DOI
- Teixeira, 2005, Processing bodies require RNA for assembly and contain nontranslating mRNAs, RNA, 11, 371, 10.1261/rna.7258505 · DOI
- Thandapani, 2013, Defining the RGG/RG motif, Mol. Cell, 50, 613, 10.1016/j.molcel.2013.05.021 · DOI
- Tomala, 2014, Fitness costs of minimal sequence alterations causing protein instability and toxicity, Mol. Biol. Evol., 31, 703, 10.1093/molbev/mst264 · DOI
- 2013, Update on activities at the Universal Protein Resource (UniProt) in 2013, Nucleic Acids Res., 41, D43
- van der Lee, 2014, Classification of intrinsically disordered regions and proteins, Chem. Rev., 114, 6589, 10.1021/cr400525m · DOI
- Vavouri, 2009, Intrinsic protein disorder and interaction promiscuity are widely associated with dosage sensitivity, Cell, 138, 198, 10.1016/j.cell.2009.04.029 · DOI
- Veitia, 2003, Nonlinear effects in macromolecular assembly and dosage sensitivity, J. Theor. Biol., 220, 19, 10.1006/jtbi.2003.3105 · DOI
- Veitia, 2010, Dominance and gene dosage balance in health and disease: why levels matter!, J. Pathol., 220, 174, 10.1002/path.2623 · DOI
- Walters, 2015, Differential effects of Ydj1 and Sis1 on Hsp70-mediated clearance of stress granules in Saccharomyces cerevisiae, RNA, 21, 1660, 10.1261/rna.053116.115 · DOI
- Wang, 2015, Version 4.0 of PaxDb: Protein abundance data, integrated across model organisms, tissues, and cell-lines, Proteomics, 15, 3163, 10.1002/pmic.201400441 · DOI
- Weber, 2012, Getting RNA and protein in phase, Cell, 149, 1188, 10.1016/j.cell.2012.05.022 · DOI
- Weber, 2015, Inverse size scaling of the nucleolus by a concentration-dependent phase transition, Curr. Biol., 25, 641, 10.1016/j.cub.2015.01.012 · DOI
- Wippich, 2013, Dual specificity kinase DYRK3 couples stress granule condensation/dissolution to mTORC1 signaling, Cell, 152, 791, 10.1016/j.cell.2013.01.033 · DOI
Cited by
Ambadipudi, S., Biernat, J., Riedel, D., Mandelkow, E., & Zweckstetter, M. (2017) · Nature Communications · doi:10.1038/s41467-017-00480-0 · Cited by 782
A phage nucleus-associated RNA-binding protein is required for jumbo phage infection
Enustun, E., Armbruster, E. G., Lee, J., Zhang, S., Yee, B. A., Malukhina, K., Gu, Y., Deep, A., Naritomi, J. T., Liang, Q., et al. (2024) · Nucleic Acids Research · doi:10.1093/nar/gkae216 · Cited by 27
Metadata
- Authors
- Bolognesi, B., Lorenzo Gotor, N., Dhar, R., Cirillo, D., Baldrighi, M., Tartaglia, G. G., & Lehner, B.
- Venue
- Cell Reports
- Publisher
- Elsevier BV
- Published
- 2016-06
- Volume
- 16
- Issue
- 1
- Pages
- 222-231
- ISSN
- 2211-1247
- PMC
- PMC4929146
- Cited by
- 338
- References
- 5
- Language
- en
About these checks
Registry, retraction, Cites and statistics results are computed, not judged, with one exception: a printed reference that no index lists is read once by a model before it counts as a citation error. Claims are extracted by a model and kept only when their quote appears verbatim in the text; each cited source is then checked, with a model’s help, for whether it says what the claim relies on. Those verdicts can be wrong — read the claim’s quote and the cited source before relying on one.
Statistics and arithmetic are recomputed, not judged.
Confidence bands are shown only for fields calibrated on our annotated test set. None is calibrated yet, so no band is shown.
What counts as a claim ›How we measure confidence ›How we check this ›
Are you an author, or do you see a problem with this page? Request a review
Data sources
Bibliographic data: Semantic Scholar, OpenAlex, Crossref.
Contains information from the Semantic Scholar Academic Graph Datasets, made available under the ODC Attribution License (ODC-BY 1.0).
Semantic Scholar’s data is described in: Kinney, R., et al. (2023). The Semantic Scholar Open Data Platform. arXiv:2301.10140.
