Cited by 75

The DOI matches its Crossref record; 9 of the 9 references it cites were found in a registry or an index.

Critical Modulation of Hematopoietic Lineage Fate by Hepatic Leukemia Factor

Wahlestedt, Martin, Ladopoulos, Vasileios, Hidalgo, Isabel, Sanchez Castillo, Manuel, Hannah, Rebecca, Säwén, Petter, Wan, Haixia, Dudenhöffer-Pfeifer, Monika, Magnusson, Mattias, Norddahl, Gudmundur L., Göttgens, Berthold, Bryder, David·2017·Cell Reports

Overview

The claims and statistics of this paper haven’t been checked yet.

Run the check — free, no account needed. It reads the open-access text and checks the sources it cites.

A few free checks a day · papers already verified open instantly · results are public

Integrity signals

Registry

Crossref · 10.1016/j.celrep.2017.10.112

Cites

9 of 9 references verified0 citation errors · 0 not checkable

Statistics

Figures

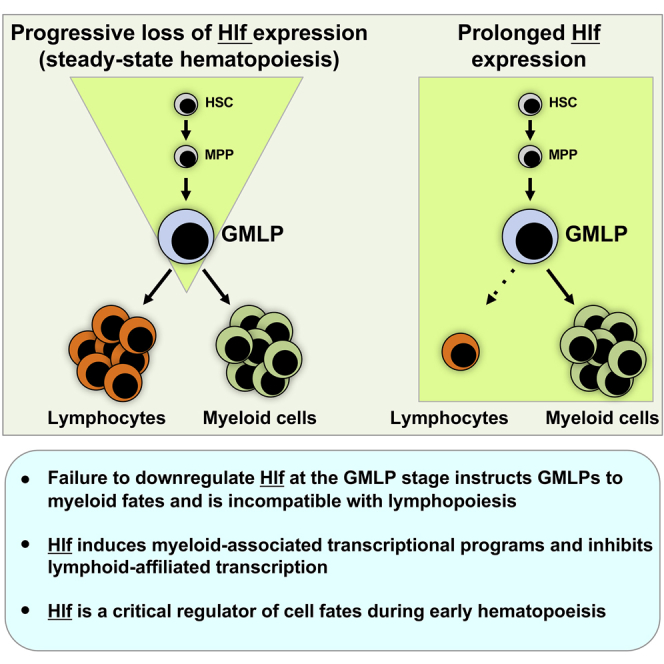
Graphical abstract
Graphical abstract CC BY-NC-ND · PubMed Central
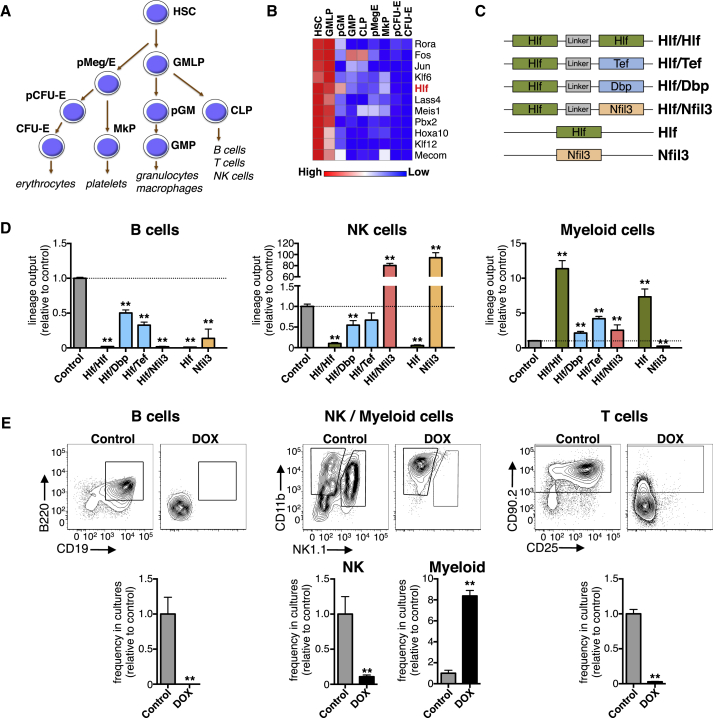
Figure 1 Identification of Hlf as a Candidate Regulator of Early Hematopoiesis (A) Schematic depiction of the progenitor subsets that underlie the early stages of hematopoiesis. (B) Heatmap showing the expression levels of TFs displaying 2-fold or higher expression in HSCs and GMLPs compared with downstream progenitor cell types (mean values of three replicate arrays per cell type, except for HSCs and pMegEs, for which six and five replicate arrays were used, respectively). See also Table S1. (C) Schematic depiction of the different lentiviral constructs used for OP9 stromal co-cultures. (D) The lineage output relative to controls of B cells, NK cells, and myeloid cells produced from Hlf/Hlf, Hlf/Dbp, Hlf/Tef, Hlf/Nfil3, Hlf, Nfil3, and M33-Hlf transduced GMLPs in OP9 stroma co-cultures (n = 6, 6, 6, 6, 6, 3, 6, and 45 cultures, respectively, from two independent experiments). (E) B, NK, and myeloid cell generation in OP9 co-culture experiments and T cell generation in OP9-DL1 co-cultures using Hlf-inducible GMLPs cultured in the absence or presence of DOX. Shown are representative FACS plots as well as bar graphs showing the frequency relative to untreated controls of CD19+ B cells, NK1.1+ NK cells, CD11b+ myeloid cells, and CD90+ T cells in the cultures from three independent experiments (n = 5 for the B, NK, and myeloid experiments, and n = 9 for the T cell experiments). Error bars denote SEM. CFU-erythroid, colony-forming unit-erythroid; MkP, megakaryocyte progenitor; pCFU-erythroid, pre-colony-forming unit-erythroid; pGM, pre-granulocyte-monocyte progenitor; pMeg/erythroid, pre-megakaryocyte-erythroid progenitor. See also Figures S1 and S2.
Figure 1 Identification of Hlf as a Candidate Regulator of Early Hematopoiesis (A) Schematic depiction of the progenitor subsets that underlie the early stages of hematopoiesis. (B) Heatmap showing the expression levels of TFs displaying 2-fold or higher expression in HSCs and GMLPs compared with downstream progenitor cell types (mean values of three replicate arrays per cell type, except for HSCs and pMegEs, for which six and five replicate arrays were used, respectively). See also Table S1. (C) Schematic depiction of the different lentiviral constructs used for OP9 stromal co-cultures. (D) The lineage output relative to controls of B cells, NK cells, and myeloid cells produced from Hlf/Hlf, Hlf/Dbp, Hlf/Tef, Hlf/Nfil3, Hlf, Nfil3, and M33-Hlf transduced GMLPs in OP9 stroma co-cultures (n = 6, 6, 6, 6, 6, 3, 6, and 45 cultures, respectively, from two independent experiments). (E) B, NK, and myeloid cell generation in OP9 co-culture experiments and T cell generation in OP9-DL1 co-cultures using Hlf-inducible GMLPs cultured in the absence or presence of DOX. Shown are representative FACS plots as well as bar graphs showing the frequency relative to untreated controls of CD19+ B cells, NK1.1+ NK cells, CD11b+ myeloid cells, and CD90+ T cells in the cultures from three independent experiments (n = 5 for the B, NK, and myeloid experiments, and n = 9 for the T cell experiments). Error bars denote SEM. CFU-erythroid, colony-forming unit-erythroid; MkP, megakaryocyte progenitor; pCFU-erythroid, pre-colony-forming unit-erythroid; pGM, pre-granulocyte-monocyte progenitor; pMeg/erythroid, pre-megakaryocyte-erythroid progenitor. See also Figures S1 and S2.CC BY-NC-ND · PubMed Central
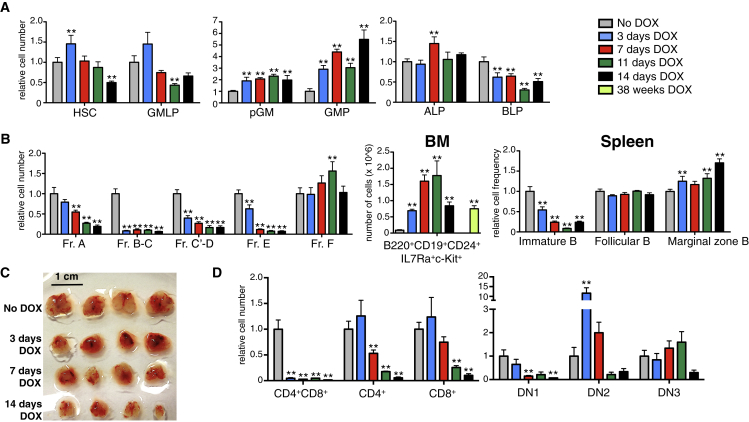
Figure 2 Hlf Induction In Vivo Negatively Influences Lymphopoiesis at the Expense of Enhanced Myelopoiesis Hlf-inducible mice were given DOX via their food pellets for 0, 3, 7, 11, and 14 days (n = 7, 7, 7, 3, and 4 mice in each group, respectively, from two independent experiments) and 38 weeks (n = 5 mice, from one experiment). (A) Bar charts showing the amount of HSCs, GMLPs, pGMs, GMPs, all lymphoid progenitors (ALPs), and B cell-biased lymphoid progenitors (BLPs) in the BM of the analyzed mice (relative to uninduced mice). (B) Relative cell numbers of the analyzed B cell subsets in the BM and relative frequencies of the indicated splenic B cell fractions among all splenocytes in the analyzed mice (relative to uninduced mice). See also Figure S5. (C) Photographs depicting thymi after 0, 3, 7, 11, and 14 days of enforced Hlf expression (four thymi per time point, representative of one of three experiments). The scale bar represents 1 cm. (D) The amount of CD4+CD8+ double-positive, single-positive CD4+, single-positive CD8+ thymocytes, and DN1, DN2, and DN3 thymocytes following the different number of days of DOX administration (relative to uninduced mice). See also Table S1. Error bars denote SEM. ALP, all lymphoid progenitor; BM, bone marrow; BLP, B cell biased lymphoid progenitor; DN, double negative. See also Figures S3 and S4.
Figure 2 Hlf Induction In Vivo Negatively Influences Lymphopoiesis at the Expense of Enhanced Myelopoiesis Hlf-inducible mice were given DOX via their food pellets for 0, 3, 7, 11, and 14 days (n = 7, 7, 7, 3, and 4 mice in each group, respectively, from two independent experiments) and 38 weeks (n = 5 mice, from one experiment). (A) Bar charts showing the amount of HSCs, GMLPs, pGMs, GMPs, all lymphoid progenitors (ALPs), and B cell-biased lymphoid progenitors (BLPs) in the BM of the analyzed mice (relative to uninduced mice). (B) Relative cell numbers of the analyzed B cell subsets in the BM and relative frequencies of the indicated splenic B cell fractions among all splenocytes in the analyzed mice (relative to uninduced mice). See also Figure S5. (C) Photographs depicting thymi after 0, 3, 7, 11, and 14 days of enforced Hlf expression (four thymi per time point, representative of one of three experiments). The scale bar represents 1 cm. (D) The amount of CD4+CD8+ double-positive, single-positive CD4+, single-positive CD8+ thymocytes, and DN1, DN2, and DN3 thymocytes following the different number of days of DOX administration (relative to uninduced mice). See also Table S1. Error bars denote SEM. ALP, all lymphoid progenitor; BM, bone marrow; BLP, B cell biased lymphoid progenitor; DN, double negative. See also Figures S3 and S4.CC BY-NC-ND · PubMed Central
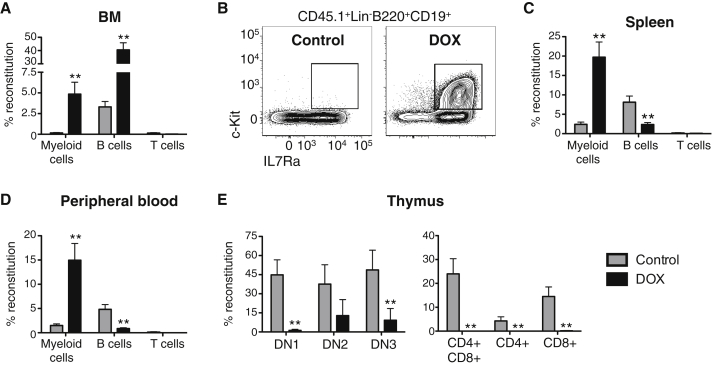
Figure 3 Cell-Autonomous Alterations Underlie the Altered Hematopoiesis Following Enforced Hlf Expression In Vivo Hlf-inducible GMLPs (CD45.1+) were transplanted into sublethally irradiated WT recipient hosts (CD45.2+) maintained on a DOX food diet (n = 6 and 7 mice for the control and DOX groups, respectively, from one of three experiments with similar results). (A) Magnitudes of myeloid B, and T cell reconstitution in the BM of the recipient mice. (B) FACS plots showing the appearance of CD45.1+c-Kit+IL7Ra+CD19+ cells in the BM of mice transplanted with Hlf-induced GMLPs. (C and D) Donor-derived reconstitution of myeloid, B, and T cells in the spleen (C) and the PB (D). (E) The thymi of recipient mice were assessed for donor-derived reconstitution of the indicated thymocyte subsets. Error bars denote SEM. See also Figure S5.
Figure 3 Cell-Autonomous Alterations Underlie the Altered Hematopoiesis Following Enforced Hlf Expression In Vivo Hlf-inducible GMLPs (CD45.1+) were transplanted into sublethally irradiated WT recipient hosts (CD45.2+) maintained on a DOX food diet (n = 6 and 7 mice for the control and DOX groups, respectively, from one of three experiments with similar results). (A) Magnitudes of myeloid B, and T cell reconstitution in the BM of the recipient mice. (B) FACS plots showing the appearance of CD45.1+c-Kit+IL7Ra+CD19+ cells in the BM of mice transplanted with Hlf-induced GMLPs. (C and D) Donor-derived reconstitution of myeloid, B, and T cells in the spleen (C) and the PB (D). (E) The thymi of recipient mice were assessed for donor-derived reconstitution of the indicated thymocyte subsets. Error bars denote SEM. See also Figure S5.CC BY-NC-ND · PubMed Central
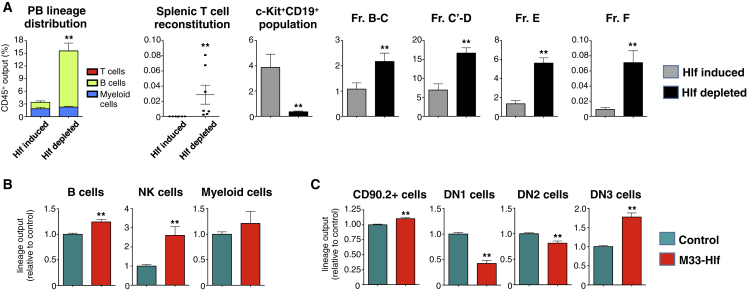
Figure 4 Acute Hlf Depletion and Modulation of Hlf into a Transcriptional Repressor Lead to Enhanced Lymphopoiesis Hlf-inducible GMLPs (CD45.1+) were transplanted into sublethally irradiated WT recipients (CD45.2+) on DOX food. After 14 days, one group of mice was shifted to normal food and kept for another 8 days prior to analysis (“Hlf depleted”), while control mice were treated with DOX throughout the experiment (“Hlf induced,” n = 7 and 6 mice, respectively, from one experiment). (A) Data show the percentage of the indicated donor-derived cell types out of all CD45+ cells. (B and C) The impact of Hlf target gene silencing on differentiation was studied by culturing control or M33-Hlf retrovirus infected WT GMLPs in B/NK and T cell permissive conditions (n = 6 replicates per group from two experiments). Shown is the lineage output relative to controls of indicated subsets in OP9 cultures (B) and OP9-DL1 cultures (C), respectively. Error bars denote SEM.
Figure 4 Acute Hlf Depletion and Modulation of Hlf into a Transcriptional Repressor Lead to Enhanced Lymphopoiesis Hlf-inducible GMLPs (CD45.1+) were transplanted into sublethally irradiated WT recipients (CD45.2+) on DOX food. After 14 days, one group of mice was shifted to normal food and kept for another 8 days prior to analysis (“Hlf depleted”), while control mice were treated with DOX throughout the experiment (“Hlf induced,” n = 7 and 6 mice, respectively, from one experiment). (A) Data show the percentage of the indicated donor-derived cell types out of all CD45+ cells. (B and C) The impact of Hlf target gene silencing on differentiation was studied by culturing control or M33-Hlf retrovirus infected WT GMLPs in B/NK and T cell permissive conditions (n = 6 replicates per group from two experiments). Shown is the lineage output relative to controls of indicated subsets in OP9 cultures (B) and OP9-DL1 cultures (C), respectively. Error bars denote SEM.CC BY-NC-ND · PubMed Central
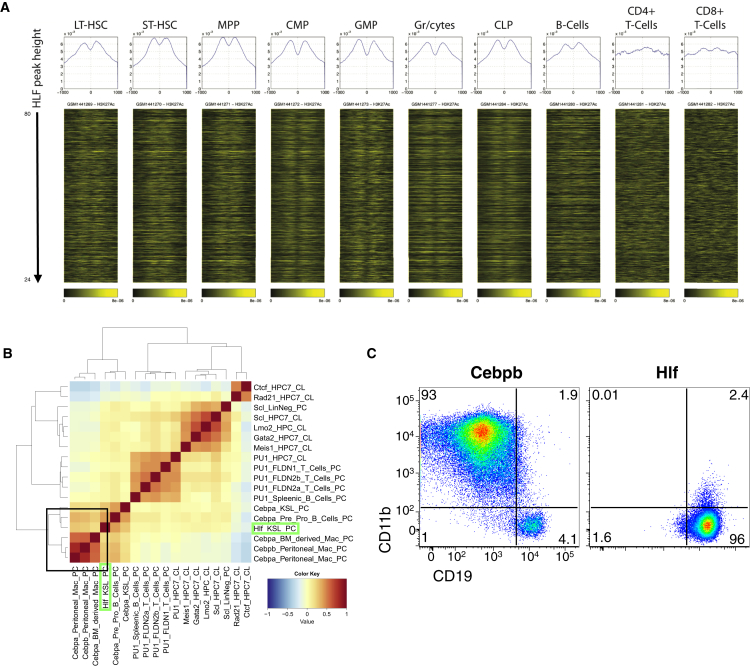
Figure 5 The Genome-wide Binding Characteristics of Hlf WT LSK cells were transduced with either a control retroviral vector or a vector encoding an N-terminal FLAG-tagged variant of Hlf/Hlf and were subjected to ChIP-seq analysis. (A) The Hlf peaks were ranked in a decreasing peak height order, and H3K27Ac signal intensity (Lara-Astiaso et al., 2014) was plotted around the summit of the Hlf peaks and is shown as heatmaps. The histograms at the top of each heatmap depict the average signal intensity around the Hlf peaks for each cell type. (B) Correlation analysis of the putative Hlf targets with those of other hematopoiesis associated TFs. (C) BM resident B cells were subjected to transdifferentiation experiments by transduction with retroviral vectors encoding Cebpb or Hlf and cultured for 4 days on OP9 stromal cells prior to FACS analysis (representative FACS plots from two independent experiments). ChIP, chromatin immunoprecipitation. See also Figure S6.
Figure 5 The Genome-wide Binding Characteristics of Hlf WT LSK cells were transduced with either a control retroviral vector or a vector encoding an N-terminal FLAG-tagged variant of Hlf/Hlf and were subjected to ChIP-seq analysis. (A) The Hlf peaks were ranked in a decreasing peak height order, and H3K27Ac signal intensity (Lara-Astiaso et al., 2014) was plotted around the summit of the Hlf peaks and is shown as heatmaps. The histograms at the top of each heatmap depict the average signal intensity around the Hlf peaks for each cell type. (B) Correlation analysis of the putative Hlf targets with those of other hematopoiesis associated TFs. (C) BM resident B cells were subjected to transdifferentiation experiments by transduction with retroviral vectors encoding Cebpb or Hlf and cultured for 4 days on OP9 stromal cells prior to FACS analysis (representative FACS plots from two independent experiments). ChIP, chromatin immunoprecipitation. See also Figure S6.CC BY-NC-ND · PubMed Central
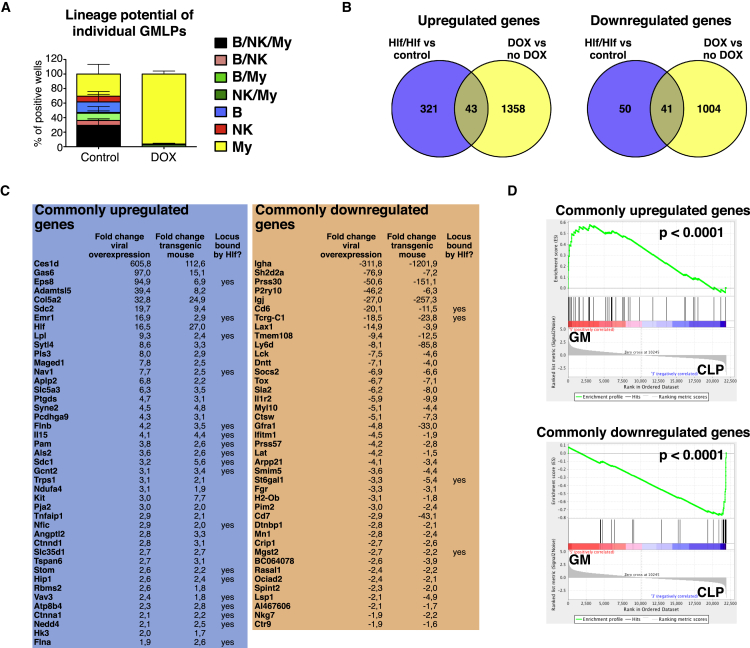
Figure 6 Hlf Instructs GMLPs to Adopt a Myeloid Fate by Upregulation of a Myeloid-Associated Transcriptional Program and a Concomitant Downregulation of Lymphoid-Affiliated Genes (A) Single Hlf-inducible GMLPs were maintained on OP9 stromal cells for 14 days. The lineage potential of each seeded GMLP was determined using FACS, by scoring each well for the presence of B cells, NK cells, and myeloid cells. Shown is the distribution of the different colony types among the positive wells of the control and DOX treated groups. (B) Venn diagrams depicting the number of shared up- and downregulated genes following Hlf induction using the two complementary approaches (compared with controls). (C) Up- and downregulated genes, their fold changes compared with controls using both experimental strategies, and whether they were identified also using ChIP-seq. See also Table S2. (D) GSEA in which the commonly up- and downregulated genes were used as gene sets and correlated against the whole transcriptomes of pGMs and CLPs. Error bars denote SEM. GSEA, gene set enrichment analysis. See also Figure S7.
Figure 6 Hlf Instructs GMLPs to Adopt a Myeloid Fate by Upregulation of a Myeloid-Associated Transcriptional Program and a Concomitant Downregulation of Lymphoid-Affiliated Genes (A) Single Hlf-inducible GMLPs were maintained on OP9 stromal cells for 14 days. The lineage potential of each seeded GMLP was determined using FACS, by scoring each well for the presence of B cells, NK cells, and myeloid cells. Shown is the distribution of the different colony types among the positive wells of the control and DOX treated groups. (B) Venn diagrams depicting the number of shared up- and downregulated genes following Hlf induction using the two complementary approaches (compared with controls). (C) Up- and downregulated genes, their fold changes compared with controls using both experimental strategies, and whether they were identified also using ChIP-seq. See also Table S2. (D) GSEA in which the commonly up- and downregulated genes were used as gene sets and correlated against the whole transcriptomes of pGMs and CLPs. Error bars denote SEM. GSEA, gene set enrichment analysis. See also Figure S7.CC BY-NC-ND · PubMed Central
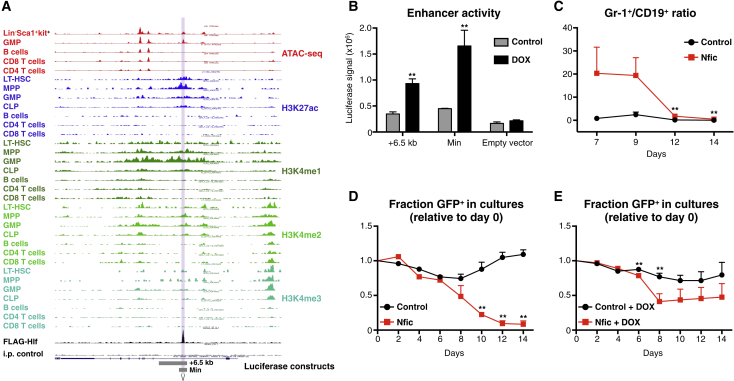
Figure 7 Identification of Nfic as a Direct Hlf Target with Pronounced Functional Effects on Hematopoietic Differentiation (A) UCSC Genome Browser track depicting the genomic context of Nfic with regard to accessible chromatin and histone modifications of indicated cell types (assay for transposase-accessible chromatin using sequencing [ATAC-seq] and histone modification data from Lara-Astiaso et al. (2014). The region occupied by Hlf is highlighted. (B) Luciferase reporter assay of the candidate Nfic enhancer using Hlf-inducible ESCs. Bars denote the mean firefly luciferase signal (±SEM) after normalization against Renilla using the +6.5 kb, a minimal (Min) enhancer construct, or an empty reporter construct, with or without Hlf induction (triplicate cultures from one of three representative experiments). (C and D) Frequency of myeloid and B cells generated as a consequence of enforced Nfic expression. Shown are the ratios of percentage GFP+ Gr1+ myeloid cells over GFP+CD19+ B cells for the indicated groups. Data are from one of three experiments with similar results (n = 6 cultures per group for all cultures except day 14 Nfic, for which five cultures were analyzed). Enforced Nfic expression leads to a general loss of hematopoietic cells over time. Hlf-inducible GMLPs were maintained in the absence (C) or presence (D) of DOX and were transduced with either a control (Migr1) or Nfic retroviral vector and were subsequently cultured on OP9 stroma cells with monitoring every 2 days for frequency of GFP+ cells (n = 1 replicate for days 0, 2, and 4 and n = 5 replicates for days 6, 8, 10, 12, and 14 for the groups in both C and D). Error bars denote SEM. See also Figure S7.
Figure 7 Identification of Nfic as a Direct Hlf Target with Pronounced Functional Effects on Hematopoietic Differentiation (A) UCSC Genome Browser track depicting the genomic context of Nfic with regard to accessible chromatin and histone modifications of indicated cell types (assay for transposase-accessible chromatin using sequencing [ATAC-seq] and histone modification data from Lara-Astiaso et al. (2014). The region occupied by Hlf is highlighted. (B) Luciferase reporter assay of the candidate Nfic enhancer using Hlf-inducible ESCs. Bars denote the mean firefly luciferase signal (±SEM) after normalization against Renilla using the +6.5 kb, a minimal (Min) enhancer construct, or an empty reporter construct, with or without Hlf induction (triplicate cultures from one of three representative experiments). (C and D) Frequency of myeloid and B cells generated as a consequence of enforced Nfic expression. Shown are the ratios of percentage GFP+ Gr1+ myeloid cells over GFP+CD19+ B cells for the indicated groups. Data are from one of three experiments with similar results (n = 6 cultures per group for all cultures except day 14 Nfic, for which five cultures were analyzed). Enforced Nfic expression leads to a general loss of hematopoietic cells over time. Hlf-inducible GMLPs were maintained in the absence (C) or presence (D) of DOX and were transduced with either a control (Migr1) or Nfic retroviral vector and were subsequently cultured on OP9 stroma cells with monitoring every 2 days for frequency of GFP+ cells (n = 1 replicate for days 0, 2, and 4 and n = 5 replicates for days 6, 8, 10, 12, and 14 for the groups in both C and D). Error bars denote SEM. See also Figure S7.CC BY-NC-ND · PubMed Central

Verification

Claims the paper makes

The claims and statistics of this paper haven’t been checked yet.

Run the check — free, no account needed. It reads the open-access text and checks the sources it cites.

A few free checks a day · papers already verified open instantly · results are public

Claims other papers make about this one

Each is checked against this paper’s own text: does it say what the citing paper says it does?

Self-check

Percentages, sums and reported differences re-computed from the paper’s own numbers.

The self-check needs the paper’s full text.

Citations

Cites

Research works printed but not linked: 46

  1. Adolfsson, 2005, Identification of Flt3+ lympho-myeloid stem cells lacking erythro-megakaryocytic potential a revised road map for adult blood lineage commitment, Cell, 121, 295, 10.1016/j.cell.2005.02.013 · DOI
  2. Aranda-Orgilles, 2016, MED12 regulates HSC-specific enhancers independently of mediator kinase activity to control hematopoiesis, Cell Stem Cell, 19, 784, 10.1016/j.stem.2016.08.004 · DOI
  3. Argiropoulos, 2010, Linkage of the potent leukemogenic activity of Meis1 to cell-cycle entry and transcriptional regulation of cyclin D3, Blood, 115, 4071, 10.1182/blood-2009-06-225573 · DOI
  4. Arinobu, 2007, Reciprocal activation of GATA-1 and PU.1 marks initial specification of hematopoietic stem cells into myeloerythroid and myelolymphoid lineages, Cell Stem Cell, 1, 416, 10.1016/j.stem.2007.07.004 · DOI · Paper page
  5. Beard, 2006, Efficient method to generate single-copy transgenic mice by site-specific integration in embryonic stem cells, Genesis, 44, 23, 10.1002/gene.20180 · DOI
  6. Benz, 2008, The stream of precursors that colonizes the thymus proceeds selectively through the early T lineage precursor stage of T cell development, J. Exp. Med., 205, 1187, 10.1084/jem.20072168 · DOI
  7. Bryder, 2006, Hematopoietic stem cells: the paradigmatic tissue-specific stem cell, Am. J. Pathol., 169, 338, 10.2353/ajpath.2006.060312 · DOI
  8. Duque-Afonso, 2015, Conditional expression of E2A-HLF induces B-cell precursor death and myeloproliferative-like disease in knock-in mice, PLoS ONE, 10, e0143216, 10.1371/journal.pone.0143216 · DOI
  9. Fischer, 2015, Genomics and drug profiling of fatal TCF3-HLF-positive acute lymphoblastic leukemia identifies recurrent mutation patterns and therapeutic options, Nat. Genet., 47, 1020, 10.1038/ng.3362 · DOI
  10. Forsberg, 2006, New evidence supporting megakaryocyte-erythrocyte potential of flk2/flt3+ multipotent hematopoietic progenitors, Cell, 126, 415, 10.1016/j.cell.2006.06.037 · DOI
  11. Gachon, 2004, The loss of circadian PAR bZip transcription factors results in epilepsy, Genes Dev., 18, 1397, 10.1101/gad.301404 · DOI
  12. Gachon, 2006, The circadian PAR-domain basic leucine zipper transcription factors DBP, TEF, and HLF modulate basal and inducible xenobiotic detoxification, Cell Metab., 4, 25, 10.1016/j.cmet.2006.04.015 · DOI
  13. Gazit, 2013, Transcriptome analysis identifies regulators of hematopoietic stem and progenitor cells, Stem Cell Reports, 1, 266, 10.1016/j.stemcr.2013.07.004 · DOI
  14. Germain, 2002, T-cell development and the CD4-CD8 lineage decision, Nat. Rev. Immunol., 2, 309, 10.1038/nri798 · DOI
  15. Godfrey, 1992, Phenotypic and functional characterization of c-kit expression during intrathymic T cell development, J. Immunol., 149, 2281, 10.4049/jimmunol.149.7.2281 · DOI
  16. Goodell, 2015, Somatic stem cell heterogeneity: diversity in the blood, skin and intestinal stem cell compartments, Nat. Rev. Mol. Cell Biol., 16, 299, 10.1038/nrm3980 · DOI
  17. Hardy, 2001, B cell development pathways, Annu. Rev. Immunol., 19, 595, 10.1146/annurev.immunol.19.1.595 · DOI
  18. Hardy, 1991, Resolution and characterization of pro-B and pre-pro-B cell stages in normal mouse bone marrow, J. Exp. Med., 173, 1213, 10.1084/jem.173.5.1213 · DOI
  19. Hunger, 1992, Hlf, a novel hepatic bZIP protein, shows altered DNA-binding properties following fusion to E2A in t(17;19) acute lymphoblastic leukemia, Genes Dev., 6, 1608, 10.1101/gad.6.9.1608 · DOI
  20. Inaba, 1992, Fusion of the leucine zipper gene HLF to the E2A gene in human acute B-lineage leukemia, Science, 257, 531, 10.1126/science.1386162 · DOI
  21. Inaba, 1994, DNA-binding specificity and trans-activating potential of the leukemia-associated E2A-hepatic leukemia factor fusion protein, Mol. Cell. Biol., 14, 3403
  22. Inlay, 2009, Ly6d marks the earliest stage of B-cell specification and identifies the branchpoint between B-cell and T-cell development, Genes Dev., 23, 2376, 10.1101/gad.1836009 · DOI
  23. Inukai, 2005, TEF, an antiapoptotic bZIP transcription factor related to the oncogenic E2A-HLF chimera, inhibits cell growth by down-regulating expression of the common beta chain of cytokine receptors, Blood, 105, 4437, 10.1182/blood-2004-08-2976 · DOI
  24. Ji, 2010, Comprehensive methylome map of lineage commitment from haematopoietic progenitors, Nature, 467, 338, 10.1038/nature09367 · DOI
  25. Kamizono, 2009, Nfil3/E4bp4 is required for the development and maturation of NK cells in vivo, J. Exp. Med., 206, 2977, 10.1084/jem.20092176 · DOI
  26. Kondo, 1997, Identification of clonogenic common lymphoid progenitors in mouse bone marrow, Cell, 91, 661, 10.1016/S0092-8674(00)80453-5 · DOI · Paper page
  27. Lara-Astiaso, 2014, Immunogenetics. Chromatin state dynamics during blood formation, Science, 345, 943, 10.1126/science.1256271 · DOI · Paper page
  28. Li, 2001, Model-based analysis of oligonucleotide arrays: model validation, design issues and standard error application, Genome Biol., 2, 10.1186/gb-2001-2-8-research0032 · DOI
  29. Mercer, 2011, Factors and networks that underpin early hematopoiesis, Semin. Immunol., 23, 317, 10.1016/j.smim.2011.08.004 · DOI
  30. Mitsui, 2001, Antagonistic role of E4BP4 and PAR proteins in the circadian oscillatory mechanism, Genes Dev., 15, 995, 10.1101/gad.873501 · DOI
  31. Nakano, 1994, Generation of lymphohematopoietic cells from embryonic stem cells in culture, Science, 265, 1098, 10.1126/science.8066449 · DOI
  32. O’Connor, 2015, Nfix expression critically modulates early B lymphopoiesis and myelopoiesis, PLoS ONE, 10, e0120102, 10.1371/journal.pone.0120102 · DOI
  33. Pronk, 2011, Flow cytometry-based identification of immature myeloerythroid development, Methods Mol. Biol., 699, 275, 10.1007/978-1-61737-950-5_13 · DOI
  34. Pronk, 2008, Deciphering developmental stages of adult myelopoiesis, Cell Cycle, 7, 706, 10.4161/cc.7.6.5565 · DOI
  35. Rico-Vargas, 1994, c-kit expression by B cell precursors in mouse bone marrow. Stimulation of B cell genesis by in vivo treatment with anti-c-kit antibody, J. Immunol., 152, 2845, 10.4049/jimmunol.152.6.2845 · DOI
  36. Roychoudhury, 2015, MEIS1 regulates an HLF-oxidative stress axis in MLL-fusion gene leukemia, Blood, 125, 2544, 10.1182/blood-2014-09-599258 · DOI
  37. Sanjuan-Pla, 2013, Platelet-biased stem cells reside at the apex of the haematopoietic stem-cell hierarchy, Nature, 502, 232, 10.1038/nature12495 · DOI
  38. Schlissel, 1991, Virus-transformed pre-B cells show ordered activation but not inactivation of immunoglobulin gene rearrangement and transcription, J. Exp. Med., 173, 711, 10.1084/jem.173.3.711 · DOI
  39. Schmitt, 2002, Induction of T cell development from hematopoietic progenitor cells by delta-like-1 in vitro, Immunity, 17, 749, 10.1016/S1074-7613(02)00474-0 · DOI · Paper page
  40. Shojaei, 2005, Hierarchical and ontogenic positions serve to define the molecular basis of human hematopoietic stem cell behavior, Dev. Cell, 8, 651, 10.1016/j.devcel.2005.03.004 · DOI
  41. Sun, 2014, Clonal dynamics of native haematopoiesis, Nature, 514, 322, 10.1038/nature13824 · DOI · Paper page
  42. Tung, 2004, Identification of B-cell subsets: an exposition of 11-color (Hi-D) FACS methods, Methods Mol. Biol., 271, 37
  43. Weishaupt, 2010, Epigenetic chromatin states uniquely define the developmental plasticity of murine hematopoietic stem cells, Blood, 115, 247, 10.1182/blood-2009-07-235176 · DOI
  44. Xie, 2004, Stepwise reprogramming of B cells into macrophages, Cell, 117, 663, 10.1016/S0092-8674(04)00419-2 · DOI
  45. Yamamoto, 2013, Clonal analysis unveils self-renewing lineage-restricted progenitors generated directly from hematopoietic stem cells, Cell, 154, 1112, 10.1016/j.cell.2013.08.007 · DOI
  46. Yang, 2010, T-cell lineage determination, Immunol. Rev., 238, 12, 10.1111/j.1600-065X.2010.00956.x · DOI

Cited by

See all 75

Metadata

Authors
Wahlestedt, M., Ladopoulos, V., Hidalgo, I., Sanchez Castillo, M., Hannah, R., Säwén, P., Wan, H., Dudenhöffer-Pfeifer, M., Magnusson, M., Norddahl, G. L., Göttgens, B., & Bryder, D.
Venue
Cell Reports
Publisher
Elsevier BV
Published
2017-11
Volume
21
Issue
8
Pages
2251-2263
ISSN
2211-1247
Cited by
75
References
9
Language
en
Funders
  • Swedish Cancer Society
  • Swedish Medical Research Council
  • Swedish Pediatric Leukemia Foundation
  • Knut and Alice Wallenberg Foundation
  • European Research Council (615068)
  • Wellcome Trust
  • CRUK
  • Bloodwise
  • MRC
  • NIH-NIDDK
  • National Cancer Institute
  • NCI (P30 CA91842, UL1TR000448)
  • National Center for Research Resources

About these checks

Registry, retraction, Cites and statistics results are computed, not judged, with one exception: a printed reference that no index lists is read once by a model before it counts as a citation error. Claims are extracted by a model and kept only when their quote appears verbatim in the text; each cited source is then checked, with a model’s help, for whether it says what the claim relies on. Those verdicts can be wrong — read the claim’s quote and the cited source before relying on one.

Statistics and arithmetic are recomputed, not judged.

Confidence bands are shown only for fields calibrated on our annotated test set. None is calibrated yet, so no band is shown.

What counts as a claim ›How we measure confidence ›How we check this ›

Are you an author, or do you see a problem with this page? Request a review