

The DOI matches its Crossref record; 84 of the 84 references it cites were found in a registry or an index; none of the 53 sources its claims cite is checked for support yet.
A Multi-layered Quantitative In Vivo Expression Atlas of the Podocyte Unravels Kidney Disease Candidate Genes
Open accessAbstract
Damage to and loss of glomerular podocytes has been identified as the culprit lesion in progressive kidney diseases. Here, we combine mass spectrometry-based proteomics with mRNA sequencing, bioinformatics, and hypothesis-driven studies to provide a comprehensive and quantitative map of mammalian podocytes that identifies unanticipated signaling pathways. Comparison of the in vivo datasets with proteomics data from podocyte cell cultures showed a limited value of available cell culture models. Moreover, in vivo stable isotope labeling by amino acids uncovered surprisingly rapid synthesis of mitochondrial proteins under steady-state conditions that was perturbed under autophagy-deficient, disease-susceptible conditions. Integration of acquired omics dimensions suggested FARP1 as a candidate essential for podocyte function, which could be substantiated by genetic analysis in humans and knockdown experiments in zebrafish. This work exemplifies how the integration of multi-omics datasets can identify a framework of cell-type-specific features relevant for organ health and disease.
Overview
AI snapshot
Written from the paper’s full text.
TL;DR
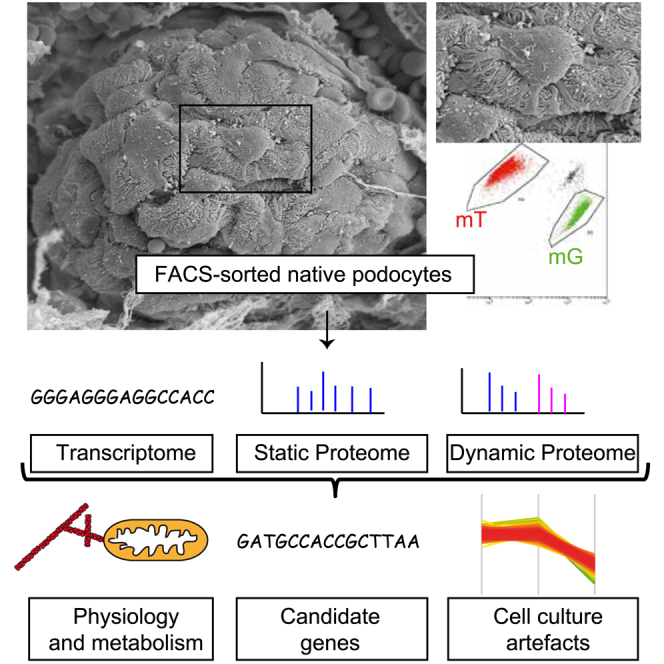
This study combines quantitative in vivo proteomics, mRNA sequencing, and dynamic stable isotope labeling to build a multi-layered atlas of mouse podocytes and glomerular non-podocytes. Integrating these datasets identifies podocyte-enriched proteins, cell-culture artifacts, proteostatic features, and FARP1 as a candidate nephrotic syndrome gene.
Key findings
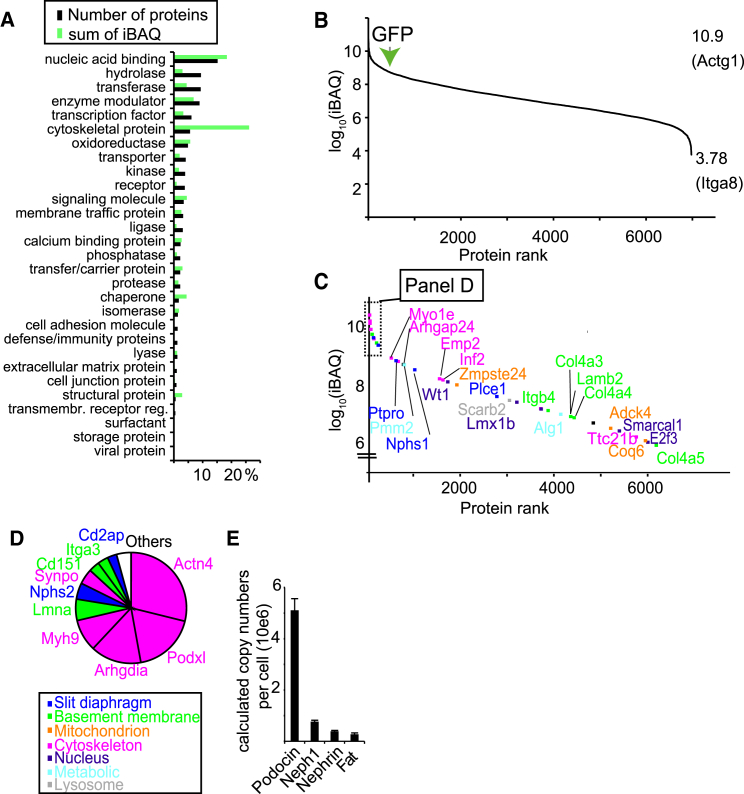
- Deep mapping identified more than 9,000 proteins, with absolute quantification of 6,979 proteins; 551 proteins were significantly podocyte-enriched. Disease-associated genes comprised 35 of 7,000 (0.5%) quantified proteins but contributed approximately 4% of podocyte protein mass, and the slit diaphragm complex podocin-Neph1-Nephrin-Fat1 showed a copy-number ratio of ∼10:2:1:0.5.
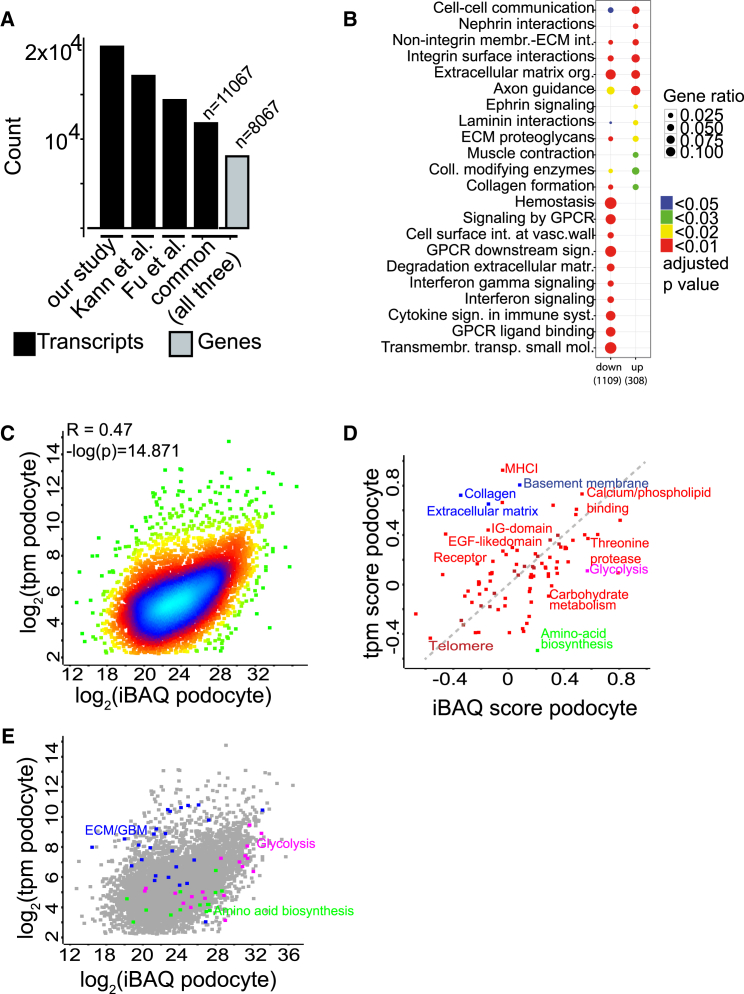
- Podocyte mRNA and protein abundances correlated only weakly overall (Pearson’s R = 0.47), though the correlation was stronger for podocytes than non-podocytes; 2D enrichment showed ECM proteins decreased and metabolic proteins stabilized relative to mRNA.
- In vivo stable isotope labeling revealed rapid synthesis of mitochondrial proteins under steady-state conditions; ATG5 podocyte-specific knockout podocytes showed significantly lower incorporation of ER proteins and significantly higher incorporation of mitochondrial proteins compared with controls.
- Multi-omics integration nominated FARP1: a homozygous FARP1 mutation was found in one family with nephrotic syndrome, and farp1 knockdown in zebrafish larvae caused pericardial edema and proteinuria.
Methods
- Podocytes and non-podocyte glomerular cells were isolated by FACS from hNPHS2Cre∗mT/mG mice, then analyzed by mass spectrometry-based proteomics, mRNA sequencing, and bioinformatics; absolute protein quantification used iBAQ and the proteomic ruler.
- In vivo stable isotope labeling used adult mice fed 13C6-lysine for 1, 2, and 3 weeks, with hierarchical clustering of heavy/light ratios and comparison to ATG5 podocyte-specific knockout mice.
- Cultured mouse and human podocytes were compared with native podocytes, including growth on soft matrices with an elastic modulus of 12 kPa; human genetic screening used exome sequencing of 430 families with hereditary nephrotic syndrome and a second cohort of 700 patients with nephrotic syndrome.
Limitations
- Stated: stable isotope incorporation data “do not strictly correlate with a protein ‘half-life’ because of intracellular amino acid recycling”; several known podocyte genes, such as Trpc6, were identified but could not be quantified because of low abundance; the second FARP1 patient’s alleles could not be confirmed to segregate because family DNA was unavailable; and the ATG5-related mitochondrial findings “need further corroboration.”
- Evident from the text: the human genetic evidence for FARP1 is limited to one homozygous family plus a second heterozygous patient with unclear segregation, and the functional support comes from zebrafish knockdown rather than rescue experiments.
- Evident from the text: the cell-culture comparison relies on a previously published immortalized mouse podocyte line, and the paper notes that soft-matrix culture does not restore podocyte-specific actin binders or membrane proteins.
Model-written summary. Check it against the paper before relying on it.
Integrity signals
Registry
Cites
Statistics
Figures
Verification
Claims the paper makes
58 Own result · 32 Not checked yet · 19 Own interpretation · 5 Own method · 5 No basis given
A result the paper reports from its own data — it cites no other source for it, so there is none to check. The quote shows it is in the paper.
In the paper
“We performed absolute quantification of 6,979 proteins using the intensity-based absolute quantification (iBAQ) approach (Table S2).”
§ A Multi-layered Quantitative In Vivo Expression Atlas of the Podocyte Unravels Kidney Disease Candidate Genes > Results > Absolute Quantification of the Native Podocyte Proteome
plain- Asserted: passes — The authors put it forward as true.
- Checkable: passes — It can be checked against evidence.
- Load-bearing: passes — The paper’s conclusions depend on it.
- Based: passes — The paper gives a reason why it holds.
A result the paper reports from its own data — it cites no other source for it, so there is none to check. The quote shows it is in the paper.
In the paper
“This approach identified, in total, more than 9,000 different proteins (Tables S1 and S2).”
§ A Multi-layered Quantitative In Vivo Expression Atlas of the Podocyte Unravels Kidney Disease Candidate Genes > Results > Absolute Quantification of the Native Podocyte Proteome
plain- Asserted: passes — The authors put it forward as true.
- Checkable: passes — It can be checked against evidence.
- Load-bearing: unclear — It is unclear whether the paper’s conclusions depend on it.
- Based: passes — The paper gives a reason why it holds.
A result the paper reports from its own data — it cites no other source for it, so there is none to check. The quote shows it is in the paper.
In the paper
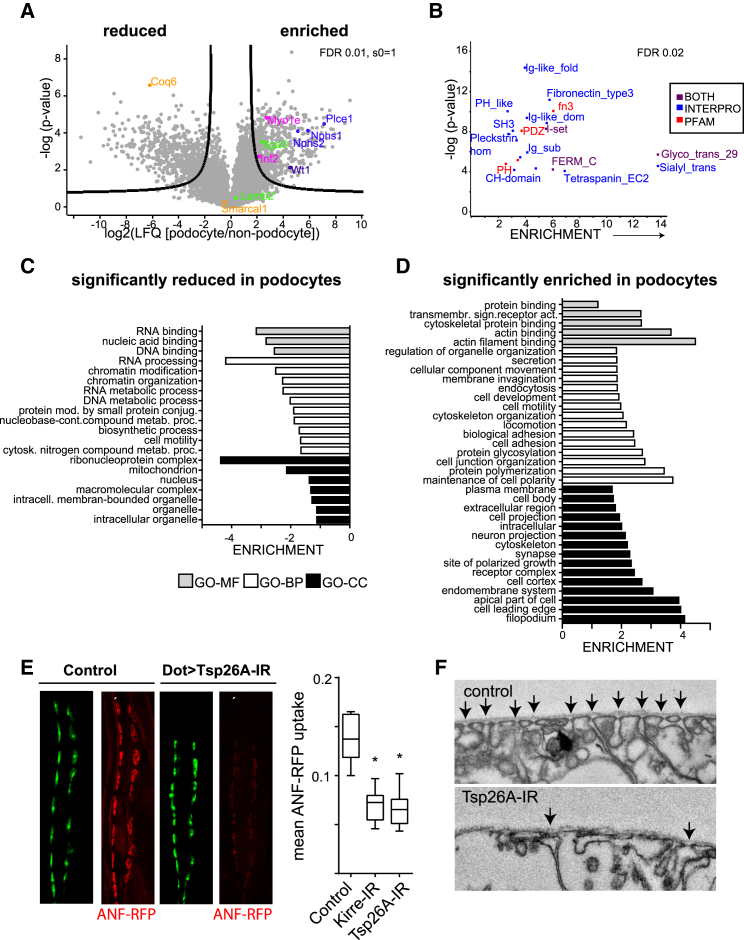
“We also found overt alterations in nephrocyte ultrastructure (Figure 3F)”
§ A Multi-layered Quantitative In Vivo Expression Atlas of the Podocyte Unravels Kidney Disease Candidate Genes > Results > Determination of Podocyte-Enriched Proteins
plaindirect- Asserted: passes — The authors put it forward as true.
- Checkable: passes — It can be checked against evidence.
- Load-bearing: passes — The paper’s conclusions depend on it.
- Based: passes — The paper gives a reason why it holds.
In the paper
“among these were many gene products currently known to be associated with hereditary nephrotic syndrome (Sadowski et al., 2015).”
§ A Multi-layered Quantitative In Vivo Expression Atlas of the Podocyte Unravels Kidney Disease Candidate Genes > Results > Determination of Podocyte-Enriched Proteins
What the sources say
- Not checked yetcites Sadowski et al., 2015 source
plaincorrelational- Asserted: passes — The authors put it forward as true.
- Checkable: passes — It can be checked against evidence.
- Load-bearing: unclear — It is unclear whether the paper’s conclusions depend on it.
- Based: passes — The paper gives a reason why it holds.
A result the paper reports from its own data — it cites no other source for it, so there is none to check. The quote shows it is in the paper.
In the paper
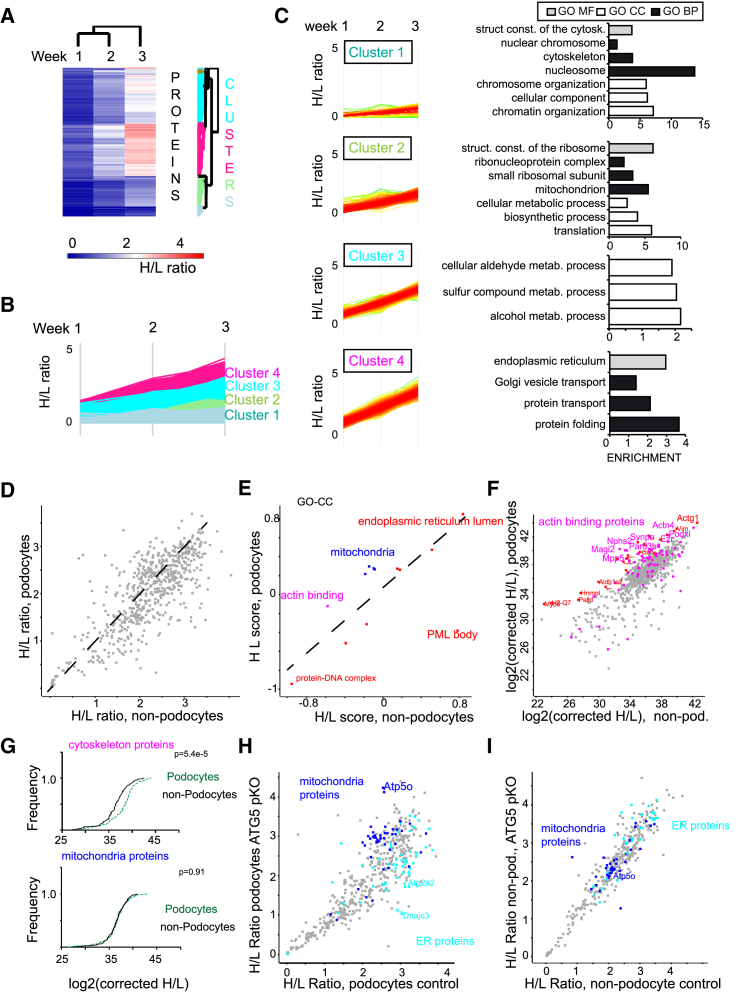
“and, surprisingly a significantly higher incorporation of mitochondrial proteins compared with control podocytes (Figure 5H).”
§ A Multi-layered Quantitative In Vivo Expression Atlas of the Podocyte Unravels Kidney Disease Candidate Genes > Results > Analysis of Podocyte Proteome Dynamics and Integration with Deep Proteomics Mapping
plaindirect- Asserted: passes — The authors put it forward as true.
- Checkable: passes — It can be checked against evidence.
- Load-bearing: passes — The paper’s conclusions depend on it.
- Based: passes — The paper gives a reason why it holds.
A result the paper reports from its own data — it cites no other source for it, so there is none to check. The quote shows it is in the paper.
In the paper
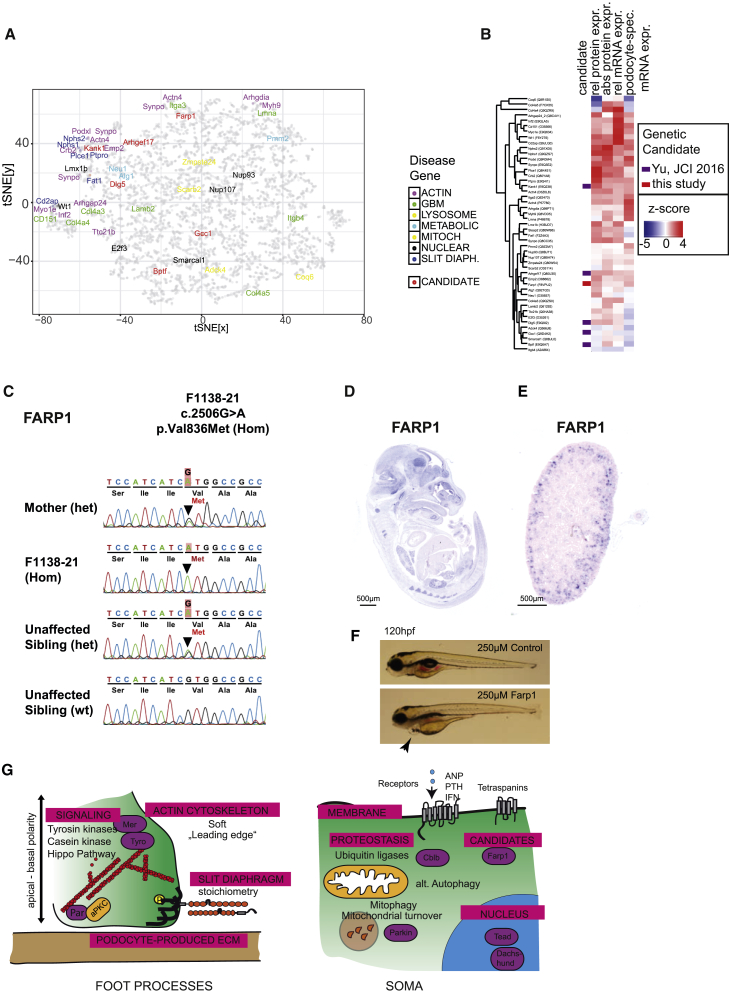
“the allele segregates with the affect status within the family (Figure 6C)”
§ A Multi-layered Quantitative In Vivo Expression Atlas of the Podocyte Unravels Kidney Disease Candidate Genes > Results > Multi-omics Integration Reveals Candidate Genes for Podocyte Function in Humans
plaincorrelationalSingle case- Asserted: passes — The authors put it forward as true.
- Checkable: passes — It can be checked against evidence.
- Load-bearing: passes — The paper’s conclusions depend on it.
- Based: passes — The paper gives a reason why it holds.
A result the paper reports from its own data — it cites no other source for it, so there is none to check. The quote shows it is in the paper.
In the paper
“The proteins RhoA, Actin, and Grb and the nephrin-regulating kinase Src had most edges within these networks (Figure S4B)”
§ A Multi-layered Quantitative In Vivo Expression Atlas of the Podocyte Unravels Kidney Disease Candidate Genes > Results > Determination of Podocyte-Enriched Proteins
plaincorrelational- Asserted: passes — The authors put it forward as true.
- Checkable: passes — It can be checked against evidence.
- Load-bearing: unclear — It is unclear whether the paper’s conclusions depend on it.
- Based: passes — The paper gives a reason why it holds.
A result the paper reports from its own data — it cites no other source for it, so there is none to check. The quote shows it is in the paper.
In the paper
“The analysis revealed that ECM protein expression was decreased as expected by the respective mRNA expression”
§ A Multi-layered Quantitative In Vivo Expression Atlas of the Podocyte Unravels Kidney Disease Candidate Genes > Results > Integration of Deep Transcriptomic and Proteomics Data
plaincorrelational- Asserted: passes — The authors put it forward as true.
- Checkable: passes — It can be checked against evidence.
- Load-bearing: unclear — It is unclear whether the paper’s conclusions depend on it.
- Based: passes — The paper gives a reason why it holds.
The paper states this without a source or data behind it here, so there is nothing to check it against. The quote shows it is in the paper.
In the paper
“the mutation affects amino acid residues that are highly conserved among orthologs across evolution”
§ A Multi-layered Quantitative In Vivo Expression Atlas of the Podocyte Unravels Kidney Disease Candidate Genes > Results > Multi-omics Integration Reveals Candidate Genes for Podocyte Function in Humans
plain- Asserted: passes — The authors put it forward as true.
- Checkable: passes — It can be checked against evidence.
- Load-bearing: passes — The paper’s conclusions depend on it.
- Based: passes — The paper gives a reason why it holds.
A result the paper reports from its own data — it cites no other source for it, so there is none to check. The quote shows it is in the paper.
In the paper
“Isotope-labeled lysine incorporation in non-podocyte cells was not changed dramatically across both conditions (Figure 5I).”
§ A Multi-layered Quantitative In Vivo Expression Atlas of the Podocyte Unravels Kidney Disease Candidate Genes > Results > Analysis of Podocyte Proteome Dynamics and Integration with Deep Proteomics Mapping
plain- Asserted: passes — The authors put it forward as true.
- Checkable: passes — It can be checked against evidence.
- Load-bearing: passes — The paper’s conclusions depend on it.
- Based: passes — The paper gives a reason why it holds.
- It may state two separate claims as one. 25
- The quote only partly states this claim. 1
- Probably not a substantial claim. 25
A result the paper reports from its own data — it cites no other source for it, so there is none to check. The quote shows it is in the paper.
In the paper
“Significantly enriched protein domains were Fn3 and immunoglobulin G (IgG)-like domains (e.g., in Nephrin), PDZ domains (e.g., in ezrin and Par-3), i-set domains (e.g., in nephrin and VCAM/NCAM), CH domain (e.g., in actinin-4), and FERM domain proteins (e.g., in ezrin) or tetraspanins (e.g., CD151).”
§ A Multi-layered Quantitative In Vivo Expression Atlas of the Podocyte Unravels Kidney Disease Candidate Genes > Results > Determination of Podocyte-Enriched Proteins
plaincorrelational- Asserted: passes — The authors put it forward as true.
- Checkable: passes — It can be checked against evidence.
- Load-bearing: unclear — It is unclear whether the paper’s conclusions depend on it.
- Based: passes — The paper gives a reason why it holds.
It may state two separate claims as one.
A result the paper reports from its own data — it cites no other source for it, so there is none to check. The quote shows it is in the paper.
In the paper
“An unexpected finding was that podocytes have high mitochondrial protein synthesis but an overall low protein copy number of mitochondrial proteins.”
§ A Multi-layered Quantitative In Vivo Expression Atlas of the Podocyte Unravels Kidney Disease Candidate Genes > Results > Analysis of Podocyte Proteome Dynamics and Integration with Deep Proteomics Mapping
plain- Asserted: passes — The authors put it forward as true.
- Checkable: passes — It can be checked against evidence.
- Load-bearing: passes — The paper’s conclusions depend on it.
- Based: passes — The paper gives a reason why it holds.
It may state two separate claims as one.
A result the paper reports from its own data — it cites no other source for it, so there is none to check. The quote shows it is in the paper.
In the paper
“Our dataset was similar to previously published mRNA sequencing (mRNA-seq) analyses but demonstrated a greater depth upon analysis with the same parameters (Figure 2A; Table S3; Figure S2).”
§ A Multi-layered Quantitative In Vivo Expression Atlas of the Podocyte Unravels Kidney Disease Candidate Genes > Results > Integration of Deep Transcriptomic and Proteomics Data
boostedcorrelational- Asserted: passes — The authors put it forward as true.
- Checkable: passes — It can be checked against evidence.
- Load-bearing: unclear — It is unclear whether the paper’s conclusions depend on it.
- Based: passes — The paper gives a reason why it holds.
It may state two separate claims as one.
A result the paper reports from its own data — it cites no other source for it, so there is none to check. The quote shows it is in the paper.
In the paper
“We found that disease-associated genes in slit diaphragm and actin-related processes were largely defined by very high Z scores in all of the four parameters and clustered close to each other (Figures 6A and 6B).”
§ A Multi-layered Quantitative In Vivo Expression Atlas of the Podocyte Unravels Kidney Disease Candidate Genes > Results > Multi-omics Integration Reveals Candidate Genes for Podocyte Function in Humans
plaincorrelational- Asserted: passes — The authors put it forward as true.
- Checkable: passes — It can be checked against evidence.
- Load-bearing: passes — The paper’s conclusions depend on it.
- Based: passes — The paper gives a reason why it holds.
It may state two separate claims as one.
A result the paper reports from its own data — it cites no other source for it, so there is none to check. The quote shows it is in the paper.
In the paper
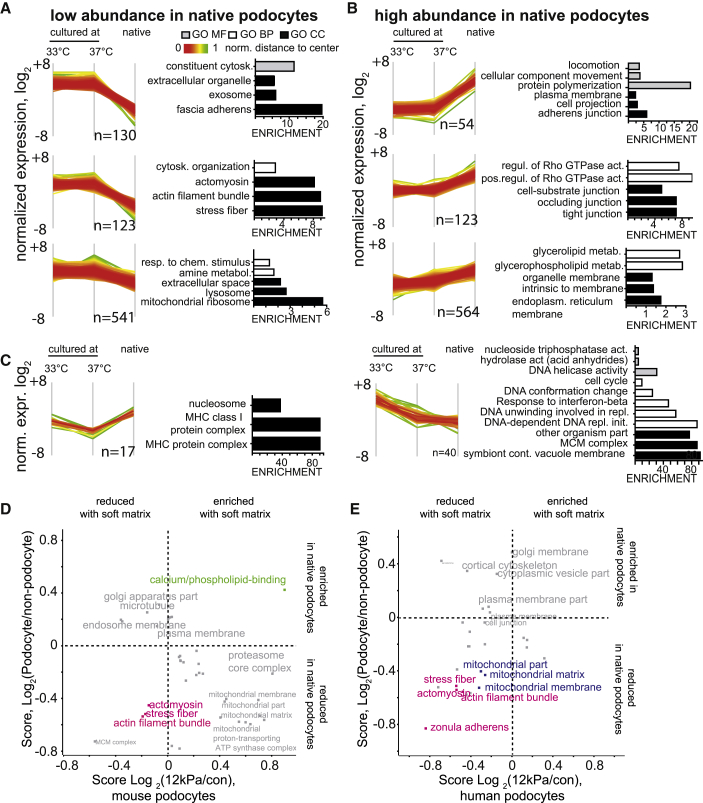
“Three clusters contained proteins with high abundance in cell lines compared with the native podocytes and were enriched for proteins related to the actin cytoskeleton, including stress fibers and focal adhesion proteins (Figure 4A).”
§ A Multi-layered Quantitative In Vivo Expression Atlas of the Podocyte Unravels Kidney Disease Candidate Genes > Results > Comparison of the Deep Native Podocyte Proteome with the Cultured Podocyte Proteome
plaincorrelational- Asserted: passes — The authors put it forward as true.
- Checkable: passes — It can be checked against evidence.
- Load-bearing: passes — The paper’s conclusions depend on it.
- Based: passes — The paper gives a reason why it holds.
It may state two separate claims as one.
A result the paper reports from its own data — it cites no other source for it, so there is none to check. The quote shows it is in the paper.
In the paper
“iBAQ data were correlated with the transcriptomic (tpm) values, but the correlation was rather weak (Figure 2C).”
§ A Multi-layered Quantitative In Vivo Expression Atlas of the Podocyte Unravels Kidney Disease Candidate Genes > Results > Integration of Deep Transcriptomic and Proteomics Data
plaincorrelational- Asserted: passes — The authors put it forward as true.
- Checkable: passes — It can be checked against evidence.
- Load-bearing: unclear — It is unclear whether the paper’s conclusions depend on it.
- Based: passes — The paper gives a reason why it holds.
It may state two separate claims as one.
A result the paper reports from its own data — it cites no other source for it, so there is none to check. The quote shows it is in the paper.
In the paper
“with cytoskeletal proteins like Actn4 and Arhgdia contributing most to this amount (Figure 1D).”
§ A Multi-layered Quantitative In Vivo Expression Atlas of the Podocyte Unravels Kidney Disease Candidate Genes > Results > Absolute Quantification of the Native Podocyte Proteome
plaincorrelational- Asserted: passes — The authors put it forward as true.
- Checkable: passes — It can be checked against evidence.
- Load-bearing: unclear — It is unclear whether the paper’s conclusions depend on it.
- Based: passes — The paper gives a reason why it holds.
The quote only partly states this claim.
A result the paper reports from its own data — it cites no other source for it, so there is none to check. The quote shows it is in the paper.
In the paper
“These “disease-associated genes,” although only comprising 35 of 7,000 (0.5%) absolutely quantified proteins, contributed approximately 4% of the podocyte protein mass”
§ A Multi-layered Quantitative In Vivo Expression Atlas of the Podocyte Unravels Kidney Disease Candidate Genes > Results > Absolute Quantification of the Native Podocyte Proteome
plaincorrelational- Asserted: passes — The authors put it forward as true.
- Checkable: passes — It can be checked against evidence.
- Load-bearing: passes — The paper’s conclusions depend on it.
- Based: passes — The paper gives a reason why it holds.
It may state two separate claims as one.
A result the paper reports from its own data — it cites no other source for it, so there is none to check. The quote shows it is in the paper.
In the paper
“Several other known podocyte genes (e.g., Trpc6) were identified but could not be quantified because of their low abundance.”
§ A Multi-layered Quantitative In Vivo Expression Atlas of the Podocyte Unravels Kidney Disease Candidate Genes > Results > Absolute Quantification of the Native Podocyte Proteome
plaindirect- Asserted: passes — The authors put it forward as true.
- Checkable: passes — It can be checked against evidence.
- Load-bearing: fails — The paper’s conclusions may not depend on it.
- Based: passes — The paper gives a reason why it holds.
Probably not a substantial claim. The paper’s conclusions may not depend on it.
A result the paper reports from its own data — it cites no other source for it, so there is none to check. The quote shows it is in the paper.
In the paper
“On a global level, actin filament proteins and stress fiber proteins were significantly depleted by culturing podocytes on the “soft” matrix, which made them, in this regard, “more similar” to the native podocyte (based on the log2 ratio of podocyte/non-podocyte protein expression) (Figure 4D).”
§ A Multi-layered Quantitative In Vivo Expression Atlas of the Podocyte Unravels Kidney Disease Candidate Genes > Results > Comparison of the Deep Native Podocyte Proteome with the Cultured Podocyte Proteome
plaindirect- Asserted: passes — The authors put it forward as true.
- Checkable: passes — It can be checked against evidence.
- Load-bearing: passes — The paper’s conclusions depend on it.
- Based: passes — The paper gives a reason why it holds.
It may state two separate claims as one.
A result the paper reports from its own data — it cites no other source for it, so there is none to check. The quote shows it is in the paper.
In the paper
“We could identify 6,193 proteins in both samples, representing a significant overlap between both samples (Figure S4C).”
§ A Multi-layered Quantitative In Vivo Expression Atlas of the Podocyte Unravels Kidney Disease Candidate Genes > Results > Comparison of the Deep Native Podocyte Proteome with the Cultured Podocyte Proteome
hedgedcorrelational- Asserted: passes — The authors put it forward as true.
- Checkable: passes — It can be checked against evidence.
- Load-bearing: passes — The paper’s conclusions depend on it.
- Based: passes — The paper gives a reason why it holds.
It may state two separate claims as one.
In the paper
“Two clusters showed differences between 33°C and 37°C and native cells; these were, as expected (Rinschen et al., 2016b), related to the cell cycle (Figure 4C).”
§ A Multi-layered Quantitative In Vivo Expression Atlas of the Podocyte Unravels Kidney Disease Candidate Genes > Results > Comparison of the Deep Native Podocyte Proteome with the Cultured Podocyte Proteome
What the sources say
- Not checked yetcites Rinschen et al., 2016b
plaincorrelational- Asserted: passes — The authors put it forward as true.
- Checkable: passes — It can be checked against evidence.
- Load-bearing: unclear — It is unclear whether the paper’s conclusions depend on it.
- Based: passes — The paper gives a reason why it holds.
It may state two separate claims as one.
A result the paper reports from its own data — it cites no other source for it, so there is none to check. The quote shows it is in the paper.
In the paper
“On a global level, podocyte-specific proteins were significantly reduced for mitochondria as well as RNA and DNA binding proteins (Figure 3C)”
§ A Multi-layered Quantitative In Vivo Expression Atlas of the Podocyte Unravels Kidney Disease Candidate Genes > Results > Determination of Podocyte-Enriched Proteins
plaindirect- Asserted: passes — The authors put it forward as true.
- Checkable: passes — It can be checked against evidence.
- Load-bearing: unclear — It is unclear whether the paper’s conclusions depend on it.
- Based: passes — The paper gives a reason why it holds.
It may state two separate claims as one.
A result the paper reports from its own data — it cites no other source for it, so there is none to check. The quote shows it is in the paper.
In the paper
“of 80,000 predominantly healthy individuals (Exome Aggregation Consortium [ExAC]), the minor allele frequency of either allele is below 0.01%, and it has not been reported in the homozygous state”
§ A Multi-layered Quantitative In Vivo Expression Atlas of the Podocyte Unravels Kidney Disease Candidate Genes > Results > Multi-omics Integration Reveals Candidate Genes for Podocyte Function in Humans
plain- Asserted: passes — The authors put it forward as true.
- Checkable: passes — It can be checked against evidence.
- Load-bearing: passes — The paper’s conclusions depend on it.
- Based: passes — The paper gives a reason why it holds.
It may state two separate claims as one.
In the paper
“This candidate gene, and the genes identified in a recent population-based study (Yu et al., 2016), clustered close to known disease genes (Figure 6A), and all shared high Z scores in at least three of the four parameters analyzed (Figure 6B).”
§ A Multi-layered Quantitative In Vivo Expression Atlas of the Podocyte Unravels Kidney Disease Candidate Genes > Results > Multi-omics Integration Reveals Candidate Genes for Podocyte Function in Humans
What the sources say
- Not checked yetcites Yu et al., 2016
plaincorrelational- Asserted: passes — The authors put it forward as true.
- Checkable: passes — It can be checked against evidence.
- Load-bearing: passes — The paper’s conclusions depend on it.
- Based: passes — The paper gives a reason why it holds.
It may state two separate claims as one.
The paper states this without a source or data behind it here, so there is nothing to check it against. The quote shows it is in the paper.
In the paper
“Cultivation on soft matrices does not, however, increase the expression of podocyte-specific actin binders or podocyte membrane proteins, which are only minimally expressed under both conditions.”
§ A Multi-layered Quantitative In Vivo Expression Atlas of the Podocyte Unravels Kidney Disease Candidate Genes > Discussion
plain- Asserted: passes — The authors put it forward as true.
- Checkable: passes — It can be checked against evidence.
- Load-bearing: unclear — It is unclear whether the paper’s conclusions depend on it.
- Based: passes — The paper gives a reason why it holds.
It may state two separate claims as one.
A result the paper reports from its own data — it cites no other source for it, so there is none to check. The quote shows it is in the paper.
In the paper
“knockdown of the farp1 mRNA in zebrafish larvae resulted in a phenotype of pericardial edema as well as proteinuria”
§ A Multi-layered Quantitative In Vivo Expression Atlas of the Podocyte Unravels Kidney Disease Candidate Genes > Results > Multi-omics Integration Reveals Candidate Genes for Podocyte Function in Humans
plaindirect- Asserted: passes — The authors put it forward as true.
- Checkable: passes — It can be checked against evidence.
- Load-bearing: passes — The paper’s conclusions depend on it.
- Based: passes — The paper gives a reason why it holds.
It may state two separate claims as one.
A result the paper reports from its own data — it cites no other source for it, so there is none to check. The quote shows it is in the paper.
In the paper
“A significant fraction of these proteins, however, has not been extensively studied and will require further consideration”
§ A Multi-layered Quantitative In Vivo Expression Atlas of the Podocyte Unravels Kidney Disease Candidate Genes > Discussion
plain- Asserted: passes — The authors put it forward as true.
- Checkable: passes — It can be checked against evidence.
- Load-bearing: unclear — It is unclear whether the paper’s conclusions depend on it.
- Based: passes — The paper gives a reason why it holds.
It may state two separate claims as one.
A result the paper reports from its own data — it cites no other source for it, so there is none to check. The quote shows it is in the paper.
In the paper
“Podocytes express a high abundance of actin-binding proteins and proteins known to be localizing to the leading edge of the cell”
§ A Multi-layered Quantitative In Vivo Expression Atlas of the Podocyte Unravels Kidney Disease Candidate Genes > Discussion
plain- Asserted: passes — The authors put it forward as true.
- Checkable: passes — It can be checked against evidence.
- Load-bearing: unclear — It is unclear whether the paper’s conclusions depend on it.
- Based: passes — The paper gives a reason why it holds.
It may state two separate claims as one.
A result the paper reports from its own data — it cites no other source for it, so there is none to check. The quote shows it is in the paper.
In the paper
“the cultivation of either human or mouse podocyte cells on soft matrices resulted in a major shift in the proteome, which partly reduced this actin-related cell culture artefact”
§ A Multi-layered Quantitative In Vivo Expression Atlas of the Podocyte Unravels Kidney Disease Candidate Genes > Discussion
plaindirect- Asserted: passes — The authors put it forward as true.
- Checkable: passes — It can be checked against evidence.
- Load-bearing: passes — The paper’s conclusions depend on it.
- Based: passes — The paper gives a reason why it holds.
It may state two separate claims as one.
None of the sources cited for this claim have been checked yet.
In the paper
“mediators of alternative autophagy (e.g., Rab9 and Becn1) are abundantly expressed in podocytes but not significantly enriched”
§ A Multi-layered Quantitative In Vivo Expression Atlas of the Podocyte Unravels Kidney Disease Candidate Genes > Discussion
plain- Asserted: passes — The authors put it forward as true.
- Checkable: passes — It can be checked against evidence.
- Load-bearing: unclear — It is unclear whether the paper’s conclusions depend on it.
- Based: passes — The paper gives a reason why it holds.
It may state two separate claims as one.
None of the sources cited for this claim have been checked yet.
In the paper
“In addition, in vivo stable amino acid isotope labeling strategies opened new avenues for the quantification of protein dynamics when used in pulse experiments (Krüger et al., 2008, Savas et al., 2012, Toyama et al., 2013).”
§ A Multi-layered Quantitative In Vivo Expression Atlas of the Podocyte Unravels Kidney Disease Candidate Genes > Introduction
What the sources say
plaindirect- Asserted: passes — The authors put it forward as true.
- Checkable: passes — It can be checked against evidence.
- Load-bearing: fails — The paper’s conclusions may not depend on it.
- Based: passes — The paper gives a reason why it holds.
Probably not a substantial claim. The paper’s conclusions may not depend on it.
None of the sources cited for this claim have been checked yet.
In the paper
“As a result, proteins can be resolved and quantified relatively and absolutely, culminating in a near-comprehensive mass spectrometry-based expression map of the human proteome (Kim et al., 2014, Wilhelm et al., 2014).”
§ A Multi-layered Quantitative In Vivo Expression Atlas of the Podocyte Unravels Kidney Disease Candidate Genes > Introduction
What the sources say
plaindirect- Asserted: passes — The authors put it forward as true.
- Checkable: passes — It can be checked against evidence.
- Load-bearing: fails — The paper’s conclusions may not depend on it.
- Based: passes — The paper gives a reason why it holds.
Probably not a substantial claim. The paper’s conclusions may not depend on it. It may state two separate claims as one.
None of the sources cited for this claim have been checked yet.
In the paper
“This proteomics parameter is relative to copy numbers in a given sample (Kohli et al., 2014, Schwanhäusser et al., 2011).”
§ A Multi-layered Quantitative In Vivo Expression Atlas of the Podocyte Unravels Kidney Disease Candidate Genes > Results > Absolute Quantification of the Native Podocyte Proteome
What the sources say
plaincorrelational- Asserted: passes — The authors put it forward as true.
- Checkable: passes — It can be checked against evidence.
- Load-bearing: fails — The paper’s conclusions may not depend on it.
- Based: passes — The paper gives a reason why it holds.
Probably not a substantial claim. The paper’s conclusions may not depend on it.
In the paper
“The incorporation of this essential amino acid should correlate with the dynamic synthesis rate (although these data do not strictly correlate with a protein “half-life” because of intracellular amino acid recycling (Krüger et al., 2008)).”
§ A Multi-layered Quantitative In Vivo Expression Atlas of the Podocyte Unravels Kidney Disease Candidate Genes > Results > Analysis of Podocyte Proteome Dynamics and Integration with Deep Proteomics Mapping
What the sources say
- Not checked yetcites Krüger et al., 2008 source
hedgedcorrelational- Asserted: passes — The authors put it forward as true.
- Checkable: passes — It can be checked against evidence.
- Load-bearing: passes — The paper’s conclusions depend on it.
- Based: passes — The paper gives a reason why it holds.
It may state two separate claims as one.
A conclusion the paper draws from its own results — it cites no other source for it, so there is none to check. The quote shows it is in the paper.
In the paper
“We postulated that some of these differences may have been a cell culture artefact because of the mechanical properties of the plastic dish on which these cells were cultivated.”
§ A Multi-layered Quantitative In Vivo Expression Atlas of the Podocyte Unravels Kidney Disease Candidate Genes > Results > Comparison of the Deep Native Podocyte Proteome with the Cultured Podocyte Proteome
hedgedconditional- Asserted: passes — The authors put it forward as true.
- Checkable: passes — It can be checked against evidence.
- Load-bearing: passes — The paper’s conclusions depend on it.
- Based: passes — The paper gives a reason why it holds.
Probably not a substantial claim.
In the paper
“Podocyte protein homeostasis largely depends on signaling mediated via posttranslational modifications, such as phosphorylation, ubiquitylation, acetylation, and proteolytic processing (New et al., 2014).”
§ A Multi-layered Quantitative In Vivo Expression Atlas of the Podocyte Unravels Kidney Disease Candidate Genes > Results > Determination of Podocyte-Enriched Proteins
What the sources say
- Not checked yetcites New et al., 2014 source
plaindirect- Asserted: passes — The authors put it forward as true.
- Checkable: passes — It can be checked against evidence.
- Load-bearing: fails — The paper’s conclusions may not depend on it.
- Based: passes — The paper gives a reason why it holds.
Probably not a substantial claim. The paper’s conclusions may not depend on it.
In the paper
“The ATG5 pKO allele makes podocytes extremely susceptible to damage (Hartleben et al., 2010).”
§ A Multi-layered Quantitative In Vivo Expression Atlas of the Podocyte Unravels Kidney Disease Candidate Genes > Results > Analysis of Podocyte Proteome Dynamics and Integration with Deep Proteomics Mapping
What the sources say
- Not checked yetcites Hartleben et al., 2010 source
plaindirect- Asserted: passes — The authors put it forward as true.
- Checkable: passes — It can be checked against evidence.
- Load-bearing: fails — The paper’s conclusions may not depend on it.
- Based: passes — The paper gives a reason why it holds.
Probably not a substantial claim. The paper’s conclusions may not depend on it.
In the paper
“Still, proteins synthesized rapidly should exhibit a high heavy amino acid incorporation rate (and a high heavy/light [H/L] ratio), whereas stable, “long-lived” proteins with slow translation should have a lower incorporation rate (Savas et al., 2012).”
§ A Multi-layered Quantitative In Vivo Expression Atlas of the Podocyte Unravels Kidney Disease Candidate Genes > Results > Analysis of Podocyte Proteome Dynamics and Integration with Deep Proteomics Mapping
What the sources say
- Not checked yetcites Savas et al., 2012 source
plaincorrelational- Asserted: passes — The authors put it forward as true.
- Checkable: passes — It can be checked against evidence.
- Load-bearing: passes — The paper’s conclusions depend on it.
- Based: passes — The paper gives a reason why it holds.
It may state two separate claims as one.
What the paper did — it cites no source for this, so there is none to check. The quote shows it is in the paper.
In the paper
“The mass spectrometers were calibrated weekly.”
§ A Multi-layered Quantitative In Vivo Expression Atlas of the Podocyte Unravels Kidney Disease Candidate Genes > Experimental Procedures > Liquid Chromatography-Tandem Mass Spectrometry Acquistion
plain- Asserted: passes — The authors put it forward as true.
- Checkable: passes — It can be checked against evidence.
- Load-bearing: fails — The paper’s conclusions may not depend on it.
- Based: passes — The paper gives a reason why it holds.
Probably not a substantial claim. The paper’s conclusions may not depend on it.
What the paper did — it cites no source for this, so there is none to check. The quote shows it is in the paper.
In the paper
“Validated cell lines were regularly tested for mycoplasms using a commercial kit (VENOR, Sigma).”
§ A Multi-layered Quantitative In Vivo Expression Atlas of the Podocyte Unravels Kidney Disease Candidate Genes > Experimental Procedures > Cell Culture and Proteomics Analysis
plain- Asserted: passes — The authors put it forward as true.
- Checkable: passes — It can be checked against evidence.
- Load-bearing: fails — The paper’s conclusions may not depend on it.
- Based: passes — The paper gives a reason why it holds.
Probably not a substantial claim. The paper’s conclusions may not depend on it.
A conclusion the paper draws from its own results — it cites no other source for it, so there is none to check. The quote shows it is in the paper.
In the paper
“these data provide a unique resource and starting point for the next level of systematic understanding of podocyte identity, function, and glomerular disease mechanisms, including a systems view of podocyte proteome dynamics”
§ A Multi-layered Quantitative In Vivo Expression Atlas of the Podocyte Unravels Kidney Disease Candidate Genes > Discussion
plain- Asserted: passes — The authors put it forward as true.
- Checkable: fails — It may be too vague to check against evidence.
- Load-bearing: passes — The paper’s conclusions depend on it.
- Based: passes — The paper gives a reason why it holds.
Probably not a substantial claim. It may be too vague to check against evidence.
In the paper
“a similar number of proteins has been shown to be expressed in native neurons”
§ A Multi-layered Quantitative In Vivo Expression Atlas of the Podocyte Unravels Kidney Disease Candidate Genes > Discussion
What the sources say
- Not checked yetcites Sharma et al., 2015 source
plain- Asserted: passes — The authors put it forward as true.
- Checkable: passes — It can be checked against evidence.
- Load-bearing: fails — The paper’s conclusions may not depend on it.
- Based: passes — The paper gives a reason why it holds.
Probably not a substantial claim. The paper’s conclusions may not depend on it.
In the paper
“a finding that could be caused by stiffness of the cell culture dish”
§ A Multi-layered Quantitative In Vivo Expression Atlas of the Podocyte Unravels Kidney Disease Candidate Genes > Discussion
What the sources say
- Not checked yetcites Gilbert et al., 2010 source
hedgedconditional- Asserted: passes — The authors put it forward as true.
- Checkable: passes — It can be checked against evidence.
- Load-bearing: fails — The paper’s conclusions may not depend on it.
- Based: passes — The paper gives a reason why it holds.
Probably not a substantial claim. The paper’s conclusions may not depend on it.
A conclusion the paper draws from its own results — it cites no other source for it, so there is none to check. The quote shows it is in the paper.
In the paper
“based on these global proteomic data, this paradigm could be further expanded”
§ A Multi-layered Quantitative In Vivo Expression Atlas of the Podocyte Unravels Kidney Disease Candidate Genes > Discussion
hedgedconditional- Asserted: passes — The authors put it forward as true.
- Checkable: fails — It may be too vague to check against evidence.
- Load-bearing: fails — The paper’s conclusions may not depend on it.
- Based: passes — The paper gives a reason why it holds.
Probably not a substantial claim. It may be too vague to check against evidence. The paper’s conclusions may not depend on it.
None of the sources cited for this claim have been checked yet.
In the paper
“At least 10,000 proteins are suggested to be expressed in a cultured cell line”
§ A Multi-layered Quantitative In Vivo Expression Atlas of the Podocyte Unravels Kidney Disease Candidate Genes > Discussion
What the sources say
hedged- Asserted: passes — The authors put it forward as true.
- Checkable: passes — It can be checked against evidence.
- Load-bearing: fails — The paper’s conclusions may not depend on it.
- Based: passes — The paper gives a reason why it holds.
Probably not a substantial claim. The paper’s conclusions may not depend on it.
None of the sources cited for this claim have been checked yet.
In the paper
“Several of the proteins, but by far not all of them, have already been studied in podocytes and have been linked in part by dramatic phenotypes in conditional and targeted mouse models (e.g., protein kinase C) (Huber et al., 2009) or human patients (e.g., MAGI2; Bierzynska et al., 2016).”
§ A Multi-layered Quantitative In Vivo Expression Atlas of the Podocyte Unravels Kidney Disease Candidate Genes > Discussion
What the sources say
plaincorrelational- Asserted: passes — The authors put it forward as true.
- Checkable: passes — It can be checked against evidence.
- Load-bearing: unclear — It is unclear whether the paper’s conclusions depend on it.
- Based: passes — The paper gives a reason why it holds.
It may state two separate claims as one.
A conclusion the paper draws from its own results — it cites no other source for it, so there is none to check. The quote shows it is in the paper.
In the paper
“Therefore, the podocyte has an overall low abundance of mitochondrial proteins but high mitochondrial resynthesis and, assuming a steady-state equilibrium, also turnover.”
§ A Multi-layered Quantitative In Vivo Expression Atlas of the Podocyte Unravels Kidney Disease Candidate Genes > Discussion
plaindirect- Asserted: passes — The authors put it forward as true.
- Checkable: passes — It can be checked against evidence.
- Load-bearing: passes — The paper’s conclusions depend on it.
- Based: passes — The paper gives a reason why it holds.
It may state two separate claims as one.
- The authors state this as an assumption: The podocyte is in a steady-state equilibrium with respect to mitochondrial protein synthesis and degradation.
A conclusion the paper draws from its own results — it cites no other source for it, so there is none to check. The quote shows it is in the paper.
In the paper
“This opens the door for a potential integrative “reverse genetic” approach to predict functionally relevant candidate genes associated with human podocyte diseases (Figure 6; Table S7) and prioritize them for further functional testing”
§ A Multi-layered Quantitative In Vivo Expression Atlas of the Podocyte Unravels Kidney Disease Candidate Genes > Discussion
hedgedcorrelational- Asserted: passes — The authors put it forward as true.
- Checkable: fails — It may be too vague to check against evidence.
- Load-bearing: passes — The paper’s conclusions depend on it.
- Based: passes — The paper gives a reason why it holds.
Probably not a substantial claim. It may be too vague to check against evidence.
A conclusion the paper draws from its own results — it cites no other source for it, so there is none to check. The quote shows it is in the paper.
In the paper
“which may be directly translated to novel experimental studies”
§ A Multi-layered Quantitative In Vivo Expression Atlas of the Podocyte Unravels Kidney Disease Candidate Genes > Discussion
hedgedconditional- Asserted: passes — The authors put it forward as true.
- Checkable: fails — It may be too vague to check against evidence.
- Load-bearing: fails — The paper’s conclusions may not depend on it.
- Based: passes — The paper gives a reason why it holds.
Probably not a substantial claim. It may be too vague to check against evidence. The paper’s conclusions may not depend on it.
None of the sources cited for this claim have been checked yet.
In the paper
“Cultured podocytes are widely used to investigate podocyte damage and serve as a model to study the regulation of the cytoskeleton and many other aspects of podocyte biology”
§ A Multi-layered Quantitative In Vivo Expression Atlas of the Podocyte Unravels Kidney Disease Candidate Genes > Discussion
What the sources say
- Not checked yetcites Lee et al., 2015a
- Not checked yetcites Shankland, 2006 source
- Not checked yetcites Yu et al., 2013
plain- Asserted: passes — The authors put it forward as true.
- Checkable: passes — It can be checked against evidence.
- Load-bearing: fails — The paper’s conclusions may not depend on it.
- Based: passes — The paper gives a reason why it holds.
Probably not a substantial claim. The paper’s conclusions may not depend on it. It may state two separate claims as one.
In the paper
“ATG5, a protein essential for autophagy”
§ A Multi-layered Quantitative In Vivo Expression Atlas of the Podocyte Unravels Kidney Disease Candidate Genes > Discussion
What the sources say
- Not checked yetcites Hartleben et al., 2010 source
plain- Asserted: passes — The authors put it forward as true.
- Checkable: passes — It can be checked against evidence.
- Load-bearing: passes — The paper’s conclusions depend on it.
- Based: passes — The paper gives a reason why it holds.
Probably not a substantial claim.
None of the sources cited for this claim have been checked yet.
In the paper
“The leading edge is a long-established model to study the cell biology of podocyte foot processes, and eventual slit diaphragm signaling”
§ A Multi-layered Quantitative In Vivo Expression Atlas of the Podocyte Unravels Kidney Disease Candidate Genes > Discussion
What the sources say
boosted- Asserted: passes — The authors put it forward as true.
- Checkable: passes — It can be checked against evidence.
- Load-bearing: fails — The paper’s conclusions may not depend on it.
- Based: passes — The paper gives a reason why it holds.
Probably not a substantial claim. The paper’s conclusions may not depend on it.
In the paper
“many of these proteins oppose the formation of stress fibers by promoting actin branching to promote a “motile” phenotype”
§ A Multi-layered Quantitative In Vivo Expression Atlas of the Podocyte Unravels Kidney Disease Candidate Genes > Discussion
What the sources say
- Not checked yetcites Higgs and Pollard, 2001
plaindirect- Asserted: passes — The authors put it forward as true.
- Checkable: passes — It can be checked against evidence.
- Load-bearing: fails — The paper’s conclusions may not depend on it.
- Based: passes — The paper gives a reason why it holds.
Probably not a substantial claim. The paper’s conclusions may not depend on it.
A conclusion the paper draws from its own results — it cites no other source for it, so there is none to check. The quote shows it is in the paper.
In the paper
“The concept presented here will be advantageous for understanding cell-type-specific function in health and disease.”
§ A Multi-layered Quantitative In Vivo Expression Atlas of the Podocyte Unravels Kidney Disease Candidate Genes > Discussion
plain- Asserted: passes — The authors put it forward as true.
- Checkable: fails — It may be too vague to check against evidence.
- Load-bearing: passes — The paper’s conclusions depend on it.
- Based: passes — The paper gives a reason why it holds.
Probably not a substantial claim. It may be too vague to check against evidence.
- Rests on an assumption: The podocyte is a central gatekeeper to prevent proteinuria and renal failure.
- Rests on an assumption: Interrogation of individual cell types at multiple omics levels can yield insights into both essential molecular components and preventive strategies.
In the paper
“specific members of the tetraspanin family, which were confirmed in Drosophila nephrocyte studies as highly conserved functional regulators of filtering cells”
§ A Multi-layered Quantitative In Vivo Expression Atlas of the Podocyte Unravels Kidney Disease Candidate Genes > Discussion
What the sources say
- Not checked yetcites Sachs et al., 2012 source
boosteddirect- Asserted: passes — The authors put it forward as true.
- Checkable: passes — It can be checked against evidence.
- Load-bearing: fails — The paper’s conclusions may not depend on it.
- Based: passes — The paper gives a reason why it holds.
Probably not a substantial claim. The paper’s conclusions may not depend on it.
What the paper did — it cites no source for this, so there is none to check. The quote shows it is in the paper.
In the paper
“For large-scale data, correction for multiple testing was performed as described in the respective bioinformatics method sections.”
§ A Multi-layered Quantitative In Vivo Expression Atlas of the Podocyte Unravels Kidney Disease Candidate Genes > Experimental Procedures > Statistics
plain- Asserted: passes — The authors put it forward as true.
- Checkable: passes — It can be checked against evidence.
- Load-bearing: passes — The paper’s conclusions depend on it.
- Based: passes — The paper gives a reason why it holds.
Probably not a substantial claim.
What the paper did — it cites no source for this, so there is none to check. The quote shows it is in the paper.
In the paper
“In general, p < 0.05 was considered significant.”
§ A Multi-layered Quantitative In Vivo Expression Atlas of the Podocyte Unravels Kidney Disease Candidate Genes > Experimental Procedures > Statistics
plain- Asserted: passes — The authors put it forward as true.
- Checkable: passes — It can be checked against evidence.
- Load-bearing: fails — The paper’s conclusions may not depend on it.
- Based: passes — The paper gives a reason why it holds.
Probably not a substantial claim. The paper’s conclusions may not depend on it.
In the paper
“a key molecule controlling mitophagy”
§ A Multi-layered Quantitative In Vivo Expression Atlas of the Podocyte Unravels Kidney Disease Candidate Genes > Discussion
What the sources say
- Not checked yetcites Narendra et al., 2008 source
plaindirect- Asserted: passes — The authors put it forward as true.
- Checkable: passes — It can be checked against evidence.
- Load-bearing: passes — The paper’s conclusions depend on it.
- Based: passes — The paper gives a reason why it holds.
Probably not a substantial claim.
The paper relies on this without support.
Damage to and loss of glomerular podocytes is the culprit lesion in progressive kidney diseases.
“Damage to and loss of glomerular podocytes has been identified as the culprit lesion in progressive kidney diseases.”
The paper relies on this without support.
Deterioration of podocyte function and subsequent proteinuria are critical accelerators of renal functional decline in disease states.
“deterioration of podocyte function and subsequent proteinuria are critical accelerators of renal functional decline in disease states.”
The paper relies on this without support.
The molecular identity of the podocyte is not defined.
“the molecular identity of the podocyte is not defined”
The paper relies on this without support.
It is unclear how podocyte function could be targeted therapeutically.
“it is unclear how its function could be targeted therapeutically.”
The paper relies on this without support.
The podocyte needs to maintain its proteome because of considerable metabolic and mechanical stress, and this is a prerequisite to maintain its architecture, cytoskeletal integrity, signal transduction, and metabolic function.
“Because of considerable metabolic and mechanical stress, the podocyte needs to maintain its proteome—a prerequisite to maintain its architecture, cytoskeletal integrity, signal transduction, and metabolic function.”
The paper relies on this without support.
Most genes mutated in genetic forms of proteinuria or nephrotic syndrome encode podocyte-enriched genes.
“Most of the genes mutated in genetic forms of proteinuria or nephrotic syndrome encode for podocyte-enriched genes.”
The paper relies on this without support.
Podocyte cell cultures are a commonly used tool in podocyte research.
“a commonly used tool in podocyte research.”
The authors state this as an assumption.
The podocyte is in a steady-state equilibrium with respect to mitochondrial protein synthesis and degradation.
“assuming a steady-state equilibrium”
The paper relies on this without support.
The podocyte is a central gatekeeper to prevent proteinuria and renal failure.
“the podocyte has emerged as a central gatekeeper to prevent proteinuria and renal failure, two unmet and frequent clinical symptoms associated with dramatically increased cardiovascular risk.”
The paper relies on this without support.
Interrogation of individual cell types at multiple omics levels can yield insights into both essential molecular components and preventive strategies.
“Interrogation of individual cell types at multiple omics levels can yield insights into both essential molecular components and preventive strategies.”
Claims other papers make about this one
Each is checked against this paper’s own text: does it say what the citing paper says it does?
In the citing paper
“evidence from unbiased research, such as omics studies201, is still lacking”
From Autophagy in kidney homeostasis and disease (2020) · cites this paper as [201]
Self-check
Percentages, sums and reported differences re-computed from the paper’s own numbers.
Each contradiction between two passages listed here was confirmed by an independent check.
Rated minor: it would not touch a result — a value no result rests on, a p-value that stays on the same side of the significance level, or a conflict that is clerical, resolved elsewhere in the paper, or outside its own findings.
In the paper
§ A Multi-layered Quantitative In Vivo Expression Atlas of the Podocyte Unravels Kidney Disease Candidate Genes > Results > Comparison of the Deep Native Podocyte Proteome with the Cultured Podocyte Proteome
“Three clusters contained proteins with low abundance in cell lines compared with the native podocytes (Figure 4B).”
§ A Multi-layered Quantitative In Vivo Expression Atlas of the Podocyte Unravels Kidney Disease Candidate Genes > Results > Comparison of the Deep Native Podocyte Proteome with the Cultured Podocyte Proteome
“(B) Three clusters have a lower intensity (and abundance) in the podocyte proteome compared with the cultured podocyte proteome.”
Rated minor: it would not touch a result — a value no result rests on, a p-value that stays on the same side of the significance level, or a conflict that is clerical, resolved elsewhere in the paper, or outside its own findings.
In the paper
§ A Multi-layered Quantitative In Vivo Expression Atlas of the Podocyte Unravels Kidney Disease Candidate Genes > Results > Determination of Podocyte-Enriched Proteins
“enriched for signaling receptors, cytoskeleton-associated proteins, GTPase-associated proteins, membrane proteins, and (phospho)lipid-modifying proteins (Figure 3D).”
§ A Multi-layered Quantitative In Vivo Expression Atlas of the Podocyte Unravels Kidney Disease Candidate Genes > Results > Determination of Podocyte-Enriched Proteins
“(D) Significantly de-enriched GO terms in the 551 podocyte-specific proteins (the same statistical criteria and color code as in C).”
Rated minor: it would not touch a result — a value no result rests on, a p-value that stays on the same side of the significance level, or a conflict that is clerical, resolved elsewhere in the paper, or outside its own findings.
In the paper
§ A Multi-layered Quantitative In Vivo Expression Atlas of the Podocyte Unravels Kidney Disease Candidate Genes > Results > Determination of Podocyte-Enriched Proteins
“podocyte-specific proteins were significantly reduced for mitochondria as well as RNA and DNA binding proteins (Figure 3C)”
§ A Multi-layered Quantitative In Vivo Expression Atlas of the Podocyte Unravels Kidney Disease Candidate Genes > Results > Determination of Podocyte-Enriched Proteins
“(C) GO terms overrepresented in the 551 podocyte-enriched proteins compared with non-podocyte specific proteins.”
Citations
Cites
Tissue-based map of the human proteome
Uhlén, M., Fagerberg, L., Hallström, B. M., Lindskog, C., Oksvold, P., Mardinoglu, A., Sivertsson, Å., Kampf, C., Sjöstedt, E., Asplund, A., et al. (2015) · Science · doi:10.1126/science.1260419 · Cited by 15,286
Global quantification of mammalian gene expression control
Schwanhäusser, B., Busse, D., Li, N., Dittmar, G., Schuchhardt, J., Wolf, J., Chen, W., & Selbach, M. (2011) · Nature · doi:10.1038/nature10098 · Cited by 6,566 · cited 2×
“This proteomics parameter is relative to copy numbers in a given sample (Kohli et al., 2014; Schwanhäusser et al., 2011).”
BackgroundInsights into the regulation of protein abundance from proteomic and transcriptomic analyses
Vogel, C., & Marcotte, E. M. (2012) · Nature Reviews Genetics · doi:10.1038/nrg3185 · Cited by 4,195
Parkin is recruited selectively to impaired mitochondria and promotes their autophagy
Narendra, D., Tanaka, A., Suen, D.-F., & Youle, R. J. (2008) · The Journal of Cell Biology · doi:10.1083/jcb.200809125 · Cited by 4,026
A global double-fluorescent Cre reporter mouse
Muzumdar, M. D., Tasic, B., Miyamichi, K., Li, L., & Luo, L. (2007) · genesis · doi:10.1002/dvg.20335 · Cited by 3,491
On the Dependency of Cellular Protein Levels on mRNA Abundance
Liu, Y., Beyer, A., & Aebersold, R. (2016) · Cell · doi:10.1016/j.cell.2016.03.014 · Cited by 3,221
A draft map of the human proteome
Kim, M.-S., Pinto, S. M., Getnet, D., Nirujogi, R. S., Manda, S. S., Chaerkady, R., Madugundu, A. K., Kelkar, D. S., Isserlin, R., Jain, S., et al. (2014) · Nature · doi:10.1038/nature13302 · Cited by 2,198
Kestilä, M., Lenkkeri, U., Männikkö, M., Lamerdin, J., McCready, P., Putaala, H., Ruotsalainen, V., Morita, T., Nissinen, M., Herva, R., et al. (1998) · Molecular Cell · doi:10.1016/s1097-2765(00)80057-x · Cited by 1,866
Mass-spectrometry-based draft of the human proteome
Wilhelm, M., Schlegl, J., Hahne, H., Gholami, A. M., Lieberenz, M., Savitski, M. M., Ziegler, E., Butzmann, L., Gessulat, S., Marx, H., et al. (2014) · Nature · doi:10.1038/nature13319 · Cited by 1,820
Kulak, N. A., Pichler, G., Paron, I., Nagaraj, N., & Mann, M. (2014) · Nature Methods · doi:10.1038/nmeth.2834 · Cited by 1,719
Cited by
Sorted by citations
Autophagy in kidney homeostasis and disease
Tang, C., Livingston, M. J., Liu, Z., & Dong, Z. (2020) · Nature Reviews Nephrology · doi:10.1038/s41581-020-0309-2 · Cited by 496
3D organoid-derived human glomeruli for personalised podocyte disease modelling and drug screening
Hale, L. J., Howden, S. E., Phipson, B., Lonsdale, A., Er, P. X., Ghobrial, I. M., Hosawi, S. B. I., Wilson, S. B., Lawlor, K. T., Khan, S., et al. (2018) · Nature Communications · doi:10.1038/s41467-018-07594-z · Cited by 228
Xie, J., Liu, L., Mladkova, N., Li, Y., Ren, H., Wang, W., Cui, Z., Lin, L., Hu, X., Yu, X., et al. (2020) · Nature Communications · doi:10.1038/s41467-020-15383-w · Cited by 222
A molecular mechanism explaining albuminuria in kidney disease
Butt, L., Unnersjö‐Jess, D., Höhne, M., Edwards, A., Binz-Lotter, J., Reilly, D., Hahnfeldt, R., Ziegler, V., Fremter, K., Rinschen, M. M., et al. (2020) · Nature Metabolism · doi:10.1038/s42255-020-0204-y · Cited by 166
Self-citationNeural cell adhesion molecule 1 is a novel autoantigen in membranous lupus nephritis
Caza, T. N., Hassen, S. I., Kuperman, M. B., Sharma, S. G., Dvanajscak, Z., Arthur, J. M., Edmondson, R., Storey, A. J., Herzog, C., Kenan, D. J., et al. (2020) · Kidney International · doi:10.1016/j.kint.2020.09.016 · Cited by 158
Metadata
- Authors
- Rinschen, M. M., Gödel, M., Grahammer, F., Zschiedrich, S., Helmstädter, M., Kretz, O., Zarei, M., Braun, D. A., Dittrich, S., Pahmeyer, C., Schroder, P., Teetzen, C., Gee, H., Daouk, G., Pohl, M., Kuhn, E., Schermer, B., Küttner, V., Boerries, M., Busch, H., Schiffer, M., Bergmann, C., Krüger, M., Hildebrandt, F., Dengjel, J., Benzing, T., & Huber, T. B.
- Affiliations
- University of Cologne (DE)
- University of Freiburg (DE)
- Boston Children's Hospital (US)
- Mount Desert Island Biological Laboratory (US)
- Corresponding author
- Rinschen, Markus M.
- Benzing, Thomas
- Huber, Tobias B.
- ORCID
- Rinschen, Markus M.
- Gödel, Markus
- Grahammer, Florian
- Zschiedrich, Stefan
- Helmstädter, Martin
- Kretz, Oliver
- Zarei, Mostafa
- Braun, Daniela A.
- Dittrich, Sebastian
- Daouk, Ghaleb
- Schermer, Bernhard
- Boerries, Melanie
- Busch, Hauke
- Schiffer, Mario
- Bergmann, Carsten
- Krüger, Marcus
- Hildebrandt, Friedhelm
- Benzing, Thomas
- Huber, Tobias B.
- Venue
- Cell Reports
- Publisher
- Elsevier BV
- Published
- 2018-05
- Volume
- 23
- Issue
- 8
- Pages
- 2495-2508
- ISSN
- 2211-1247 (ISSN-L)
- PMC
- PMC5986710
- OpenAlex
- W2803593737
- Cited by
- 105
- References
- 84
- Citations by year
- 2026: 6 · 2025: 10 · 2024: 12 · 2023: 12 · 2022: 12 · 2021: 20 · 2020: 18 · 2019: 11 · 2018: 3
- FWCI
- 10.66
- Type
- journal article
- Language
- en
- Open access
- gold
- doi.org
- Licence
- Locations
- Cell Reports (publishedVersion, cc-by-nc-nd)
- Europe PMC (PubMed Central) (publishedVersion, cc-by-nc-nd)
- PubMed Central (publishedVersion, cc-by-nc-nd)
- PubMed (publishedVersion)
- Kölner Universitäts PublikationsServer (Universität zu Köln) (publishedVersion)
- RERO DOC (Universität Bern) (submittedVersion)
- DOAJ (DOAJ: Directory of Open Access Journals) (submittedVersion, cc-by-sa)
- YUHSpace (Yonsei University Medical Library) (submittedVersion, cc-by-nc-nd)
- Funders
- National Institutes of Health (R01-DK076683)
- Deutsche Forschungsgemeinschaft (KFO 329, Ri 2811/1-1, HU 1016/8-1, CRC 1140, HU 1016/5-1)
- Bundesministerium für Bildung und Forschung (01GM1515C, FKZ 01ZX1409B, STOP-FSGS 01GM1518C)
- American Society of Nephrology
- Else Kröner-Fresenius-Stiftung
- Fritz Thyssen Stiftung (01GM1518A, 10.16.2.026MN)
- Center for Mendelian Genomics, University of Washington (U54HG006504)
- European Research Council
- Topics
- Health Sciences › Medicine › Nephrology › Renal Diseases and Glomerulopathies
- Physical Sciences › Chemistry › Spectroscopy › Advanced Proteomics Techniques and Applications
- Health Sciences › Medicine › Oncology › Renal and related cancers
- Keywords
- podocytes, glomerular disease, kidney disease, multi-omics integration, stable isotope labeling, mitochondrial translation, autophagy, cell type-specific gene expression, zebrafish knockdown, cell culture model
- MeSH terms
- Animals, Base Sequence, Cells, Cultured, Gene Expression Regulation, Humans, Kidney Diseases, Zebrafish, Proteome, Podocytes, Mice, Genetic Association Studies, Transcriptome
About these checks
Registry, retraction, Cites and statistics results are computed, not judged, with one exception: a printed reference that no index lists is read once by a model before it counts as a citation error. Claims are extracted by a model and kept only when their quote appears verbatim in the text; each cited source is then checked, with a model’s help, for whether it says what the claim relies on. Those verdicts can be wrong — read the claim’s quote and the cited source before relying on one.
A language model drew the claims from the paper on 2026-10-07, under version 3 of the claim definition (model deepseek-v4.1-flash, prompt extract-v3).
A second model labelled each claim on 2026-10-07 (model jev-1.13-20260917, definition revision gold-guideline-v0.2).
Statistics and arithmetic are recomputed, not judged.
Confidence bands are shown only for fields calibrated on our annotated test set. None is calibrated yet, so no band is shown.
What counts as a claim ›How we measure confidence ›How we check this ›
Are you an author, or do you see a problem with this page? Request a review
