

The DOI matches its Crossref record; 18 of the 18 references it cites were found in a registry or an index.
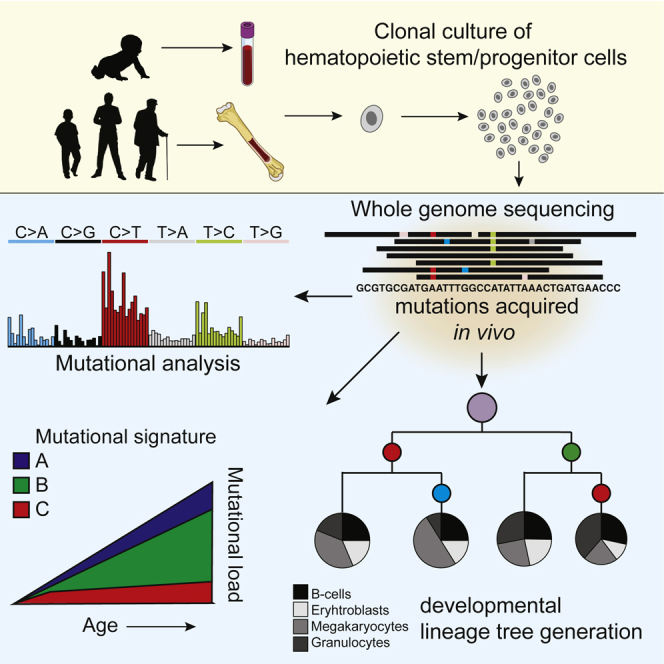
Somatic Mutations Reveal Lineage Relationships and Age-Related Mutagenesis in Human Hematopoiesis
Overview
The claims and statistics of this paper haven’t been checked yet.
Run the check — free, no account needed. It reads the open-access text and checks the sources it cites.
Integrity signals
Registry
Cites
Statistics
Figures
Verification
Claims the paper makes
The claims and statistics of this paper haven’t been checked yet.
Run the check — free, no account needed. It reads the open-access text and checks the sources it cites.
Claims other papers make about this one
Each is checked against this paper’s own text: does it say what the citing paper says it does?
In the citing paper
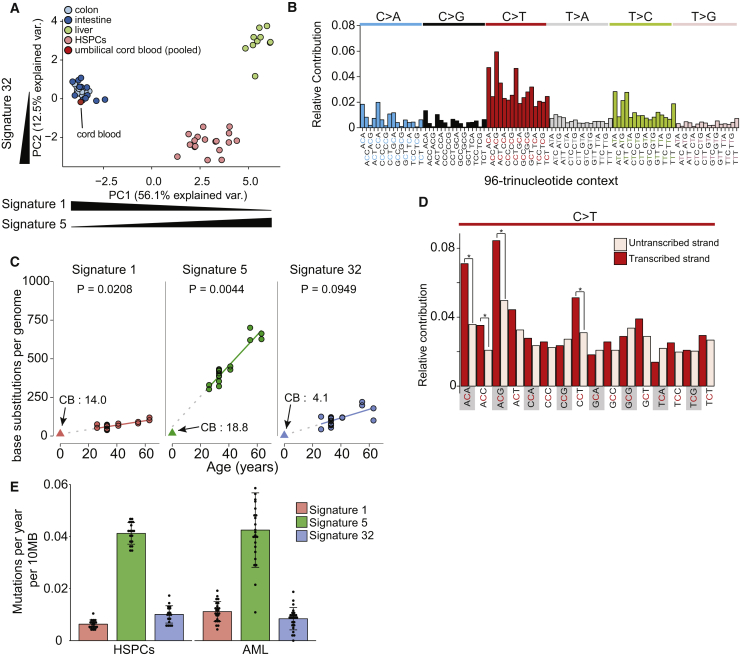
“Mutational signature analysis revealed evidence of the well-described ‘HSPC signature’ (ref. 27), but also several signatures not previously found in hematopoietic cells that accounted for the excess mutation burden in some individuals (Fig. 1b).”
From Clonal selection of hematopoietic stem cells after gene therapy for sickle cell disease (2023) · cites this paper as [27]
In the citing paper
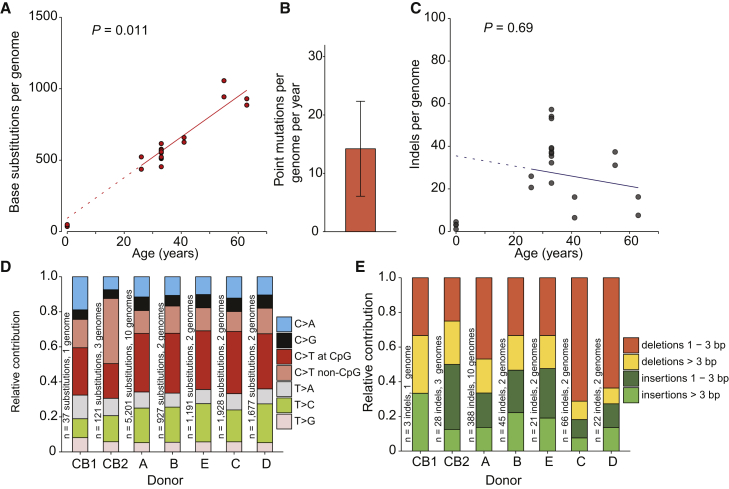
“Somatic mutations accumulate in HSCs linearly over time, with approximately 14−18 SNVs and 0.65–0.77 indels acquired in each HSC per year26–28.”
From Clonal selection of hematopoietic stem cells after gene therapy for sickle cell disease (2023) · cites this paper as [27]
Self-check
Percentages, sums and reported differences re-computed from the paper’s own numbers.
The self-check needs the paper’s full text.
Citations
Cites
Signatures of mutational processes in human cancer
Initiative, A. P. C. G., Alexandrov, L. B., ICGC Breast Cancer Consortium, ICGC MMML-Seq Consortium, PedBrain, I., Nik-Zainal, S., Wedge, D. C., Aparicio, S. A. J. R., Behjati, S., Biankin, A. V., et al. (2013) · Nature · doi:10.1038/nature12477 · Cited by 9,660
Age-related clonal hematopoiesis associated with adverse outcomes
Jaiswal, S., Fontanillas, P., Flannick, J., Manning, A., Grauman, P. V., Mar, B. G., Lindsley, R. C., Mermel, C. H., Burtt, N., Chavez, A., et al. (2014) · New England Journal of Medicine · doi:10.1056/nejmoa1408617 · Cited by 4,841
Clonal hematopoiesis and blood-cancer risk inferred from blood DNA sequence
Genovese, G., Kähler, A. K., Handsaker, R. E., Lindberg, J., Rose, S. A., Bakhoum, S. F., Chambert, K., Mick, E., Neale, B. M., Fromer, M., et al. (2014) · New England Journal of Medicine · doi:10.1056/nejmoa1409405 · Cited by 3,531
Recurring mutations found by sequencing an acute myeloid leukemia genome
Mardis, E. R., Ding, L., Dooling, D. J., Larson, D. E., McLellan, M. D., Chen, K., Koboldt, D. C., Fulton, R. S., Delehaunty, K. D., McGrath, S. D., et al. (2009) · New England Journal of Medicine · doi:10.1056/nejmoa0903840 · Cited by 2,219
Wilson, A., Laurenti, E., Oser, G., van der Wath, R. C., Blanco-Bose, W., Jaworski, M., Offner, S., Dunant, C. F., Eshkind, L., Bockamp, E., et al. (2008) · Cell · doi:10.1016/j.cell.2008.10.048 · Cited by 1,908
A comprehensive catalogue of somatic mutations from a human cancer genome
Pleasance, E. D., Cheetham, R. K., Stephens, P. J., McBride, D. J., Humphray, S. J., Greenman, C. D., Varela, I., Lin, M.-L., Ordóñez, G. R., Bignell, G. R., et al. (2010) · Nature · doi:10.1038/nature08658 · Cited by 1,696
Self-citationThe origin and evolution of mutations in acute myeloid leukemia
Welch, J. S., Ley, T. J., Link, D. C., Miller, C. A., Larson, D. E., Koboldt, D. C., Wartman, L. D., Lamprecht, T. L., Liu, F., Xia, J., et al. (2012) · Cell · doi:10.1016/j.cell.2012.06.023 · Cited by 1,575
Tissue-specific mutation accumulation in human adult stem cells during life
Blokzijl, F., de Ligt, J., Jager, M., Sasselli, V., Roerink, S., Sasaki, N., Huch, M., Boymans, S., Kuijk, E., Prins, P., et al. (2016) · Nature · doi:10.1038/nature19768 · Cited by 935
Distinct routes of lineage development reshape the human blood hierarchy across ontogeny
Notta, F., Zandi, S., Takayama, N., Dobson, S., Gan, O. I., Wilson, G., Kaufmann, K. B., McLeod, J., Laurenti, E., Dunant, C. F., et al. (2016) · Science · doi:10.1126/science.aab2116 · Cited by 780
MutationalPatterns: comprehensive genome-wide analysis of mutational processes
Blokzijl, F., Janssen, R., van Boxtel, R., & Cuppen, E. (2018) · Genome Medicine · doi:10.1186/s13073-018-0539-0 · Cited by 660
Aging and neurodegeneration are associated with increased mutations in single human neurons
Lodato, M. A., Rodin, R. E., Bohrson, C. L., Coulter, M. E., Barton, A. R., Kwon, M., Sherman, M. A., Vitzthum, C. M., Luquette, L. J., Yandava, C. N., et al. (2018) · Science · doi:10.1126/science.aao4426 · Cited by 635
Population dynamics of normal human blood inferred from somatic mutations
Lee-Six, H., Øbro, N. F., Shepherd, M. S., Grossmann, S., Dawson, K., Belmonte, M., Osborne, R. J., Huntly, B. J. P., Martincorena, I., Anderson, E., et al. (2018) · Nature · doi:10.1038/s41586-018-0497-0 · Cited by 604
Clonal analysis of lineage fate in native haematopoiesis
Rodriguez-Fraticelli, A. E., Wolock, S. L., Weinreb, C. S., Panero, R., Patel, S. H., Jankovic, M., Sun, J., Calogero, R. A., Klein, A. M., & Camargo, F. D. (2018) · Nature · doi:10.1038/nature25168 · Cited by 596
Self-citationKarran, P., & Attard, N. (2008) · Nature Reviews Cancer · doi:10.1038/nrc2292 · Cited by 477
Haas, S., Hansson, J., Klimmeck, D., Loeffler, D., Velten, L., Uckelmann, H., Wurzer, S., Prendergast, Á. M., Schnell, A., Hexel, K., et al. (2015) · Cell Stem Cell · doi:10.1016/j.stem.2015.07.007 · Cited by 471 · cited 1×
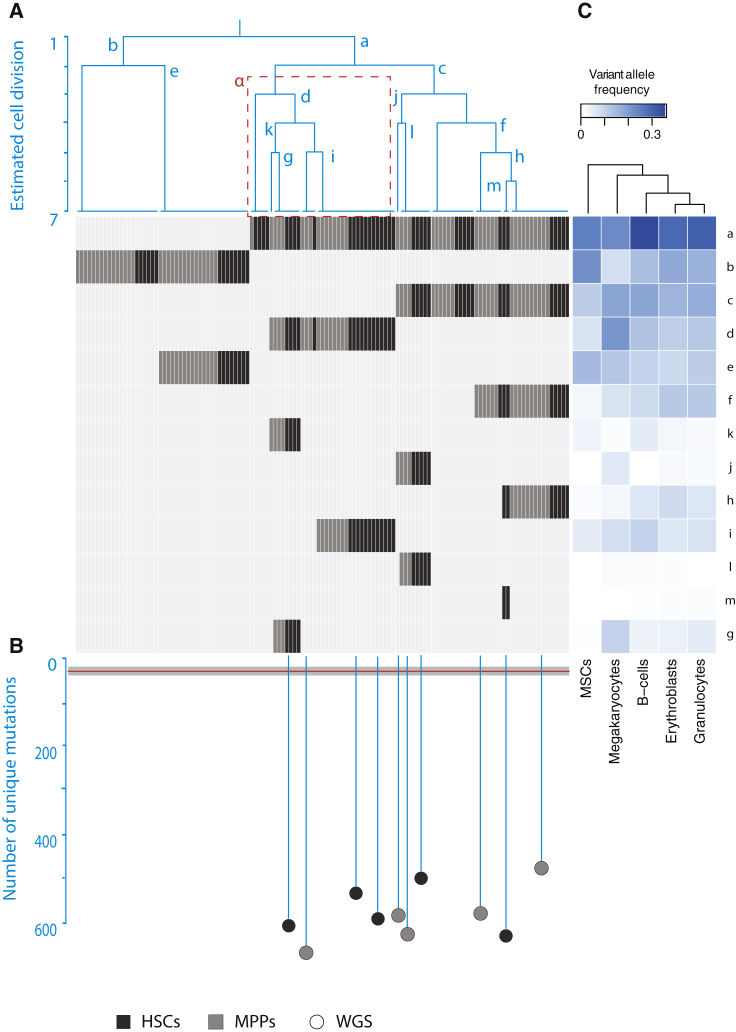
“Of these blood lineages, the megakaryocyte branch splits off more early, suggesting lineage differences between megakaryocytes and the other blood populations (Figure 4C), which is in line with recent observations in mice (Haas et al., 2015; Rodriguez-Fraticelli et al., 2018; Yamamoto et al., 2013).”
ResultPolylox barcoding reveals haematopoietic stem cell fates realized in vivo
Pei, W., Feyerabend, T. B., Rössler, J., Wang, X., Postrach, D., Busch, K., Rode, I., Klapproth, K., Dietlein, N., Quedenau, C., et al. (2017) · Nature · doi:10.1038/nature23653 · Cited by 443
Bowie, M. B., McKnight, K. D., Kent, D. G., McCaffrey, L., Hoodless, P. A., & Eaves, C. J. (2006) · Journal of Clinical Investigation · doi:10.1172/jci28310 · Cited by 380
The replication rate of human hematopoietic stem cells in vivo
Catlin, S. N., Busque, L., Gale, R. E., Guttorp, P., & Abkowitz, J. L. (2011) · Blood · doi:10.1182/blood-2010-08-303537 · Cited by 259
Research works printed but not linked: 23
- Abkowitz, 2002, Evidence that the number of hematopoietic stem cells per animal is conserved in mammals, Blood, 100, 2665, 10.1182/blood-2002-03-0822 · DOI
- Alexandrov, 2013, Deciphering signatures of mutational processes operative in human cancer, Cell Rep., 3, 246, 10.1016/j.celrep.2012.12.008 · DOI
- Alexandrov, 2015, Clock-like mutational processes in human somatic cells, Nat. Genet., 47, 1402, 10.1038/ng.3441 · DOI
- Behjati, 2014, Genome sequencing of normal cells reveals developmental lineages and mutational processes, Nature, 513, 422, 10.1038/nature13448 · DOI · Paper page
- Carrelha, 2018, Hierarchically related lineage-restricted fates of multipotent haematopoietic stem cells, Nature, 554, 106, 10.1038/nature25455 · DOI
- DePristo, 2011, A framework for variation discovery and genotyping using next-generation DNA sequencing data, Nat. Genet., 43, 491, 10.1038/ng.806 · DOI
- Foudi, 2009, Analysis of histone 2B-GFP retention reveals slowly cycling hematopoietic stem cells, Nat. Biotechnol., 27, 84, 10.1038/nbt.1517 · DOI · Paper page
- Hiatt, 2013, Single molecule molecular inversion probes for targeted, high-accuracy detection of low-frequency variation, Genome Res., 23, 843, 10.1101/gr.147686.112 · DOI
- Inman, 2018, The genomic landscape of cutaneous SCC reveals drivers and a novel azathioprine associated mutational signature, Nat. Commun., 9, 3667, 10.1038/s41467-018-06027-1 · DOI
- Jager, 2018, Measuring mutation accumulation in single human adult stem cells by whole-genome sequencing of organoid cultures, Nat. Protoc., 13, 59, 10.1038/nprot.2017.111 · DOI · Paper page
- Ju, 2017, Somatic mutations reveal asymmetric cellular dynamics in the early human embryo, Nature, 543, 714, 10.1038/nature21703 · DOI
- Laurenti, 2015, CDK6 levels regulate quiescence exit in human hematopoietic stem cells, Cell Stem Cell, 16, 302, 10.1016/j.stem.2015.01.017 · DOI · Paper page
- Li, 2010, Fast and accurate long-read alignment with Burrows-Wheeler transform, Bioinformatics, 26, 589, 10.1093/bioinformatics/btp698 · DOI · Paper page
- Li, 2009, The Sequence Alignment/Map format and SAMtools, Bioinformatics, 25, 2078, 10.1093/bioinformatics/btp352 · DOI · Paper page
- Notta, 2011, Isolation of single human hematopoietic stem cells capable of long-term multilineage engraftment, Science, 333, 218, 10.1126/science.1201219 · DOI · Paper page
- Oguro, 2013, SLAM family markers resolve functionally distinct subpopulations of hematopoietic stem cells and multipotent progenitors, Cell Stem Cell, 13, 102, 10.1016/j.stem.2013.05.014 · DOI
- Passegué, 2005, Global analysis of proliferation and cell cycle gene expression in the regulation of hematopoietic stem and progenitor cell fates, J. Exp. Med., 202, 1599, 10.1084/jem.20050967 · DOI · Paper page
- Rossi, 2008, Stems cells and the pathways to aging and cancer, Cell, 132, 681, 10.1016/j.cell.2008.01.036 · DOI · Paper page
- Stratton, 2009, The cancer genome, Nature, 458, 719, 10.1038/nature07943 · DOI
- Xie, 2014, Age-related mutations associated with clonal hematopoietic expansion and malignancies, Nat. Med., 20, 1472, 10.1038/nm.3733 · DOI · Paper page
- Yamamoto, 2013, Clonal analysis unveils self-renewing lineage-restricted progenitors generated directly from hematopoietic stem cells, Cell, 154, 1112, 10.1016/j.cell.2013.08.007 · DOI
- Yu, 2018, Accurate detection of low-level mosaic mutations in pediatric acute lymphoblastic leukemia using single molecule tagging and deep-sequencing, Leuk. Lymphoma, 59, 1690, 10.1080/10428194.2017.1390232 · DOI
- Zink, 2017, Clonal hematopoiesis, with and without candidate driver mutations, is common in the elderly, Blood, 130, 742, 10.1182/blood-2017-02-769869 · DOI · Paper page
Cited by
Mutational signature in colorectal cancer caused by genotoxic pks+ E. coli
Pleguezuelos-Manzano, C., Puschhof, J., Rosendahl Huber, A., van Hoeck, A., Wood, H. M., Nomburg, J., Gurjao, C., Manders, F., Dalmasso, G., Stege, P. B., et al. (2020) · Nature · doi:10.1038/s41586-020-2080-8 · Cited by 1,208
The mutational landscape of normal human endometrial epithelium
Moore, L., Leongamornlert, D., Coorens, T. H. H., Sanders, M. A., Ellis, P., Dentro, S. C., Dawson, K. J., Butler, T., Rahbari, R., Mitchell, T. J., et al. (2020) · Nature · doi:10.1038/s41586-020-2214-z · Cited by 499
The evolutionary dynamics and fitness landscape of clonal hematopoiesis
Watson, C. J., Papula, A. L., Poon, G. Y. P., Wong, W. H., Young, A. L., Druley, T. E., Fisher, D. S., & Blundell, J. R. (2020) · Science · doi:10.1126/science.aay9333 · Cited by 444
The mutational landscape of human somatic and germline cells
Moore, L., Cagan, A., Coorens, T. H. H., Neville, M. D. C., Sanghvi, R., Sanders, M. A., Oliver, T. R. W., Leongamornlert, D., Ellis, P., Noorani, A., et al. (2021) · Nature · doi:10.1038/s41586-021-03822-7 · Cited by 379
The longitudinal dynamics and natural history of clonal haematopoiesis
Fabre, M. A., de Almeida, J. G., Fiorillo, E., Mitchell, E., Damaskou, A., Rak, J., Orrù, V., Marongiu, M., Chapman, M. S., Vijayabaskar, M. S., et al. (2022) · Nature · doi:10.1038/s41586-022-04785-z · Cited by 374
Metadata
- Authors
- Osorio, F. G., Rosendahl Huber, A., Oka, R., Verheul, M., Patel, S. H., Hasaart, K., de la Fonteijne, L., Varela, I., Camargo, F. D., & van Boxtel, R.
- Venue
- Cell Reports
- Publisher
- Elsevier BV
- Published
- 2018-11
- Volume
- 25
- Issue
- 9
- Pages
- 2308-2316.e4
- ISSN
- 2211-1247
- PMC
- PMC6289083
- Cited by
- 252
- References
- 18
- Language
- en
- Licence
- Funders
- EMBO (ALTF 655-2016)
- ERC (ERC2014-STG637904)
- Netherlands Organisation for Scientific Research (016.Vidi.171.023)
- Worldwide Cancer Research (16-0193)
- NIH (HL128850-01A1, P01HL13147)
About these checks
Registry, retraction, Cites and statistics results are computed, not judged, with one exception: a printed reference that no index lists is read once by a model before it counts as a citation error. Claims are extracted by a model and kept only when their quote appears verbatim in the text; each cited source is then checked, with a model’s help, for whether it says what the claim relies on. Those verdicts can be wrong — read the claim’s quote and the cited source before relying on one.
Statistics and arithmetic are recomputed, not judged.
Confidence bands are shown only for fields calibrated on our annotated test set. None is calibrated yet, so no band is shown.
What counts as a claim ›How we measure confidence ›How we check this ›
Are you an author, or do you see a problem with this page? Request a review
