

The DOI matches its Crossref record; 4 of the 4 references it cites were found in a registry or an index.
Dominant constraints on the evolution of rhythmic gene expression
Open accessPublished version of a preprint
Abstract
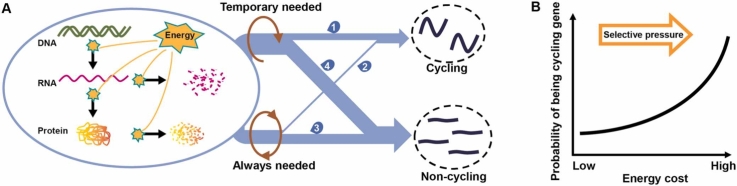
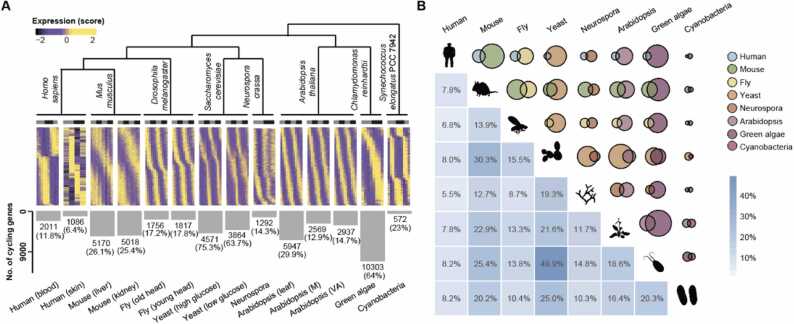
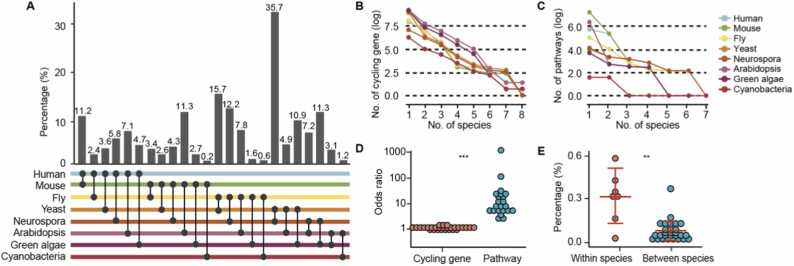
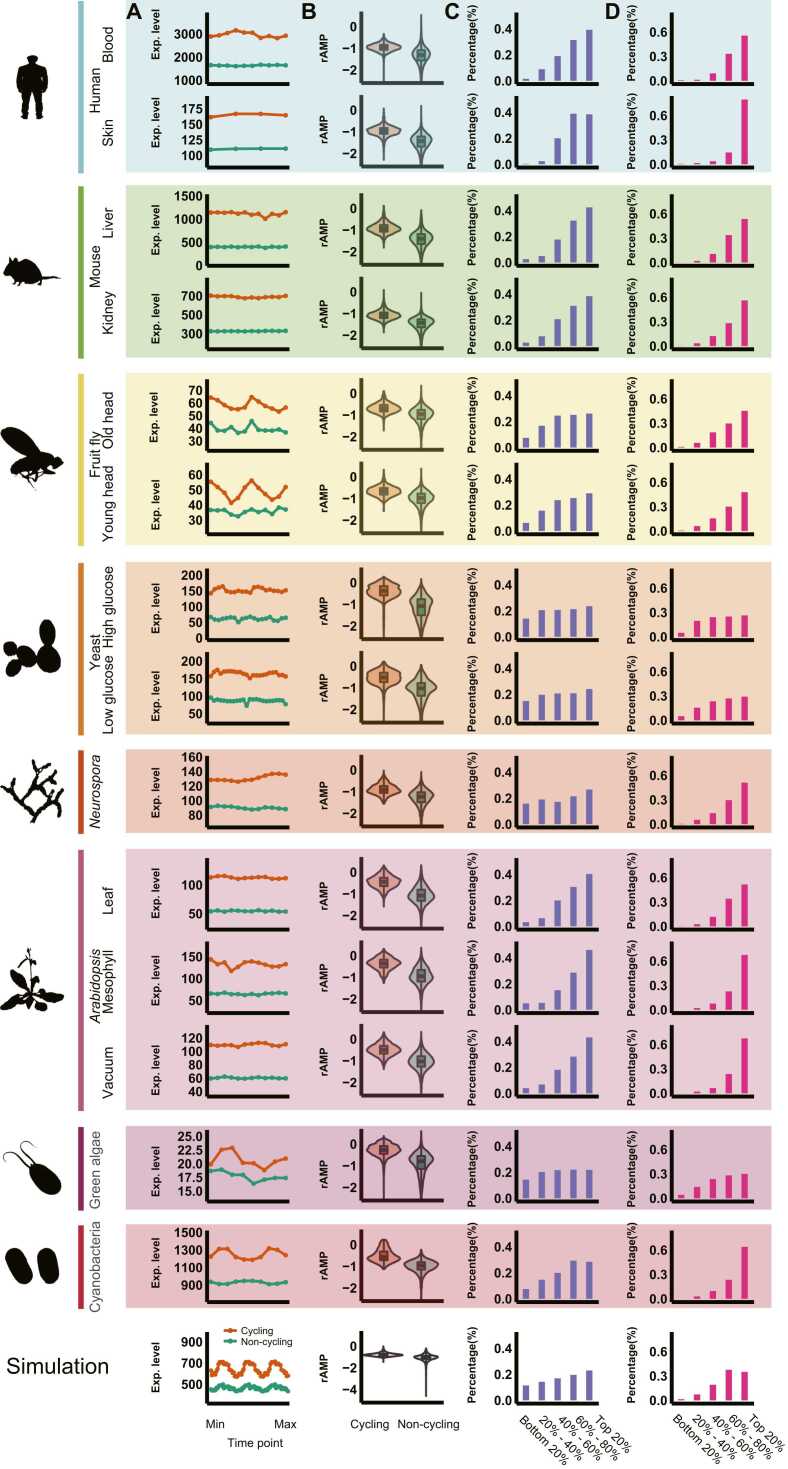
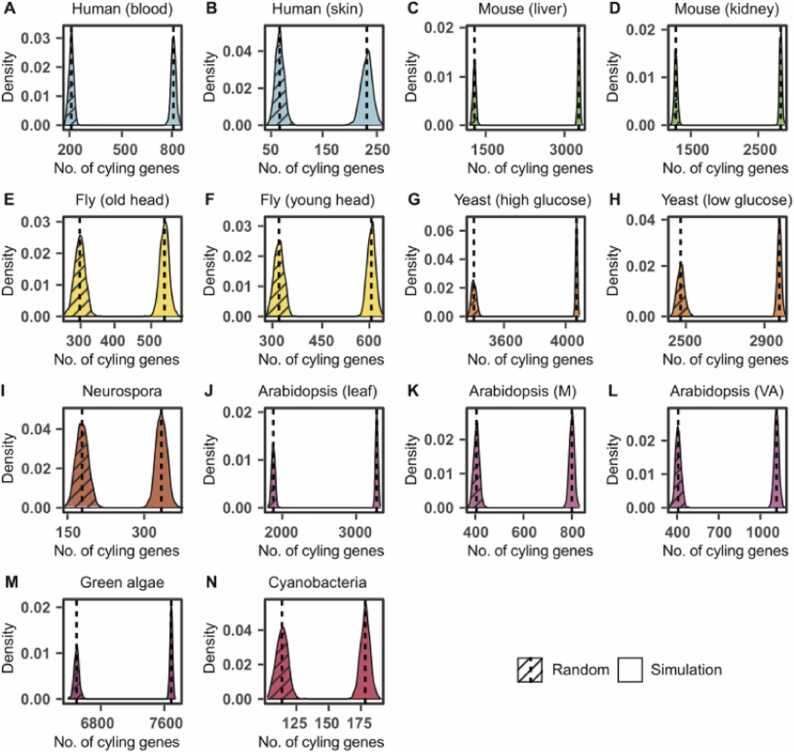
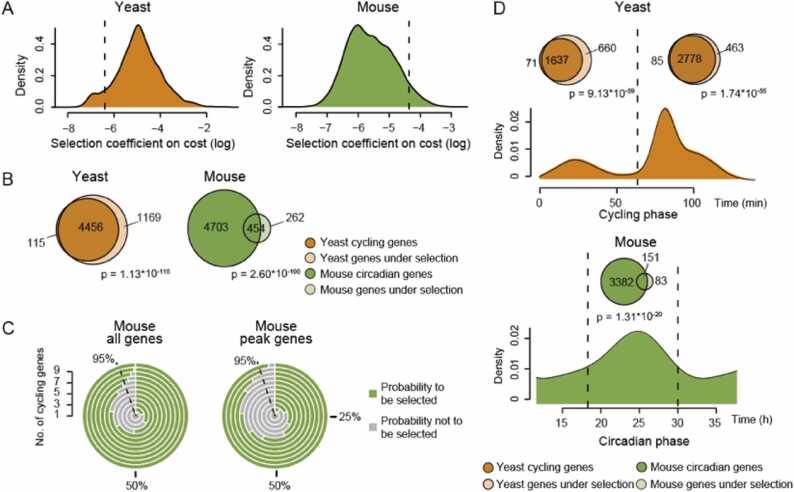
Although the individual transcriptional regulators of the core circadian clock are distinct among different organisms, the autoregulatory feedback loops they form are conserved. This unified design principle explains how daily physiological activities oscillate across species. However, it is unknown whether analogous design principles govern the gene expression output of circadian clocks. In this study, we performed a comparative analysis of rhythmic gene expression in eight diverse species and identified four common distribution patterns of cycling gene expression across these species. We hypothesized that the maintenance of reduced energetic costs constrains the evolution of rhythmic gene expression. Our large-scale computational simulations support this hypothesis by showing that selection against high-energy expenditure completely regenerates all cycling gene patterns. Moreover, we find that the peaks of rhythmic expression have been subjected to this type of selective pressure. The results suggest that selective pressure from circadian regulation efficiently removes unnecessary gene products from the transcriptome, thereby significantly impacting its evolutionary path.
Overview
The claims and statistics of this paper haven’t been checked yet.
Run the check — free, no account needed. It reads the open-access text and checks the sources it cites.
Integrity signals
Registry
Cites
Statistics
Figures
Verification
Claims the paper makes
The claims and statistics of this paper haven’t been checked yet.
Run the check — free, no account needed. It reads the open-access text and checks the sources it cites.
Self-check
Percentages, sums and reported differences re-computed from the paper’s own numbers.
The self-check needs the paper’s full text.
Citations
Cites
OrthoFinder: phylogenetic orthology inference for comparative genomics
Emms, D. M., & Kelly, S. (2019) · Genome Biology · doi:10.1186/s13059-019-1832-y · Cited by 7,676
Global quantification of mammalian gene expression control
Schwanhäusser, B., Busse, D., Li, N., Dittmar, G., Schuchhardt, J., Wolf, J., Chen, W., & Selbach, M. (2011) · Nature · doi:10.1038/nature10098 · Cited by 6,566
Energy Constraints on the Evolution of Gene Expression
Wagner, A. (2005) · Molecular Biology and Evolution · doi:10.1093/molbev/msi126 · Cited by 419
Time-restricted feeding attenuates age-related cardiac decline in Drosophila
Gill, S., Le, H. D., Melkani, G. C., & Panda, S. (2015) · Science · doi:10.1126/science.1256682 · Cited by 272
Research works printed but not linked: 72
- 10.1038/nrg.2016.150 · DOI
- 10.1101/sqb.2015.80.027490 · DOI
- 10.1146/annurev-genet-102209-163432 · DOI
- Poletini M.O., Moraes M.N., Ramos B.C. and Jerônimo R.: Castrucci AMdL. TRP channels: a missing bond in the entrainment mechanism of peripheral clocks throughout evolution. Temperature 2015; 2: 522. · DOI
- 10.1038/nrg1633 · DOI
- 10.1038/35088576 · DOI
- King D.P., Zhao Y., Sangoram A.M., Wilsbacher L.D., Tanaka M., Antoch M.P. et al: Positional cloning of the mouse circadian clock gene. Cell 1997; 89: 641. · DOI · Paper page
- 10.1126/science.1107373 · DOI
- 10.1016/S0092-8674(03)00074-6 · DOI
- 10.1016/S0092-8674(00)81440-3 · DOI
- 10.1126/science.281.5382.1519 · DOI
- 10.1126/science.1102540 · DOI · Paper page
- 10.1126/science.1061320 · DOI
- 10.1016/S0092-8674(00)81464-6 · DOI
- Nagel D.H. and Kay S.A.: Complexity in the wiring and regulation of plant circadian networks. Curr Biol 2012; 22. R648-R57. · DOI
- 10.1196/annals.1417.006 · DOI
- 10.1016/S0092-8674(02)00722-5 · DOI
- 10.1073/pnas.1408886111 · DOI · Paper page
- Mure L.S., Le H.D., Benegiamo G., Chang M.W., Rios L., Jillani N. et al: Diurnal transcriptome atlas of a primate across major neural and peripheral tissues. Science 2018; 359. eaao0318.
- 10.1016/j.cell.2019.05.009 · DOI
- 10.1016/j.cell.2017.07.035 · DOI
- 10.1073/pnas.0909591106 · DOI · Paper page
- Weger B.D., Gobet C., David F.P.A., Atger F., Martin E., Phillips N.E. et al: Systematic analysis of differential rhythmic liver gene expression mediated by the circadian clock and feeding rhythms. Proc Natl Acad Sci USA 2021; 118. · DOI
- 10.1101/gr.128876.111 · DOI
- Möller-Levet C.S., Archer S.N., Bucca G., Laing E.E., Slak A., Kabiljo R. et al: Effects of insufficient sleep on circadian rhythmicity and expression amplitude of the human blood transcriptome. Proc Natl Acad Sci USA 2013; 110: E1132.
- 10.1073/pnas.1809442115 · DOI
- 10.1038/ncomms14529 · DOI
- 10.1073/pnas.1418963111 · DOI
- Panchy N., Wu G., Newton L., Tsai C.H., Chen J., Benning C. et al: Prevalence, evolution, and cis-regulation of diel transcription in Chlamydomonas reinhardtii. G3 2014; 4: 2461. · DOI
- 10.1073/pnas.0902587106 · DOI
- 10.1016/j.celrep.2015.10.043 · DOI
- 10.1038/nature13919 · DOI
- 10.1093/bioinformatics/btw405 · DOI
- 10.1186/s13059-015-0721-2 · DOI · Paper page
- 10.1038/75556 · DOI · Paper page
- The Gene Ontology resource: enriching a GOld mine: Nucleic Acids Res 2021; 49. D325-d34.
- 10.1038/nprot.2013.092 · DOI
- 10.1093/nar/gky1038 · DOI
- Singer J.M., Fu D.Y. and Hughey J.J.: Simphony: simulating large-scale, rhythmic data. PeerJ 2019; 7: e6985. · DOI
- 10.1073/pnas.1514974112 · DOI · Paper page
- Belle A., Tanay A., Bitincka L., Shamir R. and O'Shea E.K.: Quantification of protein half-lives in the budding yeast proteome. Proc Natl Acad Sci USA 2006; 103: 13004. · DOI · Paper page
- 10.1038/msb.2010.112 · DOI
- 10.1101/gr.195404.115 · DOI
- 10.1093/nar/gkaa1103 · DOI · Paper page
- 10.1038/nature02046 · DOI · Paper page
- 10.1126/science.1158441 · DOI · Paper page
- 10.1016/j.mce.2020.111108 · DOI
- Biswas D., Duffley L. and Pulinilkunnil T.: Role of branched-chain amino acid-catabolizing enzymes in intertissue signaling, metabolic remodeling, and energy homeostasis. Faseb J 2019; 33. 8711-31. · DOI
- Lipton J.O., Boyle L.M., Yuan E.D., Hochstrasser K.J., Chifamba F.F., Nathan A. et al: Aberrant Proteostasis of BMAL1 Underlies Circadian Abnormalities in a Paradigmatic mTOR-opathy. Cell Rep 2017; 20. 868-80. · DOI
- Cheng Y., Chi Y., Zhang L. and Wang G.Z.: A single factor dominates the behavior of rhythmic genes in mouse organs. BMC Genom 2019; 20: 879. · DOI
- 10.1038/s41467-018-03898-2 · DOI
- 10.1038/nature11088 · DOI
- Hartl D.L., Clark A.G. and Clark A.G.: Principles of Population Genetics. MA: Sinauer Associates Sunderland 1997.
- Borenstein J. and Arkin R.: Robotic nudges: the ethics of engineering a more socially just human being. Sci Eng Ethics 2016; 22: 31. · DOI
- Wagner A.: Energy costs constrain the evolution of gene expression. J Exp Zool B Mol Dev Evol 2007; 308: 322. · DOI
- Phifer-Rixey M., Bonhomme F., Boursot P., Churchill G.A., Piálek J., Tucker P.K. et al: Adaptive evolution and effective population size in wild house mice. Mol Biol Evol 2012; 29: 2949. · DOI
- 10.1016/j.cell.2017.07.042 · DOI
- 10.1371/journal.pcbi.1007666 · DOI
- Charlesworth B. and Fisher Medawar: Hamilton and the evolution of aging. Genetics 2000; 156: 927. · DOI · Paper page
- 10.1038/35041682 · DOI · Paper page
- 10.1016/j.cell.2017.07.039 · DOI
- 10.1371/journal.pbio.1000062 · DOI
- 10.1126/science.1226339 · DOI · Paper page
- 10.1016/j.cmet.2012.11.004 · DOI
- 10.1074/jbc.RA120.013513 · DOI
- Li H., Zhang S., Zhang W., Chen S., Rabearivony A., Shi Y. et al: Endogenous circadian time genes expressions in the liver of mice under constant darkness. BMC Genom 2020; 21: 224. · DOI
- Brooks T.G., Manjrekar A., Mrcˇela A. and Grant G.R.: Meta-analysis of diurnal transcriptomics in mouse liver reveals low repeatability of rhythm analyses. J Biol Rhythms 2023; . 7487304231179600.
- Laloum D. and Robinson-Rechavi M.: Rhythmicity is linked to expression cost at the protein level but to expression precision at the mRNA level. PLoS Comput Biol 2022; 18. e1010399. · DOI
- 10.1038/ng940 · DOI
- 10.1101/gr.1649303 · DOI
- 10.1101/gr.641103 · DOI
- 10.1016/j.cell.2017.04.015 · DOI
Metadata
- Authors
- Cheng, Y., Chi, Y., Sun, L., & Wang, G.-Z.
- Affiliations
- Shanghai Institute of Nutrition and Health (CN)
- Corresponding author
- Wang, Guang-Zhong
- Venue
- Computational and Structural Biotechnology Journal
- Published
- 2023-01
- Volume
- 21
- Pages
- 4301-4311
- ISSN
- 2001-0370 (ISSN-L)
- PMC
- PMC10492206
- OpenAlex
- W4386385534
- Cited by
- 3
- References
- 4
- Citations by year
- 2025: 3
- FWCI
- 0.45
- Type
- journal article
- Language
- en
- Open access
- gold
- doi.org
- Licence
- Locations
- Computational and Structural Biotechnology Journal (publishedVersion, cc-by-nc-nd)
- bioRxiv (Cold Spring Harbor Laboratory) (acceptedVersion, cc-by-nc-nd)
- PubMed Central (publishedVersion, cc-by-nc-nd)
- PubMed (publishedVersion)
- DOAJ (DOAJ: Directory of Open Access Journals) (submittedVersion, cc-by-sa)
- Funders
- Shanghai Institutes of Nutrition and Health CAS
- Science and Technology Commission of Shanghai Municipality (2017SHZDZX01)
- National Natural Science Foundation of China (31600960, 31871333, 81827901)
- Topics
- Life Sciences › Neuroscience › Endocrine and Autonomic Systems › Circadian rhythm and melatonin
- Life Sciences › Agricultural and Biological Sciences › Plant Science › Plant Molecular Biology Research
- Life Sciences › Biochemistry, Genetics and Molecular Biology › Genetics › Evolution and Genetic Dynamics
- Keywords
- circadian clock, rhythmic gene expression, evolutionary constraints, energetic cost, transcriptional regulation, autoregulatory loop, comparative genomics, selection pressure, transcriptome
About these checks
Registry, retraction, Cites and statistics results are computed, not judged, with one exception: a printed reference that no index lists is read once by a model before it counts as a citation error. Claims are extracted by a model and kept only when their quote appears verbatim in the text; each cited source is then checked, with a model’s help, for whether it says what the claim relies on. Those verdicts can be wrong — read the claim’s quote and the cited source before relying on one.
Statistics and arithmetic are recomputed, not judged.
Confidence bands are shown only for fields calibrated on our annotated test set. None is calibrated yet, so no band is shown.
What counts as a claim ›How we measure confidence ›How we check this ›
Are you an author, or do you see a problem with this page? Request a review
How to cite
Cite CoChat for the checks on this page, and the paper for its own findings.
- This page
- CoChat. (2026). Citation check: Dominant constraints on the evolution of rhythmic gene expression. https://app.cochat.ai/papers/10.1016/j.csbj.2023.08.035
- The paper
- Cheng, Y., Chi, Y., Sun, L., & Wang, G.-Z. (2023). Dominant constraints on the evolution of rhythmic gene expression. Computational and Structural Biotechnology Journal. https://doi.org/10.1016/j.csbj.2023.08.035
