

The DOI matches its Crossref record; 7 of the 7 references it cites were found in a registry or an index.
Translation elongation rate varies among organs and decreases with age
Abstract
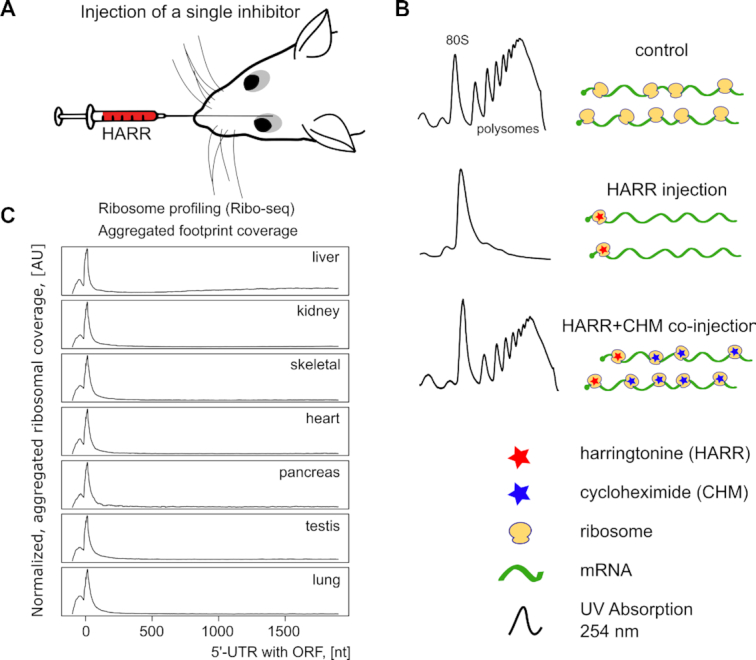
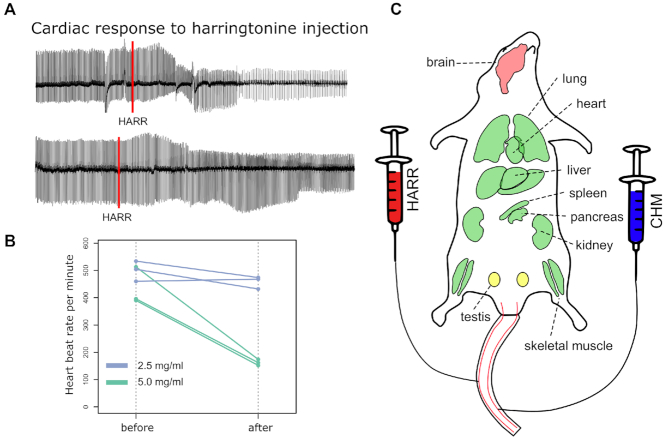
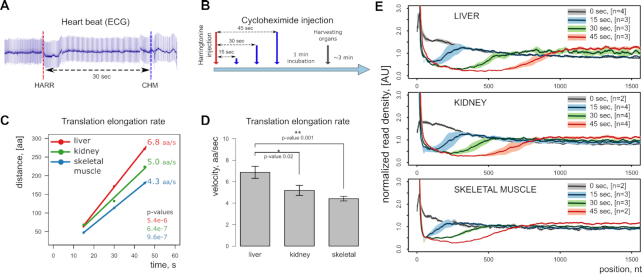
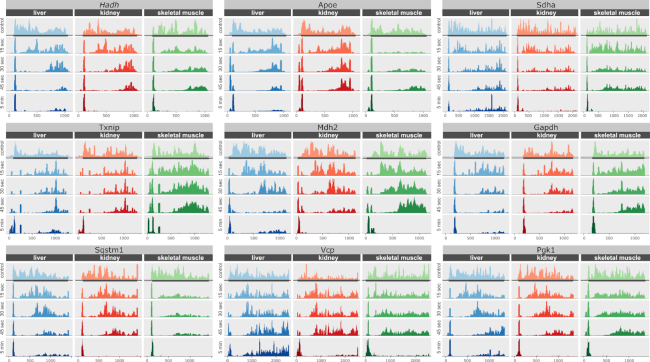
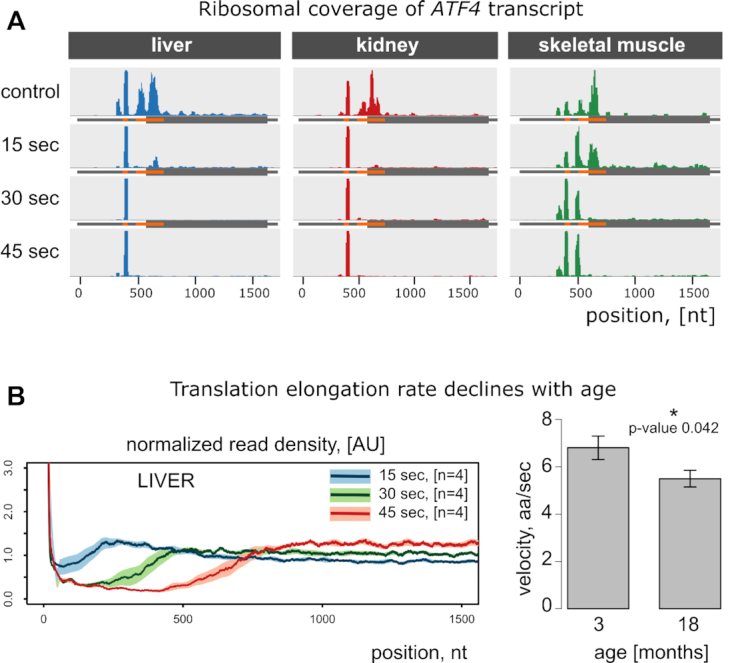
There has been a surge of interest towards targeting protein synthesis to treat diseases and extend lifespan. Despite the progress, few options are available to assess translation in live animals, as their complexity limits the repertoire of experimental tools to monitor and manipulate processes within organs and individual cells. It this study, we developed a labeling-free method for measuring organ- and cell-type-specific translation elongation rates in vivo. It is based on time-resolved delivery of translation initiation and elongation inhibitors in live animals followed by ribosome profiling. It also reports translation initiation sites in an organ-specific manner. Using this method, we found that the elongation rates differ more than 50% among mouse organs and determined them to be 6.8, 5.0 and 4.3 amino acids per second for liver, kidney, and skeletal muscle, respectively. We further found that the elongation rate is reduced by 20% between young adulthood and mid-life. Thus, translation, a major metabolic process in cells, is tightly regulated at the level of elongation of nascent polypeptide chains.
Overview
The claims and statistics of this paper haven’t been checked yet.
Run the check — free, no account needed. It reads the open-access text and checks the sources it cites.
Integrity signals
Registry
Cites
Statistics
Figures
Verification
Claims the paper makes
The claims and statistics of this paper haven’t been checked yet.
Run the check — free, no account needed. It reads the open-access text and checks the sources it cites.
Claims other papers make about this one
Each is checked against this paper’s own text: does it say what the citing paper says it does?
The source backs part of the claim, not all of it — or backs it for a different population, condition or comparison.
In the citing paper
“Another mechanism driving the collapse of the proteostasis network resides in slowed translation elongation and cumulative oxidative damage of proteins, increasingly distracting the chaperones from folding healthy proteins required for cellular fitness 82 .”
From Hallmarks of aging: An expanding universe (2023) · cites this paper as [82]
Experimental — accuracy not yet measured
Self-check
Percentages, sums and reported differences re-computed from the paper’s own numbers.
The self-check needs the paper’s full text.
Citations
Cites
Subramanian, A., Tamayo, P., Mootha, V. K., Mukherjee, S., Ebert, B. L., Gillette, M. A., Paulovich, A., Pomeroy, S. L., Golub, T. R., Lander, E. S., et al. (2005) · Proceedings of the National Academy of Sciences · doi:10.1073/pnas.0506580102 · Cited by 53,625
Genome-Wide Analysis in Vivo of Translation with Nucleotide Resolution Using Ribosome Profiling
Ingolia, N. T., Ghaemmaghami, S., Newman, J. R. S., & Weissman, J. S. (2009) · Science · doi:10.1126/science.1168978 · Cited by 3,853
Ingolia, N. T., Lareau, L. F., & Weissman, J. S. (2011) · Cell · doi:10.1016/j.cell.2011.10.002 · Cited by 2,187
Ribosome Levels Selectively Regulate Translation and Lineage Commitment in Human Hematopoiesis
Khajuria, R. K., Munschauer, M., Ulirsch, J. C., Fiorini, C., Ludwig, L. S., McFarland, S. K., Abdulhay, N. J., Specht, H., Keshishian, H., Mani, D. R., et al. (2018) · Cell · doi:10.1016/j.cell.2018.02.036 · Cited by 416
New frontiers in translational control of the cancer genome
Truitt, M. L., & Ruggero, D. (2016) · Nature Reviews Cancer · doi:10.1038/nrc.2016.27 · Cited by 378
Proteostasis and the Aging Proteome in Health and Disease
Morimoto, R. I., & Cuervo, A. M. (2014) · The Journals of Gerontology Series A: Biological Sciences and Medical Sciences · doi:10.1093/gerona/glu049 · Cited by 277
Translation inhibitors cause abnormalities in ribosome profiling experiments
Gerashchenko, M. V., & Gladyshev, V. N. (2014) · Nucleic Acids Research · doi:10.1093/nar/gku671 · Cited by 262
Self-citation
Research works printed but not linked: 33
- Mills, 2017, Ribosomopathies: There's strength in numbers, Science, 358, eaan2755, 10.1126/science.aan2755 · DOI
- Oliver, 2019, Slowing ribosome velocity restores folding and function of mutant CFTR, J. Clin. Invest., 129, 5236, 10.1172/JCI124282 · DOI
- Morisaki, 2016, Real-time quantification of single RNA translation dynamics in living cells, Science, 352, 1425, 10.1126/science.aaf0899 · DOI
- Yan, 2016, Dynamics of translation of single mRNA molecules in vivo, Cell, 165, 976, 10.1016/j.cell.2016.04.034 · DOI
- Gerashchenko, 2017, Ribonuclease selection for ribosome profiling, Nucleic Acids Res., 45, e6, 10.1093/nar/gkw822 · DOI
- Claydon, 2012, Protein turnover: measurement of proteome dynamics by whole animal metabolic labelling with stable isotope labelled amino acids, Proteomics, 12, 1194, 10.1002/pmic.201100556 · DOI
- Mathews, 1976, Liver protein synthesis. Molecular weight distribution of pulse-labeled polypeptide chains in normal and thyroidectomized rats, Biochim. Biophys. Acta, 425, 220, 10.1016/0005-2787(76)90028-9 · DOI
- Haschemeyer, 1969, Rates of polypeptide chain assembly in liver in vivo: relation to the mechanism of temperature acclimation in Opsanus tau, Proc. Natl. Acad. Sci. U.S.A., 62, 128, 10.1073/pnas.62.1.128 · DOI
- Yardeni, 2011, Retro-orbital injections in mice, Lab Anim. (NY), 40, 155, 10.1038/laban0511-155 · DOI
- Martin, 2011, Cutadapt removes adapter sequences from high-throughput sequencing reads, Embnet, 17
- Kim, 2013, TopHat2: accurate alignment of transcriptomes in the presence of insertions, deletions and gene fusions, Genome Biol., 14, R36, 10.1186/gb-2013-14-4-r36 · DOI · Paper page
- Anders, 2015, HTSeq–a Python framework to work with high-throughput sequencing data, Bioinformatics, 31, 166, 10.1093/bioinformatics/btu638 · DOI · Paper page
- Ritchie, 2015, limma powers differential expression analyses for RNA-sequencing and microarray studies, Nucleic. Acids. Res., 43, e47, 10.1093/nar/gkv007 · DOI · Paper page
- Sakai, 2014, dendsort: modular leaf ordering methods for dendrogram representations in R, F1000Res, 3, 177, 10.12688/f1000research.4784.1 · DOI
- Schneider-Poetsch, 2010, Inhibition of eukaryotic translation elongation by cycloheximide and lactimidomycin, Nat. Chem. Biol., 6, 209, 10.1038/nchembio.304 · DOI
- Fresno, 1977, Inhibition of translation in eukaryotic systems by harringtonine, Eur. J. Biochem., 72, 323, 10.1111/j.1432-1033.1977.tb11256.x · DOI · Paper page
- Palmer, 2005, Inhibition of translation initiation by volatile anesthetics involves nutrient-sensitive GCN-independent and -dependent processes in yeast, Mol. Biol. Cell, 16, 3727, 10.1091/mbc.e05-02-0127 · DOI
- Flaim, 1983, Effect of halothane on synthesis and secretion of liver proteins, Mol. Pharmacol., 24, 277
- Bostrom, 1986, Pulse-chase studies of the synthesis and intracellular transport of apolipoprotein B-100 in Hep G2 cells, J. Biol. Chem., 261, 13800, 10.1016/S0021-9258(18)67090-5 · DOI
- Merry, 1991, Effect of age and restricted feeding on polypeptide chain assembly kinetics in liver protein synthesis in vivo, Mech. Ageing Dev., 58, 139, 10.1016/0047-6374(91)90088-H · DOI
- Braet, 2002, Structural and functional aspects of liver sinusoidal endothelial cell fenestrae: a review, Comp. Hepatol., 1, 1, 10.1186/1476-5926-1-1 · DOI
- Lee, 2012, Global mapping of translation initiation sites in mammalian cells at single-nucleotide resolution, Proc. Natl. Acad. Sci. U.S.A., 109, E2424, 10.1073/pnas.1207846109 · DOI
- Gao, 2015, Quantitative profiling of initiating ribosomes in vivo, Nat. Methods, 12, 147, 10.1038/nmeth.3208 · DOI
- Zhang, 2017, Genome-wide identification and differential analysis of translational initiation, Nat. Commun., 8, 1749, 10.1038/s41467-017-01981-8 · DOI
- Archer, 2016, Dynamics of ribosome scanning and recycling revealed by translation complex profiling, Nature, 535, 570, 10.1038/nature18647 · DOI
- Gorochowski, 2019, Absolute quantification of translational regulation and burden using combined sequencing approaches, Mol. Syst. Biol., 15, e8719, 10.15252/msb.20188719 · DOI
- Ward, 1991, Effect of age on liver protein synthesis and degradation, Hepatology, 14, 935, 10.1002/hep.1840140529 · DOI
- Rattan, 1996, Synthesis, modifications, and turnover of proteins during aging, Exp. Gerontol., 31, 33, 10.1016/0531-5565(95)02022-5 · DOI
- Zou, 2017, A global characterization of the translational and transcriptional programs induced by methionine restriction through ribosome profiling and RNA-seq, BMC Genomics, 18, 189, 10.1186/s12864-017-3483-2 · DOI
- Kaeberlein, 2011, Hot topics in aging research: protein translation and TOR signaling, 2010, Aging Cell, 10, 185, 10.1111/j.1474-9726.2010.00665.x · DOI · Paper page
- Anisimova, 2020, Multifaceted deregulation of gene expression and protein synthesis with age, Proc. Natl. Acad. Sci. U.S.A., 117, 15581, 10.1073/pnas.2001788117 · DOI
- Conn, 2013, Nutrient signaling in protein homeostasis: an increase in quantity at the expense of quality, Sci. Signal, 6, ra24, 10.1126/scisignal.2003520 · DOI
- Armistead, 2014, Diverse diseases from a ubiquitous process: the ribosomopathy paradox, FEBS Lett., 588, 1491, 10.1016/j.febslet.2014.03.024 · DOI
Cited by
Sorted by citations
Hallmarks of aging: An expanding universe
López-Otín, C., Blasco, M. A., Partridge, L., Serrano, M., & Kroemer, G. (2023) · Cell · doi:10.1016/j.cell.2022.11.001 · Cited by 6,549
Resource allocation in mammalian systems
Baghdassarian, H. M., & Lewis, N. E. (2024) · Biotechnology Advances · doi:10.1016/j.biotechadv.2023.108305 · Cited by 17
Metadata
- Authors
- Gerashchenko, M. V., Peterfi, Z., Yim, S. H., & Gladyshev, V. N.
- Affiliations
- Division of Genetics, Department of Medicine, Brigham and Women's Hospital, Harvard Medical School, Boston, MA, USA
- Venue
- Nucleic Acids Research
- Publisher
- Oxford University Press (OUP)
- Published
- 2020-12-02
- Volume
- 49
- Issue
- 2
- Pages
- e9-e9
- ISSN
- 0305-1048
- 1362-4962
- PMC
- PMC7826258
- Cited by
- 98
- References
- 7
- Language
- en
- Funders
- NIH (DK117149, AG065403, AG047200)
About these checks
Registry, retraction, Cites and statistics results are computed, not judged, with one exception: a printed reference that no index lists is read once by a model before it counts as a citation error. Claims are extracted by a model and kept only when their quote appears verbatim in the text; each cited source is then checked, with a model’s help, for whether it says what the claim relies on. Those verdicts can be wrong — read the claim’s quote and the cited source before relying on one.
Statistics and arithmetic are recomputed, not judged.
Confidence bands are shown only for fields calibrated on our annotated test set. None is calibrated yet, so no band is shown.
What counts as a claim ›How we measure confidence ›How we check this ›
Are you an author, or do you see a problem with this page? Request a review
How to cite
Cite CoChat for the checks on this page, and the paper for its own findings.
- This page
- CoChat. (2026). Citation check: Translation elongation rate varies among organs and decreases with age. https://app.cochat.ai/papers/10.1093/nar/gkaa1103
- The paper
- Gerashchenko, M. V., Peterfi, Z., Yim, S. H., & Gladyshev, V. N. (2021). Translation elongation rate varies among organs and decreases with age. Nucleic Acids Research. https://doi.org/10.1093/nar/gkaa1103
