

The DOI matches its Crossref record; 58 of the 59 references it cites were found in a registry or an index.
Psychiatric disorders associated with immune checkpoint inhibitors: a pharmacovigilance analysis of the FDA Adverse Event Reporting System (FAERS) database
Open accessAbstract
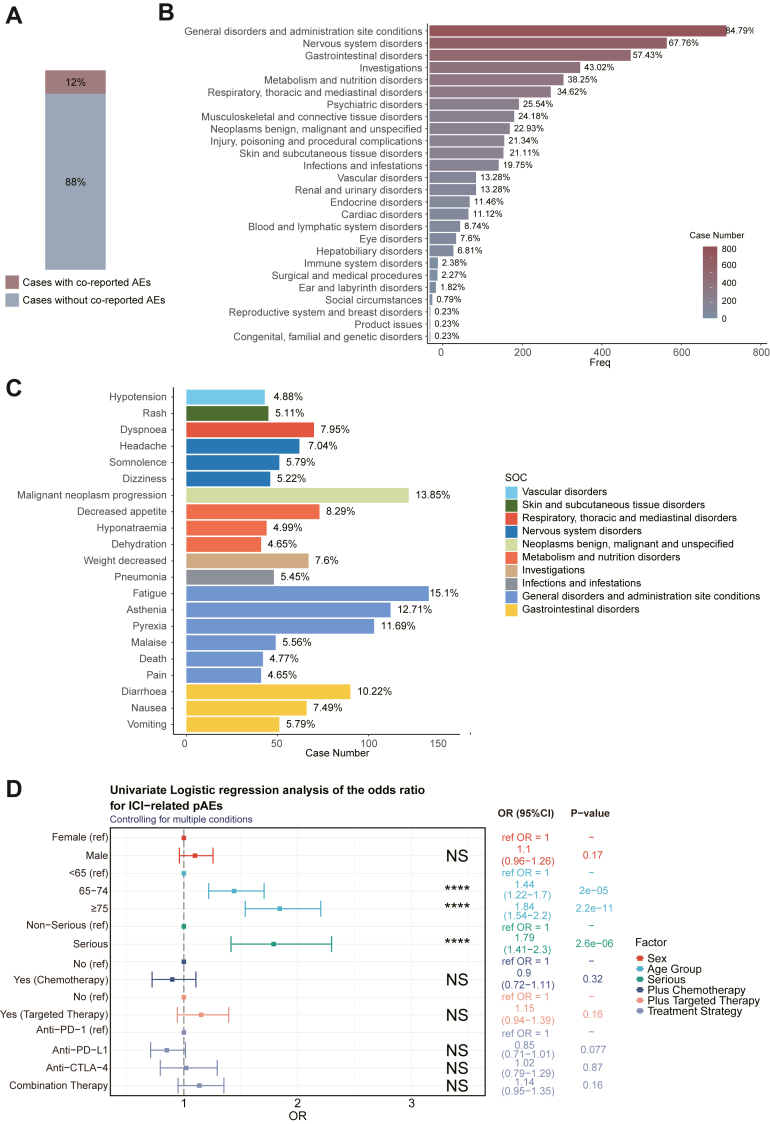
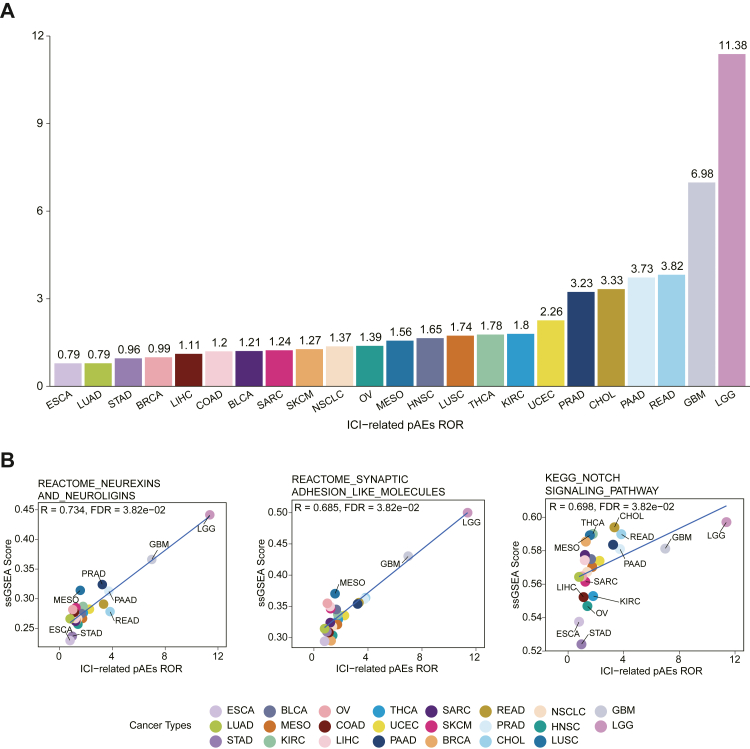
Background With the increasing use of immune checkpoint inhibitors (ICIs) for tumour immunotherapy, the immune-related adverse events (irAEs) caused by their collateral effect on the immune system pose a key challenge for the clinical application of ICIs. Psychiatric adverse events are a class of adverse events associated with ICIs that are realistically observed in the real world. We aim to provide a comprehensive study and summary of psychiatric adverse events associated with ICIs. Methods We obtained ICI adverse reaction reports during January 2012–December 2021 from the FDA Adverse Event Reporting System (FAERS) database. ICI reports underwent screening to minimize the influence of other adverse reactions, concomitant medications, and indications for medication use that may also contribute to psychiatric disorders. Disproportionality analysis was performed to find psychiatric adverse events associated with ICIs by comparing ICIs with the full FAERS database using the reporting odds ratio (ROR). Influencing factors were explored based on univariate logistic regression analysis. Finally, the Cancer Genome Atlas (TCGA) pan-cancer transcriptome data were combined to explore the potential biological mechanisms associated with ICI-related pAEs. Findings Reports of psychiatric adverse events accounted for 2.71% of the overall ICI adverse event reports in the FAERS database. Five categories of psychiatric adverse events were defined as ICI-related psychiatric adverse events (pAEs). The median age of reports with ICI-related pAEs was 70 (interquartile range [IQR] 24–95), with 21.54% of reports having a fatal outcome. Cases with indications for lung cancer, skin cancer and kidney site cancer accounted for the majority. The odds of ICI-related pAEs increased in older patients (65–74: OR = 1.44 [1.22–1.70], P < 0.0001: ≥75: OR = 1.84 [1.54–2.20], P < 0.0001). The occurrence of ICI-related pAEs may be related to NOTCH signalling and dysregulation of synapse-associated pathways. Interpretation This study investigated psychiatric adverse events highly associated with ICI treatment, their influencing factors and potential biological mechanisms, which provides a reliable basis for further in-depth study of ICI-related pAEs. However, as an exploratory study, our findings need to be further confirmed in a large-scale prospective study. Funding This work was supported by the Natural Science Foundation of Guangdong Province (2018A030313846 and 2021A1515012593), the Science and Technology Planning Project of Guangdong Province (2019A030317020) and the National Natural Science Foundation of China (81802257, 81871859, 81772457, 82172750 and 82172811). Guangdong Basic and Applied Basic Research Foundation (Guangdong - Guangzhou Joint Fouds) (2022A1515111212). This work was supported by Key Research and Development Projects of Sichuan Science and Technology (2022YFS0221, 2022YFS0074, 2022YFS0156 and 2022YFS0378). Sichuan Provincial People's Hospital Hospital Young Talent Fund (2021QN08).
Overview
The claims and statistics of this paper haven’t been checked yet.
Run the check — free, no account needed. It reads the open-access text and checks the sources it cites.
Integrity signals
Registry
Cites
Statistics
Figures
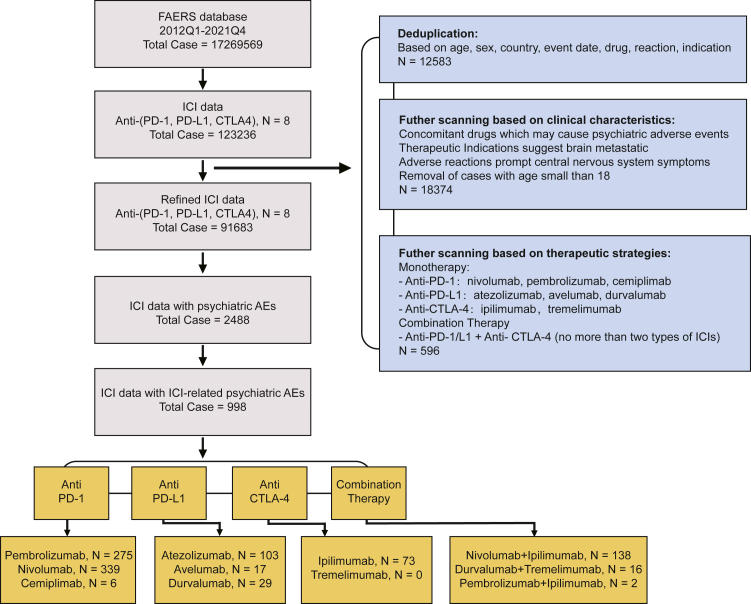
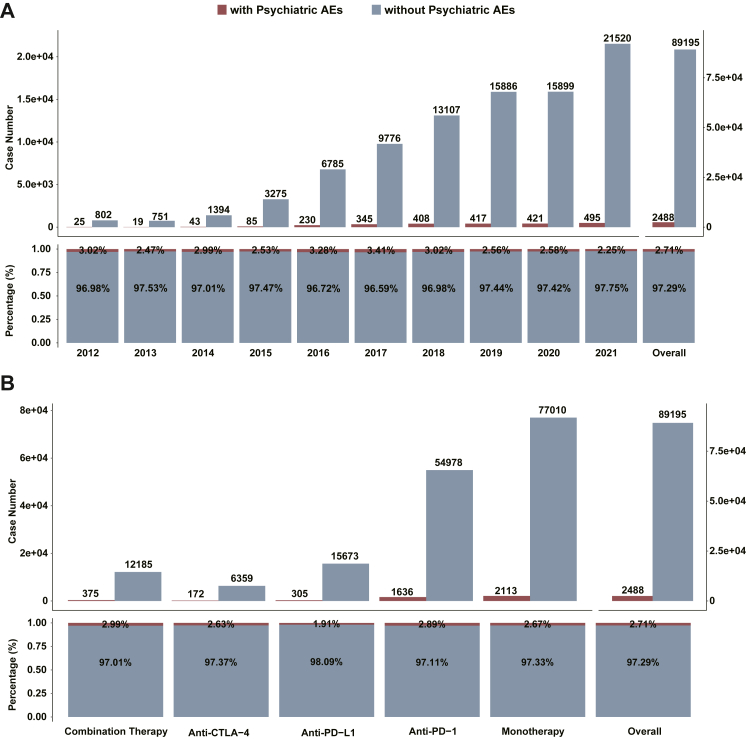
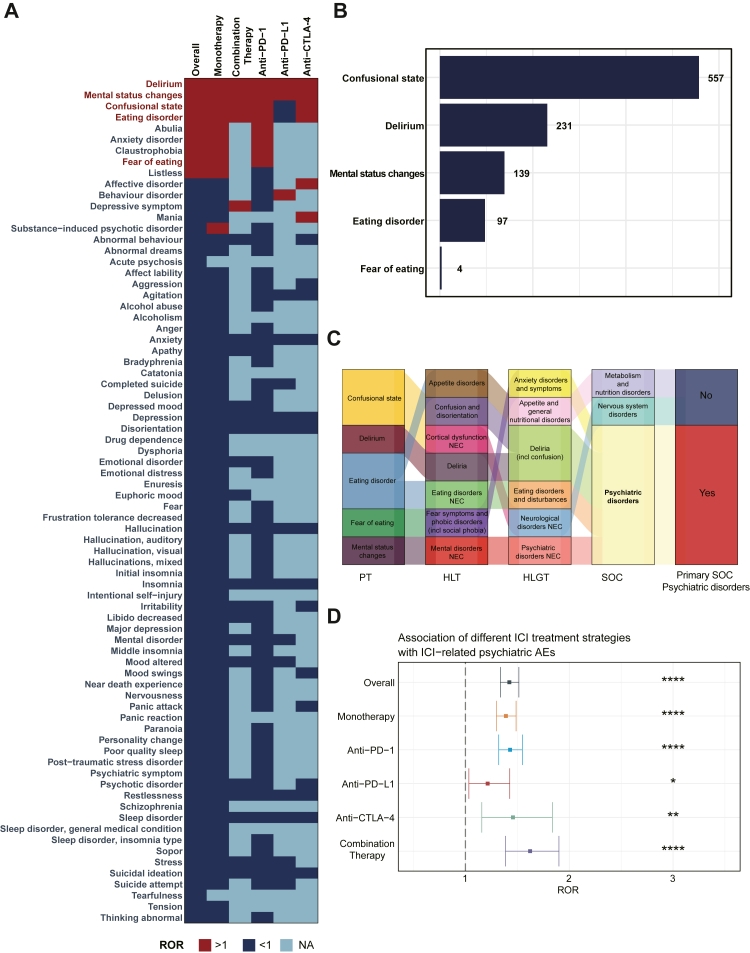
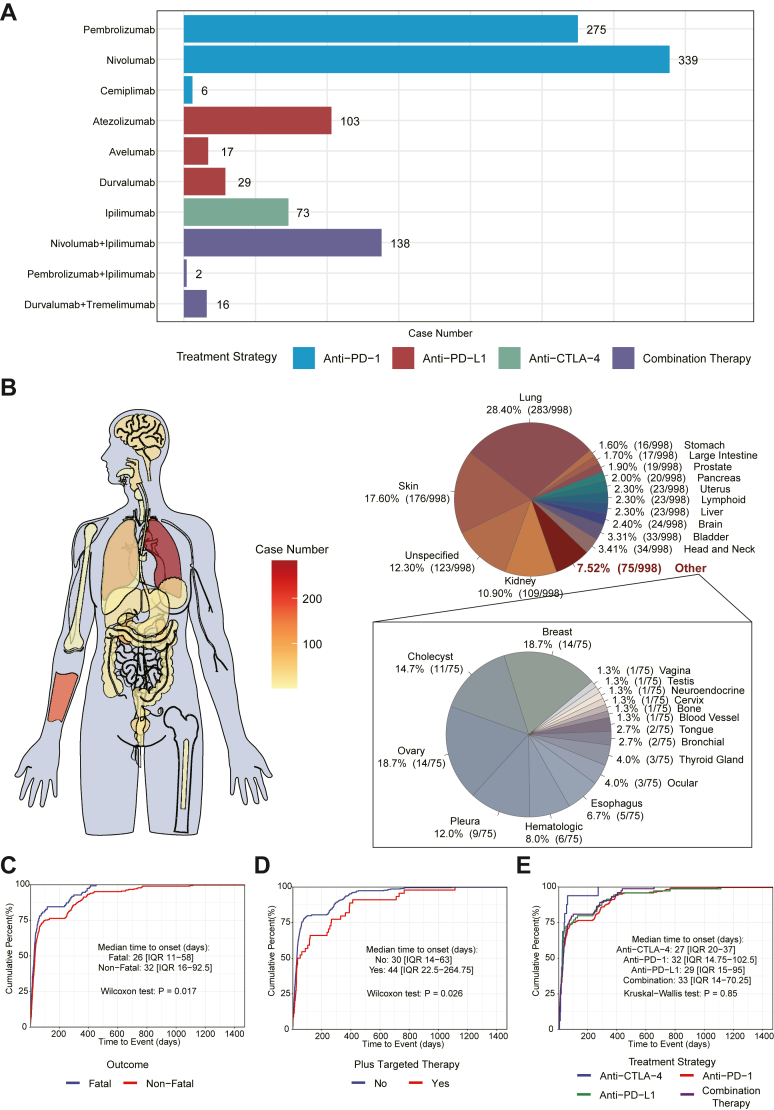
Verification
Claims the paper makes
The claims and statistics of this paper haven’t been checked yet.
Run the check — free, no account needed. It reads the open-access text and checks the sources it cites.
Claims other papers make about this one
Each is checked against this paper’s own text: does it say what the citing paper says it does?
In the citing paper
“AE reporting could also be affected by public awareness of certain drug-AE associations, ethnicity, geography, and timing of approval and introduction to the market [35].”
From The real-world safety profile of tirzepatide: pharmacovigilance analysis of the FDA Adverse Event Reporting System (FAERS) database (2024) · cites this paper as [35]
Self-check
Percentages, sums and reported differences re-computed from the paper’s own numbers.
The self-check needs the paper’s full text.
Citations
Cites
Subramanian, A., Tamayo, P., Mootha, V. K., Mukherjee, S., Ebert, B. L., Gillette, M. A., Paulovich, A., Pomeroy, S. L., Golub, T. R., Lander, E. S., et al. (2005) · Proceedings of the National Academy of Sciences · doi:10.1073/pnas.0506580102 · Cited by 53,625
von Elm, E., Altman, D. G., Egger, M., Pocock, S. J., Gøtzsche, P. C., & Vandenbroucke, J. P. (2007) · The Lancet · doi:10.1016/s0140-6736(07)61602-x · Cited by 21,320
GSVA: gene set variation analysis for microarray and RNA-Seq data
Hänzelmann, S., Castelo, R., & Guinney, J. (2013) · BMC Bioinformatics · doi:10.1186/1471-2105-14-7 · Cited by 15,440
Adverse Renal Effects of Immune Checkpoint Inhibitors: A Narrative Review
Wanchoo, R., Karam, S., Uppal, N. N., Barta, V. S., Deray, G., Devoe, C., Launay‐Vacher, V., Jhaveri, K. D., & on behalf of Cancer and Kidney International Network Workgroup on Immune Checkpoint Inhibitors (2017) · American Journal of Nephrology · doi:10.1159/000455014 · Cited by 15,320
Cancer immunotherapy using checkpoint blockade
Ribas, A., & Wolchok, J. D. (2018) · Science · doi:10.1126/science.aar4060 · Cited by 6,791
Immune-Related Adverse Events Associated with Immune Checkpoint Blockade
Postow, M. A., Sidlow, R., & Hellmann, M. D. (2018) · New England Journal of Medicine · doi:10.1056/nejmra1703481 · Cited by 4,849
Visualizing and interpreting cancer genomics data via the Xena platform
Goldman, M. J., Craft, B., Hastie, M., Repečka, K., McDade, F., Kamath, A., Banerjee, A., Luo, Y., Rogers, D., Brooks, A. N., et al. (2020) · Nature Biotechnology · doi:10.1038/s41587-020-0546-8 · Cited by 4,481
Systematic RNA interference reveals that oncogenic KRAS-driven cancers require TBK1
Barbie, D. A., Tamayo, P., Boehm, J. S., Kim, S. Y., Moody, S. E., Dunn, I. F., Schinzel, A. C., Sandy, P., Meylan, E., Scholl, C., et al. (2009) · Nature · doi:10.1038/nature08460 · Cited by 3,922
Adverse effects of immune-checkpoint inhibitors: epidemiology, management and surveillance
Martins, F., Sofiya, L., Sykiotis, G. P., Lamine, F., Maillard, M., Fraga, M., Shabafrouz, K., Ribi, C., Cairoli, A., Guex-Crosier, Y., et al. (2019) · Nature Reviews Clinical Oncology · doi:10.1038/s41571-019-0218-0 · Cited by 2,314
Bagchi, S., Yuan, R., & Engleman, E. G. (2021) · Annual Review of Pathology: Mechanisms of Disease · doi:10.1146/annurev-pathol-042020-042741 · Cited by 2,189
Cited by
Sorted by citations
Chen, W., Cai, P., Zou, W., & Fu, Z. (2024) · Frontiers in Endocrinology · doi:10.3389/fendo.2024.1330936 · Cited by 84
Shen, J., Hu, R., Lin, A., Jiang, A., Tang, B., Liu, Z., Cheng, Q., Miao, K., Zhang, J., & Luo, P. (2024) · EClinicalMedicine · doi:10.1016/j.eclinm.2024.102684 · Cited by 67
Self-citationChen, C., Zhou, R., Fu, F., & Xiao, J. (2023) · European Psychiatry · doi:10.1192/j.eurpsy.2023.2474 · Cited by 69
Caruso, I., Di Gioia, L., Di Molfetta, S., Caporusso, M., Cignarelli, A., Sorice, G. P., Laviola, L., & Giorgino, F. (2024) · Journal of Endocrinological Investigation · doi:10.1007/s40618-024-02441-z · Cited by 49
Lin, A., Huang, L., Jiang, A., Zhu, L., Mou, W., Li, Y., Zhang, C., Liu, Z., Zhang, J., Cheng, Q., et al. (2025) · BMC Medicine · doi:10.1186/s12916-025-04183-y · Cited by 46
Self-citationEsen, B. H., Bektaş, Ş. N., Topçu, A. U., Köylü, B., Bayram, B., Bahat, G., & Selçukbırıcık, F. (2025) · Age and Ageing · doi:10.1093/ageing/afaf008 · Cited by 41
Zhong, C., Zheng, Q., Zhao, B., & Ren, T. (2024) · Expert Opinion on Drug Safety · doi:10.1080/14740338.2024.2410436 · Cited by 37
A real-world pharmacovigilance study investigating the toxicities of histone deacetylase inhibitors
Li, W., Fu, Y., & Wang, W. (2024) · Annals of Hematology · doi:10.1007/s00277-024-05691-2 · Cited by 35
Yang, J. M., Jung, S. Y., Kim, M. S., Lee, S. W., Yon, D. K., Shin, J. I., & Lee, J. Y. (2024) · Ophthalmology · doi:10.1016/j.ophtha.2024.07.008 · Cited by 37
Large language models in clinical trials: applications, technical advances, and future directions
Lin, A., Wang, Z., Jiang, A., Chen, L., Qi, C., Zhu, L., Mou, W., Gan, W., Zeng, D., Xiao, M., et al. (2025) · BMC Medicine · doi:10.1186/s12916-025-04348-9 · Cited by 39
Self-citationLu, W., Wang, S., Tang, H., Yuan, T., Zuo, W., & Liu, Y. (2025) · European Psychiatry · doi:10.1192/j.eurpsy.2024.1803 · Cited by 40
Xie, W.-L., Ge, M.-L., Chen, D., Chen, G., Mei, Y.-X., & Lai, Y.-J. (2024) · Frontiers in Pharmacology · doi:10.3389/fphar.2024.1435923 · Cited by 30
Wu, S., Chen, X., Yan, D., Wang, Y., Wang, S., Guan, W., Huang, C., Hu, J., & Liu, Z. (2024) · Clinical and Experimental Ophthalmology · doi:10.1111/ceo.14454 · Cited by 29
Self-citationAdverse events in the nervous system associated with blinatumomab: a real-world study
Gao, W., Yu, J., Sun, Y., Song, Z., Liu, X., Han, X., Li, L., Qiu, L., Zhou, S., Qian, Z., et al. (2025) · BMC Medicine · doi:10.1186/s12916-025-03913-6 · Cited by 26
Huang, H., Hu, C., Liu, F., Ji, F., Fu, Y., & Cao, M. (2024) · British Journal of Anaesthesia · doi:10.1016/j.bja.2024.10.013 · Cited by 24
Exploring the dark side of diagnostic dyes with a focus on Indocyanine green’s adverse reactions
Jiao, Y., Liu, Y., & Jin, M. (2024) · Scientific Reports · doi:10.1038/s41598-024-81903-z · Cited by 24
Large Language Models as Tools for Molecular Toxicity Prediction: AI Insights into Cardiotoxicity
Yang, H., Xiu, J., yan, W., Liu, K., Cui, H., Wang, Z., He, Q., Gao, Y., & Han, W. (2025) · Journal of Chemical Information and Modeling · doi:10.1021/acs.jcim.4c01371 · Cited by 27
Hepatic acetyl-CoA metabolism modulates neuroinflammation and depression susceptibility via acetate
Cao, Y., Zhao, Y., Deng, T., Zhou, Q., Hu, G., Hu, Z., Jiang, Y.-Y., Yang, X., Wang, F., Wu, P.-F., et al. (2025) · Cell Metabolism · doi:10.1016/j.cmet.2025.08.010 · Cited by 24
Liu, G., Zhang, S., Mo, Z., Huang, T., Yu, Q., Lu, X., & He, P. F. (2024) · Frontiers in Pharmacology · doi:10.3389/fphar.2024.1407894 · Cited by 24
Tyagi, S., & Kumar, A. (2024) · Critical Reviews in Oncology/Hematology · doi:10.1016/j.critrevonc.2024.104398 · Cited by 21
A Comprehensive Oncological Biomarker Framework Guiding Precision Medicine
Mokhtari, R. B., Sambi, M., Shekari, F., Satari, K., Ghafoury, R., Ashayeri, N., Eversole, P., Baluch, N., Harless, W. W., Muscarella, L. A., et al. (2025) · Biomolecules · doi:10.3390/biom15091304 · Cited by 23
Wu, S., Huang, C., Wang, Y., Li, X., Zhang, S.-Q., Chen, X.-D., Qin, D., Zhu, L., Wen, J.-Y., Luo, N., et al. (2024) · Therapeutic Advances in Drug Safety · doi:10.1177/20420986241285929 · Cited by 19
Self-citationChen, H., Liu, S., Gao, S. H., Shi, H., Yan, Y., Xu, Y., Fang, J., Wang, W., Chen, H., & Liu, Z. (2025) · Scientific Reports · doi:10.1038/s41598-025-01206-9 · Cited by 25
Self-citationA pharmacovigilance study of FDA adverse events for sugammadex
Mao, X., Zhang, R., Liang, X., Liu, F., Dai, Y., Wang, M., Huang, H., & Fu, G. (2024) · Journal of Clinical Anesthesia · doi:10.1016/j.jclinane.2024.111509 · Cited by 19
Liu, R., Chen, Y., Wu, S., Ma, W., Qiu, Z., Wang, J., Xu, X., Chen, C., & Wang, W. (2024) · Therapeutic Advances in Drug Safety · doi:10.1177/20420986241303428 · Cited by 17
Lin, A., Zheng, K., Jiang, A., Huang, X., Wang, Q., Hajdú, A., Li, Z., Zhang, J., & Luo, P. (2025) · Med Research · doi:10.1002/mdr2.70019 · Cited by 19
Self-citationFettiplace, M. R., Weinberg, G. L., Chiang, C., Nixon, H. C., & Gitman, M. (2025) · British Journal of Anaesthesia · doi:10.1016/j.bja.2025.06.044 · Cited by 17
Adverse event profile of albumin-bound paclitaxel: a real-world pharmacovigilance analysis
Duan, Y., Wang, Y., Lu, S., Zeng, M., Liu, L., Dai, Q., & Yin, R. (2024) · Frontiers in Pharmacology · doi:10.3389/fphar.2024.1448144 · Cited by 17
Yang, Y., Li, L., Tian, J., Ma, L., Wu, Y., Luo, Q., & Luo, Y. (2024) · Frontiers in Pharmacology · doi:10.3389/fphar.2024.1453429 · Cited by 17
Yan, Y., An, W., Mei, S., Zhu, Q., Li, C., Yang, L., Zhao, Z., & Huo, J. (2024) · BMC Pharmacology and Toxicology · doi:10.1186/s40360-024-00815-w · Cited by 16
A real-world pharmacovigilance study of FDA adverse event reporting system events for Capmatinib
Qi, Y., Li, J., Lin, S., Wu, S., Chai, K., Jiang, X., Qian, J., & Jiang, C. (2024) · Scientific Reports · doi:10.1038/s41598-024-62356-w · Cited by 15
Yang, Q., Wang, J., Wang, M.-H., Zhang, S., & He, Q. (2024) · BMC Pharmacology and Toxicology · doi:10.1186/s40360-024-00789-9 · Cited by 15
Qian, J., Zhang, S., & Jiang, C. (2024) · BMC Cancer · doi:10.1186/s12885-024-13250-1 · Cited by 15
Liang, X., Xiao, H., Li, H., Chen, X., & Li, Y. (2024) · Frontiers in Immunology · doi:10.3389/fimmu.2024.1396752 · Cited by 14
Yan, D., Bao, S., Zhang, Z., Sun, J., & Zhou, M. (2024) · Nature Computational Science · doi:10.1038/s43588-024-00748-8 · Cited by 16
Liu, L., Wu, S., Wei, L., Xia, Z., Ji, J., & Huang, D. (2025) · Aging Clinical and Experimental Research · doi:10.1007/s40520-024-02921-5 · Cited by 14
Cui, Z., Zhai, Z., Xie, D., Wang, L., Cheng, F., Lou, S., Zou, F., Pan, R., Chang, S., Yao, H., et al. (2024) · Frontiers in Pharmacology · doi:10.3389/fphar.2024.1329409 · Cited by 13
Chen, Z., Wang, X., Teng, Z., Huang, J., Mo, J., Qu, C., Wu, Y., Liu, Z., Liu, F., & Xia, K. (2024) · EBioMedicine · doi:10.1016/j.ebiom.2024.105314 · Cited by 16
Self-citationZhang, J., Wang, X., & Zhou, Y. (2024) · Frontiers in Pharmacology · doi:10.3389/fphar.2024.1471615 · Cited by 13
Self-citationMartín‐Hernández, D., Muñoz‐López, M., Tendilla‐Beltrán, H., Caso, J. R., García‐Bueno, B., Menchen, L. A., & Leza, J. C. (2023) · International Journal of Molecular Sciences · doi:10.3390/ijms241612634 · Cited by 12
Dai, Z., Wang, G., Zhang, J., Zhao, Q., & Jiang, L. (2024) · Heliyon · doi:10.1016/j.heliyon.2024.e33417 · Cited by 12
Self-citationYang, H., Huang, R., Zhang, P., Liu, Y., Liu, Z., He, J., & Peng, X. (2024) · Frontiers in Immunology · doi:10.3389/fimmu.2024.1439231 · Cited by 13
Self-citationSha, Y., Yuan, Q., Qian, Y., Li, X., Niu, M., Du, Y., Liang, X., Sun, S., Lu, Y., & Han, J. (2025) · Therapeutic Advances in Drug Safety · doi:10.1177/20420986251405091 · Cited by 11
Qiao, Y., Chen, Y., Wang, Q., Liu, J., Guo, X., Gu, Q., Ding, P., Zhang, H., & Mei, H. (2024) · Frontiers in Pharmacology · doi:10.3389/fphar.2024.1413944 · Cited by 10
Cheng, X., Lin, J., Wang, B., Huang, S., Liu, M., & Yang, J. (2024) · Scientific Reports · doi:10.1038/s41598-024-72864-4 · Cited by 13
Adverse Event Assessment of Upadacitinib: A Pharmacovigilance Study Based on the FAERS Database
Yuan, J., Lu, H., Zuo, X., Yin, L., Pu, Y., & Zhang, J. (2024) · Pharmacoepidemiology and Drug Safety · doi:10.1002/pds.70030 · Cited by 10
Self-citationZou, T., Li, Z., Wang, T., Deng, S., Wang, S., & Hua, Y. (2024) · BMC Pharmacology and Toxicology · doi:10.1186/s40360-024-00821-y · Cited by 10
The adverse event of interstitial lung disease in patients treated with antibody–drug conjugates
Fang, N., Wang, X., Xu, Q., Zhan, H., Wang, Y., Zhao, B., Huang, H. F., & Lin, M. (2025) · The Oncologist · doi:10.1093/oncolo/oyaf228 · Cited by 10
Xueping, S., Wang, C., Liu, X., Zou, L., & Guo, P. (2025) · Frontiers in Pharmacology · doi:10.3389/fphar.2025.1558868 · Cited by 9
Liu, W., Lin, S., Zhu, X., Yin, L., Liu, Q., Lei, S., & Feng, B.-L. (2024) · Frontiers in Immunology · doi:10.3389/fimmu.2024.1433075 · Cited by 9
Wu, S., Chen, X.-D., Liu, Q.-T., Chen, L., Sun, L., Guan, W., Kang, J., Hu, J., Hu, J., & Liu, Z. (2025) · European Journal of Pharmacology · doi:10.1016/j.ejphar.2025.177820 · Cited by 8
Self-citationChen, W., Xie, J., Gao, C., Zhang, C., Fu, Z., & Chen, S. (2024) · Gynecologic Oncology · doi:10.1016/j.ygyno.2024.01.012 · Cited by 8
Xiao, Z., Cao, J., Wu, S., Zhou, T., Li, C., Duan, J., Yang, Z., & Xu, F. (2024) · CNS Neuroscience & Therapeutics · doi:10.1111/cns.14862 · Cited by 8
Ma, H., Song, D., Zhang, H., Li, T., & Jin, X. Y. (2024) · Cancer Immunology Immunotherapy · doi:10.1007/s00262-024-03854-8 · Cited by 8
Jin, Q., Ren, F., & Song, P. (2023) · Expert Review of Clinical Pharmacology · doi:10.1080/17512433.2023.2292605 · Cited by 7
Mao, Z., Huang, Y., Zhu, X., Zheng, P., Wang, L., Zhang, F., Liu, W., Liu, H., Liao, W., & Zhou, L. (2024) · Expert Opinion on Drug Safety · doi:10.1080/14740338.2024.2416921 · Cited by 6
Bai, Y., Wang, X., Dai, X., Ma, Q., & Hu, H. (2024) · Frontiers in Pharmacology · doi:10.3389/fphar.2024.1398667 · Cited by 6
Lin, Y. N., Li, H., Dong, Y., Fang, W., Huang, H., He, M., Zhou, X., & Sun, N. (2025) · BMC Pharmacology and Toxicology · doi:10.1186/s40360-025-00915-1 · Cited by 6
Yan, X., Li, Z., Jiang, A., Chen, J., Huang, X., Hajdú, A., Wong, H. Z. H., Cheng, Q., Zhang, J., Lin, A., et al. (2025) · International Journal of Surgery · doi:10.1097/js9.0000000000002607 · Cited by 7
Self-citationYan, D., Lyu, B., Yu, J. Z., Bao, S., Zhang, Z., Zhou, M., & Sun, J. (2025) · British Journal of Pharmacology · doi:10.1111/bph.70195 · Cited by 6
Rabbani, S. A., Khurana, A., El‐Tanani, M., Arora, M. K., Sharma, S., Sridhar, S. B., & Dubey, H. (2024) · Expert Opinion on Drug Safety · doi:10.1080/14740338.2024.2416539 · Cited by 6
Mao, W., Jiang, J., Xia, Y., & Zhang, L. (2025) · Scientific Reports · doi:10.1038/s41598-025-86959-z · Cited by 5
Xu, X., Guo, Q., Li, Y., Zhai, C., Mao, Y., Zhang, Y., Zhang, L., & Zhang, Y. (2025) · Journal of Clinical Medicine · doi:10.3390/jcm14061860 · Cited by 5
Ye, J., Huang, J., Shao, L., & Wang, Z. (2025) · Renal Failure · doi:10.1080/0886022x.2025.2569089 · Cited by 5
Hematological toxicity of immune checkpoint inhibitors: a pharmacovigilance study
Tan, A.-J., Lu, J., Li, C. Y., Liu, W., Yan, Y., Wang, C., & Mo, D. (2025) · BMC Cancer · doi:10.1186/s12885-025-15391-3 · Cited by 5
Chen, G., Zhang, L., Zhao, S., Huang, H., & Fu, Z. (2024) · Expert Opinion on Drug Safety · doi:10.1080/14740338.2024.2355335 · Cited by 5
Chen, X., Zhang, B., Huang, Y., Chen, Y., & Yang, Y. (2025) · Expert Opinion on Drug Safety · doi:10.1080/14740338.2025.2465872 · Cited by 5
He, L., Shen, M., Zhang, L., Li, Y., & Li, H. (2025) · BMC Pharmacology and Toxicology · doi:10.1186/s40360-025-00869-4 · Cited by 5
Sayer, M., Agrawal, P., Ng, D. Q., Kagramanov, D., Trudeau, J., Othy, S., Acharya, M. M., & Chan, A. (2025) · Supportive Care in Cancer · doi:10.1007/s00520-025-09560-0 · Cited by 5
Characteristics of Adverse Events and Clinical Risks of Omaveloxolone Based on FAERS Data
Liu, H., Fan, D., Hong, T., Shen, Z., & Yao, K. (2025) · The Cerebellum · doi:10.1007/s12311-025-01873-4 · Cited by 5
Jiang, C., Qian, J., Lu, Y., & Zheng, J. (2025) · BMC Pharmacology and Toxicology · doi:10.1186/s40360-025-00960-w · Cited by 5
Comprehensive safety analysis of adverse events associated with eptinezumab in migraine treatment
Chen, J., Huang, S., Chen, Y., Luo, C., & Li, Y. (2025) · Scientific Reports · doi:10.1038/s41598-025-09490-1 · Cited by 5
Xu, X., Riviere, J. E., Raza, S., Gedara, N. I. M., Ramachandran, R. A., Tell, L. A., Wyckoff, G. J., & Jaberi‐Douraki, M. (2024) · Expert Opinion on Drug Metabolism & Toxicology · doi:10.1080/17425255.2023.2299337 · Cited by 6
Song, Z., Wang, Y., Zhang, D., Wang, T., Liu, N., Gao, L., Wang, L., & Yang, J. (2024) · International Journal of Cancer · doi:10.1002/ijc.35235 · Cited by 5
Liu, Y., Zhao, G., & Feng, R. (2024) · Expert Opinion on Drug Safety · doi:10.1080/14740338.2024.2438755 · Cited by 5
Jiang, T., Li, Y., Zhang, N., Gan, L., Su, H., Xiang, G., Wu, Y., & Liu, Y. (2025) · Therapeutic Advances in Drug Safety · doi:10.1177/20420986241308089 · Cited by 4
Immune Checkpoint Inhibitors and Cognition in Adults with Cancer: A Scoping Review
Hearne, S., McDonnell, M., Lavan, A. H., & Davies, A. N. (2025) · Cancers · doi:10.3390/cancers17060928 · Cited by 4
Zhong, J., Chen, C., Xu, Y., He, Y., Tan, J., & Xiong, D. (2025) · Frontiers in Pharmacology · doi:10.3389/fphar.2025.1639685 · Cited by 4
Association between PCSK9 inhibitors and acute kidney injury: a pharmacovigilance study
Liu, H. (2024) · Frontiers in Pharmacology · doi:10.3389/fphar.2024.1353848 · Cited by 5
Chen, D., Chen, X. M., Chen, S. M., & Wang, Y. D. (2025) · Journal of Pain Research · doi:10.2147/jpr.s519504 · Cited by 4
Xiao, K., Chen, X., Wu, S., Zhang, Y., Chen, R., Wu, H., Qi, Z., Liu, J., Wang, Y., Miao, Y., et al. (2025) · Therapeutic Advances in Drug Safety · doi:10.1177/20420986251371983 · Cited by 4
Zhen, L., Chen, H., Pan, W., Song, J., Yi, H., & Zhou, H. (2025) · Lupus Science & Medicine · doi:10.1136/lupus-2025-001653 · Cited by 4
Hu, R., Shen, J., Luo, P., Zhang, H., & He, Y. (2025) · Clinical Therapeutics · doi:10.1016/j.clinthera.2025.09.001 · Cited by 4
Self-citationWu, S., Huang, C., Chen, X.-D., Liu, Q.-T., Chen, L., Wang, S.-P., Hu, J., & Liu, Z. (2025) · International Journal of Surgery · doi:10.1097/js9.0000000000003603 · Cited by 4
Self-citationChau, H.-T., & Au, N. P. B. (2025) · Pharmacology Research & Perspectives · doi:10.1002/prp2.70206 · Cited by 4
Pisanu, C., Imai, S., Tsuchiya, M., Inoue, M., Ikegami, K., Zammarchi, G., Kizaki, H., & Hori, S. (2025) · European Journal of Clinical Pharmacology · doi:10.1007/s00228-025-03954-z · Cited by 4
Safety of immune checkpoint inhibitors: A systematic review of disproportionality analysis studies
Rathod, M., Kadari, M., Kadavath, A. D., Thomas, C., Anjali Raveendran, K. V., Jagtap, M., & Undela, K. (2026) · European Journal of Clinical Pharmacology · doi:10.1007/s00228-025-03960-1 · Cited by 5
Yang, Q., Ye, F., Li, L., Chu, J., Tian, Y., Cao, J., Gan, S., & Jiang, A. (2024) · Journal of Biomolecular Structure and Dynamics · doi:10.1080/07391102.2023.2300754 · Cited by 4
Self-citationPan, X., Xiao, X., Ding, Y., Shu, Y., Zhang, W., & Huang, L. (2024) · Frontiers in Pharmacology · doi:10.3389/fphar.2024.1431579 · Cited by 4
Xiong, W., Li, Y., Hu, L., He, G., & Huang, J. (2024) · Frontiers in Pharmacology · doi:10.3389/fphar.2024.1458500 · Cited by 4
From bench to bedside: elucidating VEGF(R) inhibitor-related heart failure in cancer treatment
Peng, S., Cai, M., Kuang, H., Lin, A., Ma, Q., Dai, X., Luo, P., Liu, Y., Zhang, G., & Bai, Y. (2025) · Journal of Translational Medicine · doi:10.1186/s12967-025-06133-x · Cited by 4
Self-citationLiu, H., Fan, D., Hong, T., Shen, Z., & Yao, K. (2025) · Epilepsy & Behavior · doi:10.1016/j.yebeh.2025.110581 · Cited by 4
Wang, D., Guo, Q., Chen, X., He, J., & Deng, J. (2025) · Frontiers in Medicine · doi:10.3389/fmed.2025.1665293 · Cited by 4
Postmarketing safety analysis of remimazolam
Ma, W., Zhang, R., Liu, F., Cao, M., & Huang, H. (2025) · European Journal of Anaesthesiology · doi:10.1097/eja.0000000000002217 · Cited by 3
Belmont, A. P., Novotny, S., Mukherjee, E. M., Park, D., Wong, K. H., Martin-Pozo, M. D., Phillips, E. J., & Stone, C. A. (2025) · The Journal of Allergy and Clinical Immunology In Practice · doi:10.1016/j.jaip.2025.07.039 · Cited by 3
Chen, L., Liu, M.-J., Wang, S., Yang, D., Ding, N.-N., & Zhang, J. (2025) · Cardiovascular Toxicology · doi:10.1007/s12012-025-10051-1 · Cited by 3
Self-citationLin, Y., Zheng, X., Li, L., & Chen, M. (2025) · Frontiers in Oncology · doi:10.3389/fonc.2025.1594585 · Cited by 3
Sun, Z., Deng, X., Guo, J., Liu, M., Wang, S., Wang, J., Zheng, J., Niu, K., Shen, W., Ye, Z., et al. (2026) · Proceedings of the National Academy of Sciences · doi:10.1073/pnas.2427234123 · Cited by 3
Khurana, A., Dubey, H., & Arora, M. K. (2024) · Current Drug Safety · doi:10.2174/0115748863273507231116112824 · Cited by 3
Yuan, Y., He, W., Tong, L., Liu, M., Tang, W., Yang, W., & Pan, X. (2025) · Expert Opinion on Drug Safety · doi:10.1080/14740338.2025.2527406 · Cited by 3
Metadata
- Authors
- Zhou, C., Peng, S., Lin, A., Jiang, A., Peng, Y., Gu, T., Liu, Z., Cheng, Q., Zhang, J., & Luo, P.
- Affiliations
- Zhujiang Hospital (CN)
- University of Electronic Science and Technology of China (CN)
- Second Military Medical University (CN)
- First Affiliated Hospital of Zhengzhou University (CN)
- Central South University (CN)
- Corresponding author
- Cheng, Quan
- Zhang, Jian
- Luo, Peng
- ORCID
- Venue
- eClinicalMedicine
- Publisher
- Elsevier BV
- Published
- 2023-05
- Volume
- 59
- Pages
- 101967
- ISSN
- 2589-5370 (ISSN-L)
- PMC
- PMC10149185
- OpenAlex
- W4366712080
- Cited by
- 213
- References
- 59
- Citations by year
- 2026: 51 · 2025: 94 · 2024: 62 · 2023: 6
- FWCI
- 25.87
- Type
- journal article
- Language
- en
- Open access
- gold
- doi.org
- Licence
- Locations
- EClinicalMedicine (publishedVersion, cc-by-nc-nd)
- PubMed Central (publishedVersion, cc-by-nc-nd)
- PubMed (publishedVersion)
- DOAJ (DOAJ: Directory of Open Access Journals) (submittedVersion, cc-by-sa)
- Funders
- National Natural Science Foundation of China (81772457, 81802257, 81871859, 82172750, 82172811)
- Natural Science Foundation of Guangdong Province (2018A030313846, 2021A1515012593)
- Science and Technology Planning Project of Guangdong Province (2019A030317020)
- Basic and Applied Basic Research Foundation of Guangdong Province
- Topics
- Health Sciences › Medicine › Oncology › Cancer Immunotherapy and Biomarkers
- Life Sciences › Pharmacology, Toxicology and Pharmaceutics › Toxicology › Pharmacovigilance and Adverse Drug Reactions
- Life Sciences › Immunology and Microbiology › Immunology › Immunotherapy and Immune Responses
- Keywords
- immune checkpoint inhibitors, immune-related adverse events, psychiatric adverse events, immune-related encephalitis, immune-related dermatitis, immune-related colitis, immune-related endocrinopathy, immune-related pneumonitis, immune-related hypophysitis, immune-related hepatitis, immune-related nephritis
About these checks
Registry, retraction, Cites and statistics results are computed, not judged, with one exception: a printed reference that no index lists is read once by a model before it counts as a citation error. Claims are extracted by a model and kept only when their quote appears verbatim in the text; each cited source is then checked, with a model’s help, for whether it says what the claim relies on. Those verdicts can be wrong — read the claim’s quote and the cited source before relying on one.
Statistics and arithmetic are recomputed, not judged.
Confidence bands are shown only for fields calibrated on our annotated test set. None is calibrated yet, so no band is shown.
What counts as a claim ›How we measure confidence ›How we check this ›
Are you an author, or do you see a problem with this page? Request a review
