

The DOI matches its Crossref record; 2 of the 2 references it cites were found in a registry or an index.
Stochastic earned value analysis using Monte Carlo simulation and statistical learning techniques
Open accessOverview
The claims and statistics of this paper haven’t been checked yet.
Run the check — free, no account needed. It reads the open-access text and checks the sources it cites.
Integrity signals
Registry
Cites
Statistics
Figures
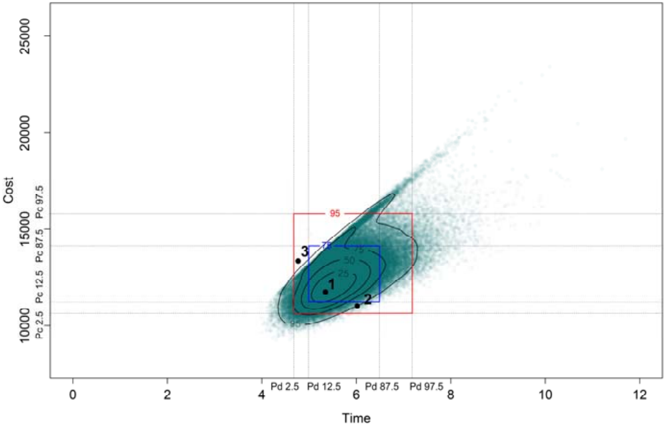
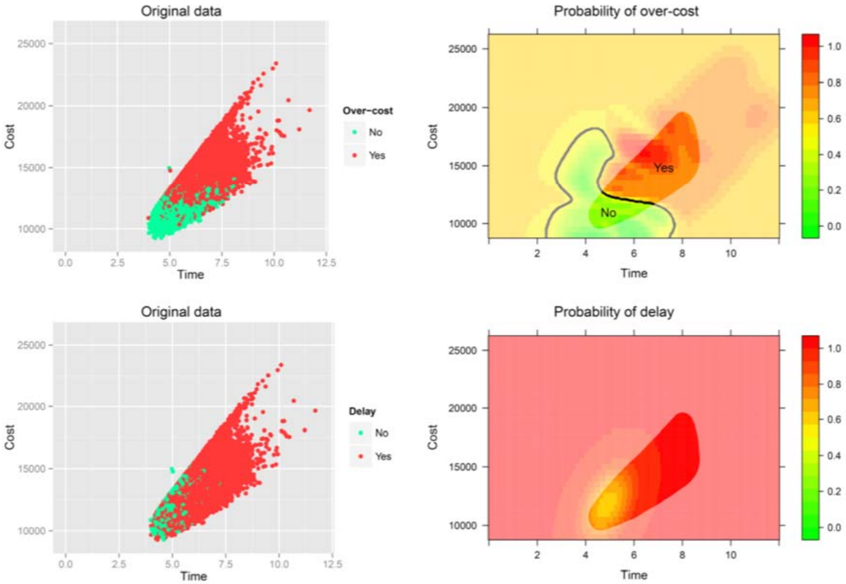
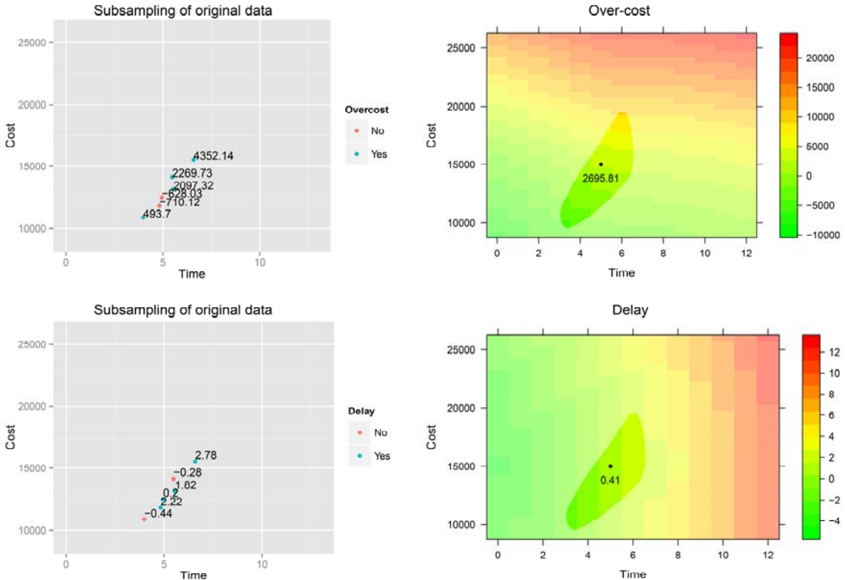
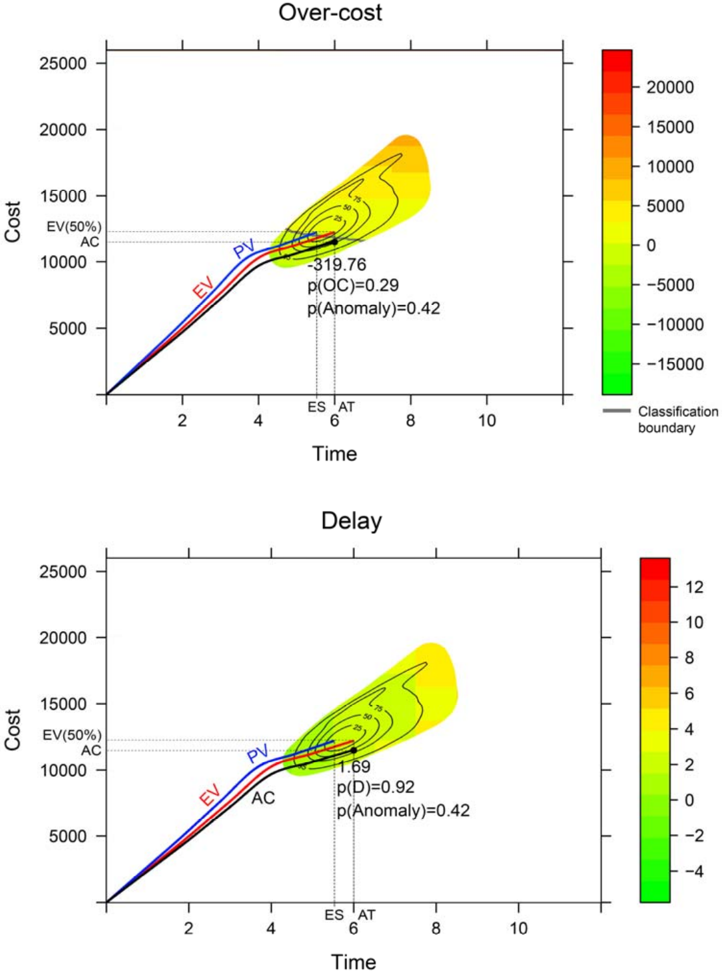
Verification
Claims the paper makes
The claims and statistics of this paper haven’t been checked yet.
Run the check — free, no account needed. It reads the open-access text and checks the sources it cites.
Claims other papers make about this one
Each is checked against this paper’s own text: does it say what the citing paper says it does?
The source backs part of the claim, not all of it — or backs it for a different population, condition or comparison.
In the citing paper
“This aleatoric risk uncertainty can be modelled using a probability distribution function (PDF), exactly as we do when modelling activity uncertainty (Acebes et al. 2015(Acebes et al. , 2014)).”
From Beyond probability-impact matrices in project risk management: A quantitative methodology for risk prioritisation (2024) · cites this paper as Acebes et al. 2015
Experimental — accuracy not yet measured
Self-check
Percentages, sums and reported differences re-computed from the paper’s own numbers.
The self-check needs the paper’s full text.
Citations
Cites
Bias in error estimation when using cross-validation for model selection
Varma, S., & Simon, R. (2006) · BMC Bioinformatics · doi:10.1186/1471-2105-7-91 · Cited by 2,485 · cited 2×
“Although cross ‐ validation can be used for model selection and model assessment, recent studies (Anderssen et al., 2006, Varma and Simon, 2006) warn about an optimistic bias in error estimation when the error obtained during model selection is reported as an estimation of the model performance.”
MethodPimentel, M. A. F., Clifton, D. A., Clifton, L., & Tarassenko, L. (2014) · Signal Processing · doi:10.1016/j.sigpro.2013.12.026 · Cited by 1,649
Research works printed but not linked: 31
- Acebes, 2014, A new approach for project control under uncertainty. Going back to the basics, Int. J. Proj. Manag., 32, 423, 10.1016/j.ijproman.2013.08.003 · DOI · Paper page
- Anbari, 2003, Earned value project management method and extensions, Proj. Manag. J., 34, 12, 10.1177/875697280303400403 · DOI
- Anderssen, 2006, Reducing over-optimism in variable selection by cross-model validation, Chemom. Intell. Lab. Syst., 84, 69, 10.1016/j.chemolab.2006.04.021 · DOI
- Blanco, 2013, Earned value management: a predictive analysis tool, Navy Supply Corps Newsl., 66, 24
- Bradley, 1997, The use of the area under the ROC curve in the evaluation of machine learning algorithms, Pattern Recogn., 30, 1145, 10.1016/S0031-3203(96)00142-2 · DOI · Paper page
- Breiman, 1996, Bagging predictors, Mach. Learn., 24, 123, 10.1007/BF00058655 · DOI · Paper page
- Breiman, 2001, Random Forests, Mach. Learn., 45, 5, 10.1023/A:1010933404324 · DOI · Paper page
- Cioffi, 2006, Designing project management: a scientific notation and an improved formalism for earned value calculations, Int. J. Proj. Manag., 24, 136, 10.1016/j.ijproman.2005.07.003 · DOI
- Colin, 2014, Setting tolerance limits for statistical project control using earned value management, Omega, 49, 107, 10.1016/j.omega.2014.06.001 · DOI
- Criminisi, 2011, Decision Forests: a unified framework for classification, regression, density estimation, manifold learning and semi-supervised learning, Found. Trends Comput. Graph. Comput. Vis., 7, 81, 10.1561/0600000035 · DOI · Paper page
- Ding, 2014, An experimental evaluation of novelty detection methods, Neurocomputing, 135, 313, 10.1016/j.neucom.2013.12.002 · DOI
- Duong, 2007, ks: kernel density estimation and kernel discriminant analysis for multivariate data in R, J. Stat. Softw., 21, 1, 10.18637/jss.v021.i07 · DOI
- Duong, 2005, Cross-validation bandwidth matrices for multivariate kernel density estimation, Scand. J. Stat., 32, 485, 10.1111/j.1467-9469.2005.00445.x · DOI
- Hazir, 2015, A review of analytical models, approaches and decision support tools in project monitoring and control, Int. J. Proj. Manag., 33, 808, 10.1016/j.ijproman.2014.09.005 · DOI
- Hodge, 2004, A survey of outlier detection methodologies, Artif. Intell. Rev., 22, 85, 10.1023/B:AIRE.0000045502.10941.a9 · DOI · Paper page
- Kim, 2003, A model for effective implementation of earned value management methodology, Int. J. Proj. Manag., 21, 375, 10.1016/S0263-7863(02)00049-2 · DOI
- Lambrechts, 2008, Proactive and reactive strategies for resource-constrained project scheduling with uncertain resource availabilities, J. Sched., 11, 121, 10.1007/s10951-007-0021-0 · DOI
- Lipke, 1999, Applying management reserve to software project management, J. Def. Softw. Eng., 17
- Lipke, 2004, The probability of success, J. Qual. Assur. Inst., 14
- Lipke, 2009, Prediction of project outcome: the application of statistical methods to earned value management and earned schedule performance indexes, Int. J. Proj. Manag., 27, 400, 10.1016/j.ijproman.2008.02.009 · DOI
- Markou, 2003, Novelty detection: a review—part 1: statistical approaches, Signal Process., 83, 2481, 10.1016/j.sigpro.2003.07.018 · DOI
- Markou, 2003, Novelty detection: a review—part 2: neural network based approaches, Signal Process., 83, 2499, 10.1016/j.sigpro.2003.07.019 · DOI
- McKim, 2000, Project performance control in reconstruction projects, J. Constr. Eng. Manag., 126, 137, 10.1061/(ASCE)0733-9364(2000)126:2(137) · DOI
- Moslemi Naeni, 2011, Evaluating fuzzy earned value indices and estimates by applying alpha cuts, Expert Syst. Appl., 38, 8193, 10.1016/j.eswa.2010.12.165 · DOI
- Naeni, 2011, A fuzzy approach for the earned value management, Int. J. Proj. Manag., 29, 764, 10.1016/j.ijproman.2010.07.012 · DOI
- Narbaev, 2014, An earned schedule-based regression model to improve cost estimate at completion, Int. J. Proj. Manag., 32, 1007, 10.1016/j.ijproman.2013.12.005 · DOI
- Pajares, 2011, An extension of the EVM analysis for project monitoring: the Cost Control Index and the Schedule Control Index, Int. J. Proj. Manag., 29, 615, 10.1016/j.ijproman.2010.04.005 · DOI
- Plaza, 2009, A model-based DSS for integrating the impact of learning in project control, Decis. Support. Syst., 47, 488, 10.1016/j.dss.2009.04.010 · DOI
- Stone, 1974, Cross-validatory choice and assessment of statistical predictions, J. R. Stat. Soc. Ser. B, 36, 111, 10.1111/j.2517-6161.1974.tb00994.x · DOI · Paper page
- Tseng, 2011, Statistical analysis for comparison of overall performance of projects using Weibull analysis on earned value metrics, J. Chin. Inst. Ind. Eng., 28, 165
- Wauters, 2014, Support Vector Machine regression for project control forecasting, Autom. Constr., 47, 92, 10.1016/j.autcon.2014.07.014 · DOI
Cited by
Sorted by citations
Acebes, F., González-Varona, J. M., López-Paredes, A., & Pajares, J. (2024) · Humanities and Social Sciences Communications · doi:10.1057/s41599-024-03180-5 · Cited by 74
Self-citation
Metadata
- Authors
- Acebes, F., Pereda, M., Poza, D., Pajares, J., & Galán, J. M.
- Affiliations
- Universidad de Valladolid (ES)
- Universidad de Burgos (ES)
- Corresponding author
- Acebes, Fernando
- Venue
- International Journal of Project Management
- Publisher
- Elsevier BV
- Published
- 2015-10
- Volume
- 33
- Issue
- 7
- Pages
- 1597-1609
- ISSN
- 0263-7863 (ISSN-L)
- OpenAlex
- W958645160
- Cited by
- 120
- References
- 2
- Citations by year
- 2026: 15 · 2025: 16 · 2024: 14 · 2023: 10 · 2022: 10 · 2021: 12 · 2020: 13 · 2019: 8 · 2018: 9 · 2017: 6 · 2016: 5 · 2015: 2
- FWCI
- 8.22
- Type
- journal article
- Language
- en
- Open access
- green
- arxiv.org
- Licence
- cc-by-nc-nd
- www.elsevier.com/tdm/userlicense/1.0/ (tdm)
- Locations
- International Journal of Project Management (publishedVersion)
- Hispana (publishedVersion)
- RePEc: Research Papers in Economics (submittedVersion)
- arXiv (Cornell University) (submittedVersion, cc-by-nc-nd)
- LA Referencia (Red Federada de Repositorios Institucionales de Publicaciones Científicas) (submittedVersion, other-oa)
- RWTH Publications (RWTH Aachen) (submittedVersion)
- Repositorio Institucional de la Universidad de Burgos (University of Burgos) (submittedVersion, other-oa)
- UVaDOC UVaDOC University of Valladolid Documentary Repository (University of Valladolid) (submittedVersion, other-oa)
- University of Valladolid Documentary Repository (University of Valladolid) (submittedVersion)
- arXiv (Cornell University)
- Funders
- Regional Government of Castile and Leon (Spain) (VA056A12-2)
- Spanish Ministerio de Ciencia e Innovación (CSD2010-00034)
- Topics
- Social Sciences › Decision Sciences › Management Science and Operations Research › Construction Project Management and Performance
- Social Sciences › Economics, Econometrics and Finance › Finance › Capital Investment and Risk Analysis
- Social Sciences › Decision Sciences › Management Science and Operations Research › Resource-Constrained Project Scheduling
- Keywords
- earned value management, Monte Carlo simulation, anomaly detection, statistical learning, project risk analysis, classification and regression
About these checks
Registry, retraction, Cites and statistics results are computed, not judged, with one exception: a printed reference that no index lists is read once by a model before it counts as a citation error. Claims are extracted by a model and kept only when their quote appears verbatim in the text; each cited source is then checked, with a model’s help, for whether it says what the claim relies on. Those verdicts can be wrong — read the claim’s quote and the cited source before relying on one.
Statistics and arithmetic are recomputed, not judged.
Confidence bands are shown only for fields calibrated on our annotated test set. None is calibrated yet, so no band is shown.
What counts as a claim ›How we measure confidence ›How we check this ›
Are you an author, or do you see a problem with this page? Request a review
