

The DOI matches its Crossref record; 54 of the 54 references it cites were found in a registry or an index.
Intracellular Interleukin-1 Receptor 2 Binding Prevents Cleavage and Activity of Interleukin-1α, Controlling Necrosis-Induced Sterile Inflammation
Open accessAbstract
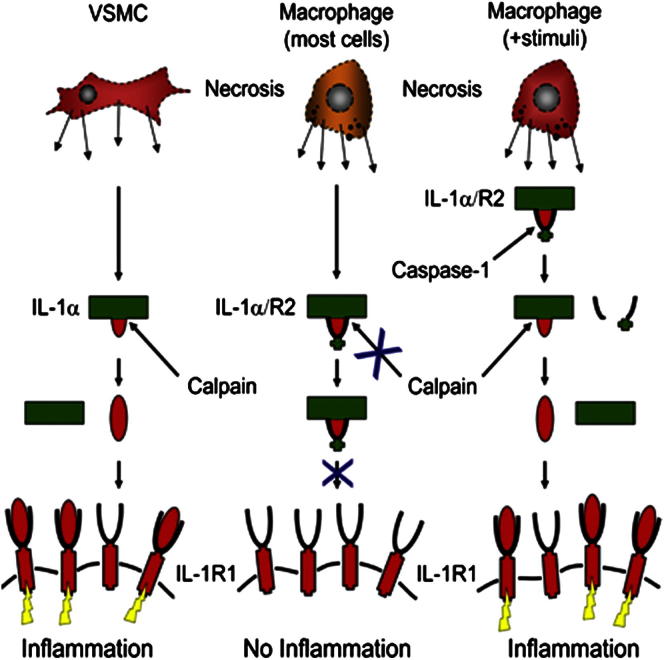
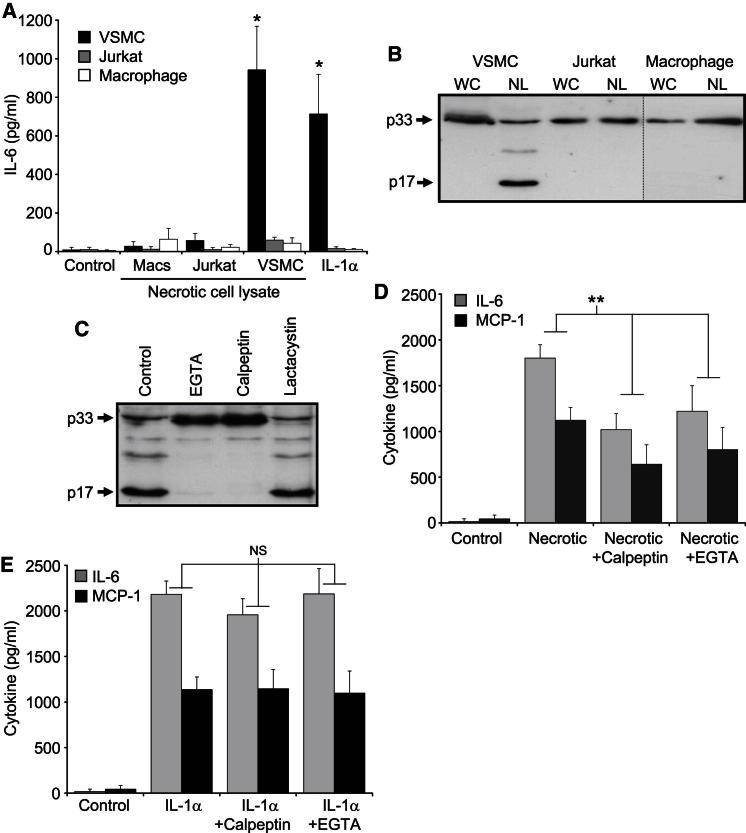
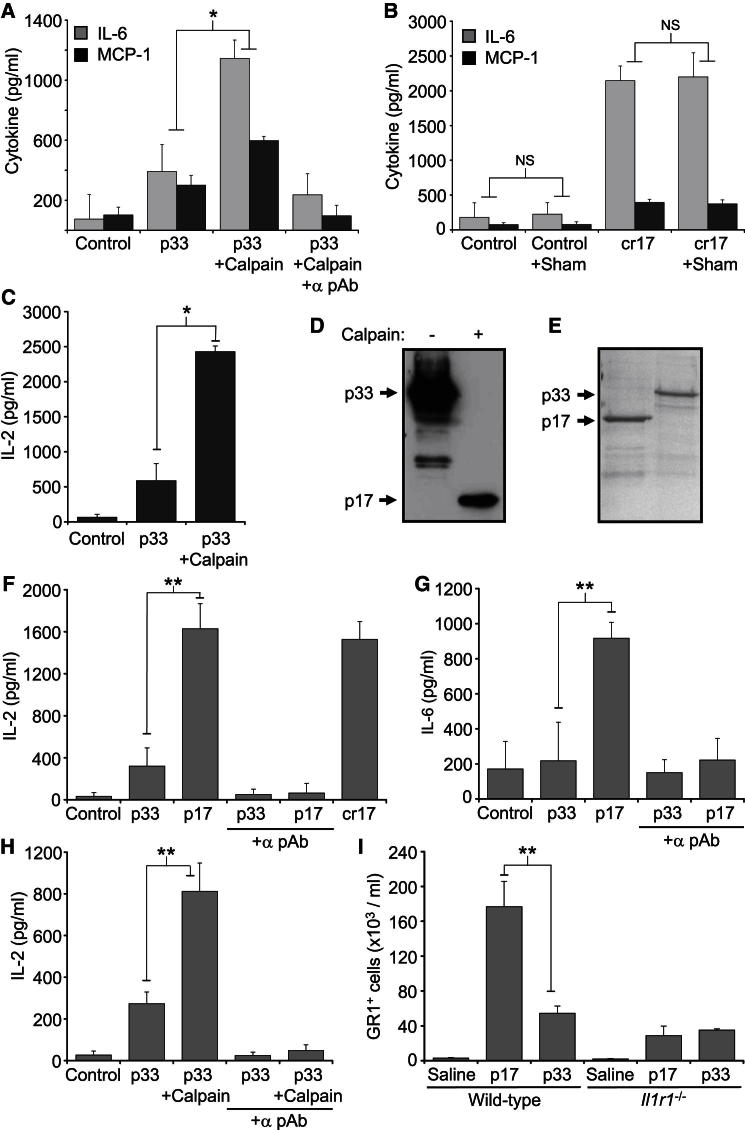
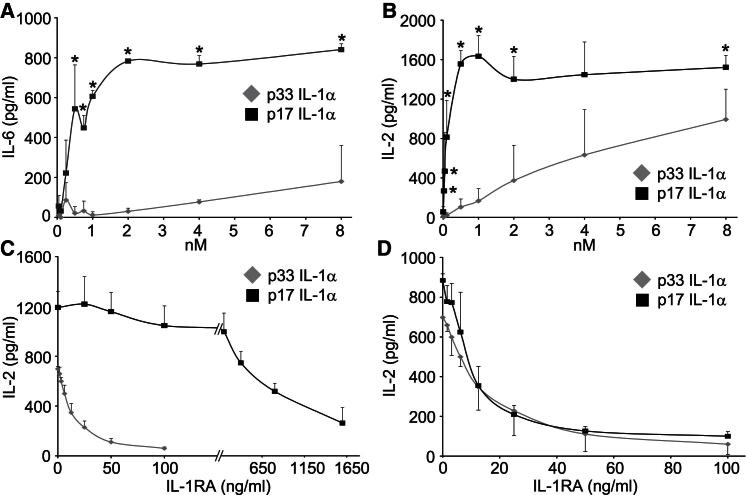
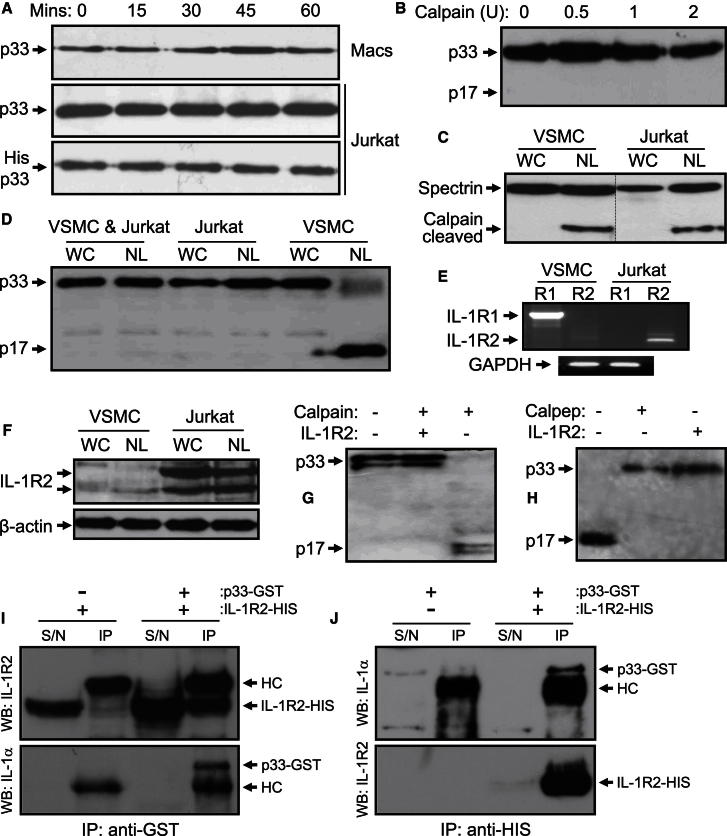
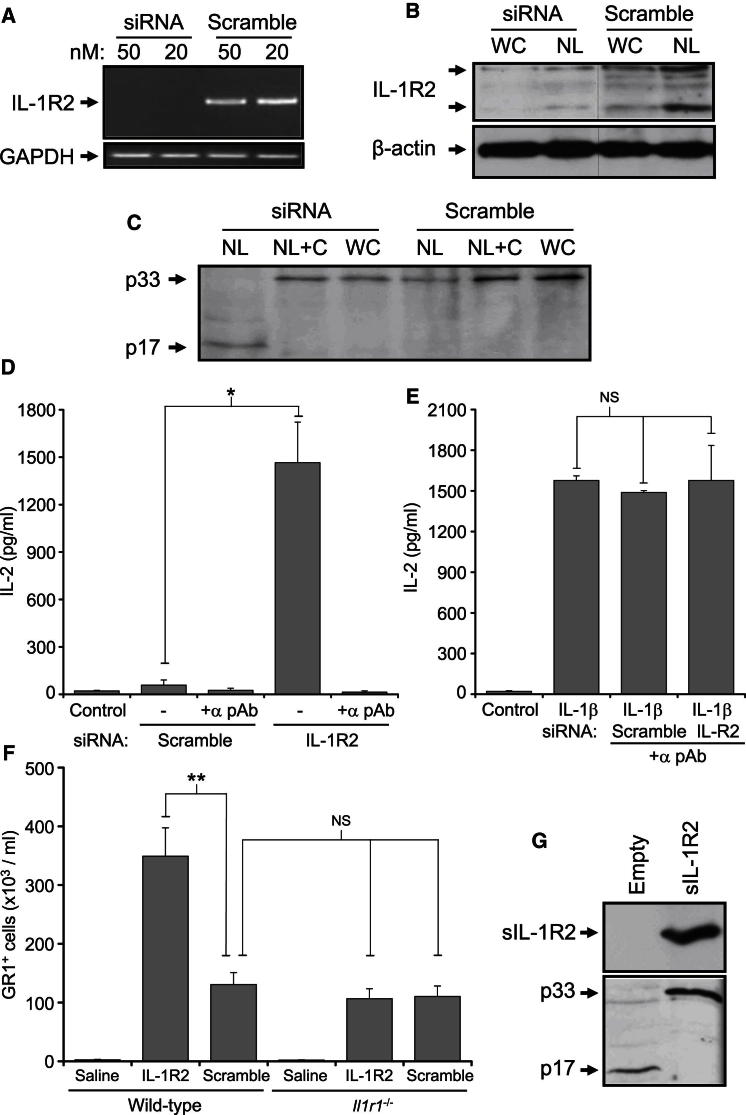
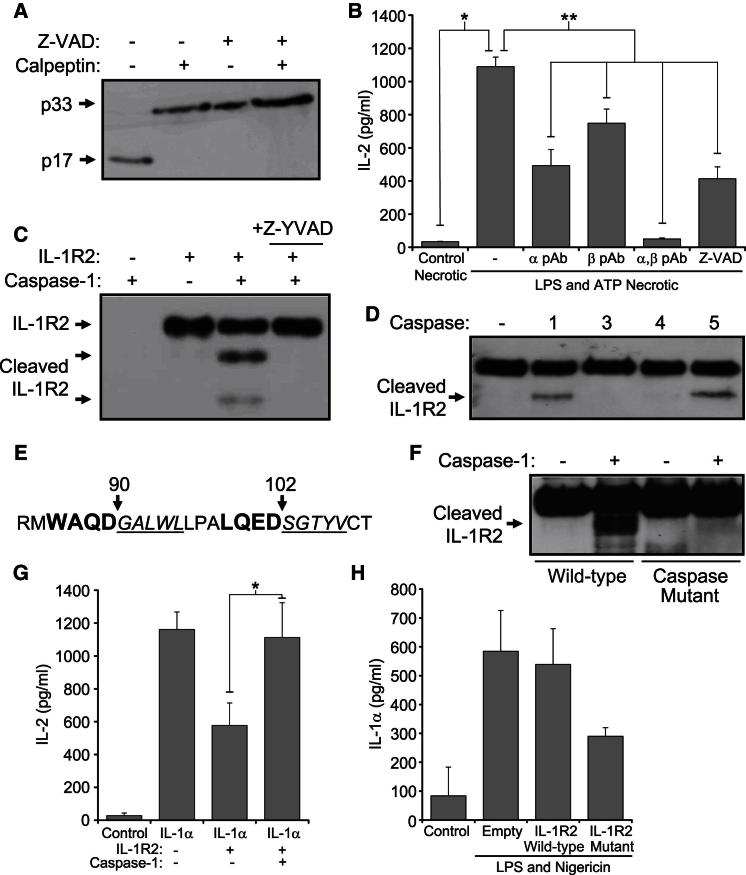
Necrosis can induce profound inflammation or be clinically silent. However, the mechanisms underlying such tissue specificity are unknown. Interleukin-1α (IL-1α) is a key danger signal released upon necrosis that exerts effects on both innate and adaptive immunity and is considered to be constitutively active. In contrast, we have shown that necrosis-induced IL-1α activity is tightly controlled in a cell type-specific manner. Most cell types examined expressed a cytosolic IL-1 receptor 2 (IL-1R2) whose binding to pro-IL-1α inhibited its cytokine activity. In cell types exhibiting a silent necrotic phenotype, IL-1R2 remained associated with pro-IL-1α. Cell types possessing inflammatory necrotic phenotypes either lacked IL-1R2 or had activated caspase-1 before necrosis, which degraded and dissociated IL-1R2 from pro-IL-1α. Full IL-1α activity required cleavage by calpain after necrosis, which increased its affinity for IL-1 receptor 1. Thus, we report a cell type-dependent process that fundamentally governs IL-1α activity postnecrosis and the mechanism allowing conditional release of this blockade.
Overview
The claims and statistics of this paper haven’t been checked yet.
Run the check — free, no account needed. It reads the open-access text and checks the sources it cites.
Integrity signals
Registry
Cites
Statistics
Figures
Verification
Claims the paper makes
The claims and statistics of this paper haven’t been checked yet.
Run the check — free, no account needed. It reads the open-access text and checks the sources it cites.
Claims other papers make about this one
Each is checked against this paper’s own text: does it say what the citing paper says it does?
In the citing paper
“Indeed, necrotic VSMCs potently drive inflammation via IL1α due to a lack of IL-1R2 that normally binds and inhibits IL-1α 133,189 .”
From Vascular smooth muscle cells in atherosclerosis (2019) · cites this paper as [189]
Self-check
Percentages, sums and reported differences re-computed from the paper’s own numbers.
The self-check needs the paper’s full text.
Citations
Cites
Tolerance, Danger and the Extended Family
Matzinger, P. (1994) · Annual Review of Immunology · doi:10.1146/annurev.iy.12.040194.005015 · Cited by 5,107 · cited 1×
“The ‘‘danger’’ model proposes that immunity responds to nonphysiological cell death, damage, or stress (Matzinger, 1994).”
Biologic basis for interleukin-1 in disease.
Dinarello, C. (1996) · Blood · doi:10.1182/blood.v87.6.2095.bloodjournal8762095 · Cited by 4,344 · cited 2×
“Indeed, increased IL-1 activity is a hallmark of many chronic inflammatory conditions, including rheumatoid arthritis, gout, diabetes, atherosclerosis, and psoriasis (Dinarello, 1996, 2009; Duewell et al., 2010; Rajamäki et al., 2010).”
Release of chromatin protein HMGB1 by necrotic cells triggers inflammation
Scaffidi, P., Misteli, T., & Bianchi, M. E. (2002) · Nature · doi:10.1038/nature00858 · Cited by 4,221
NLRP3 inflammasomes are required for atherogenesis and activated by cholesterol crystals
Duewell, P., Kono, H., Rayner, K. J., Sirois, C. M., Vladimer, G., Bauernfeind, F. G., Abela, G. S., Franchi, L., Nuñez, G., Schnurr, M., et al. (2010) · Nature · doi:10.1038/nature08938 · Cited by 4,026 · cited 2×
“Indeed, increased IL-1 activity is a hallmark of many chronic inflammatory conditions, including rheumatoid arthritis, gout, diabetes, atherosclerosis, and psoriasis (Dinarello, 1996, 2009; Duewell et al., 2010; Rajamäki et al., 2010).”
Immunological and inflammatory functions of the interleukin-1 family
Dinarello, C. A. (2009) · Annual Review of Immunology · doi:10.1146/annurev.immunol.021908.132612 · Cited by 3,466 · cited 11×
“IL-1a is near universally expressed (Dinarello, 2009), lacks a signal peptide, is rarely extracellular under normal physiology, and also associates with chromatin during apoptosis, resulting in retention (Cohen et al.”
InfluentialSterile inflammation: sensing and reacting to damage
Chen, G. Y., & Nuñez, G. (2010) · Nature Reviews Immunology · doi:10.1038/nri2873 · Cited by 3,051 · cited 4×
“Many human diseases are driven by activation of these pathways, including ischemia-reperfusion injury, Alzheimer’s disease, atherosclerosis, and toxic insults to liver and lung (Chen and Nuñez, 2010; Kono and Rock, 2008; Stewart et al., 2010).”
InfluentialGhiringhelli, F., Apetoh, L., Tesniere, A., Aymeric, L., Ma, Y., Ortiz, C., Vermaelen, K., Panaretakis, T., Mignot, G., Ullrich, E., et al. (2009) · Nature Medicine · doi:10.1038/nm.2028 · Cited by 1,898 · cited 1×
“Induction of antitumor immunity in vivo is dependent upon the mode of cell death, whereby necrosis is more immunogenic than apoptosis (Melcher et al., 1998) and local IL-1 activity (Ghiringhelli et al., 2009; Michaud et al., 2011).”
How dying cells alert the immune system to danger
Kono, H., & Rock, K. L. (2008) · Nature Reviews Immunology · doi:10.1038/nri2215 · Cited by 1,737 · cited 6×
“Many human diseases are driven by activation of these pathways, including ischemia-reperfusion injury, Alzheimer’s disease, atherosclerosis, and toxic insults to liver and lung (Chen and Nuñez, 2010; Kono and Rock, 2008; Stewart et al., 2010).”
InfluentialAltered Cytokine Export and Apoptosis in Mice Deficient in Interleukin-1β Converting Enzyme
Kuida, K., Lippke, J. A., Ku, G., Harding, M. W., Livingston, D. J., Su, M. S. S., & Flavell, R. A. (1995) · Science · doi:10.1126/science.7535475 · Cited by 1,631 · cited 1×
“Indeed, expression of an uncleavable IL-1R2 mutant reduces IL-1a release, whereas Casp1 / mice have long been known to be deficient in IL-1a secretion (Kuida et al., 1995; Li et al., 1995).”
Cloning, sequence and expression of two distinct human interleukin-1 complementary DNAs
March, C. J., Mosley, B., Larsen, A., Cerretti, D. P., Braedt, G., Price, V. L., Gillis, S. A., Henney, C. S., Kronheim, S. R., Grabstein, K. H., et al. (1985) · Nature · doi:10.1038/315641a0 · Cited by 1,559 · cited 4×
“, 2003), and cytokine activity is supposedly independent of cleavage (March et al., 1985; Mosley et al., 1987).”
Influential
Cited by
Sorted by citations
The interleukin-1 family: back to the future
Garlanda, C., Dinarello, C. A., & Mantovani, A. (2013) · Immunity · doi:10.1016/j.immuni.2013.11.010 · Cited by 1,945
“Because IL-1R2 is expressed by a limited set of cells, this would represent a further mechanism of negative control of IL-1a by IL-1R2 during necrosis, restricted to specific cell types (Zheng et al., 2013).”
Vascular smooth muscle cells in atherosclerosis
Basatemur, G. L., Jørgensen, H. F., Clarke, M. C. H., Bennett, M. R., & Mallat, Z. (2019) · Nature Reviews Cardiology · doi:10.1038/s41569-019-0227-9 · Cited by 1,099
Self-citationPyroptosis versus necroptosis: similarities, differences, and crosstalk
Frank, D., & Vince, J. E. (2019) · Cell Death & Differentiation · doi:10.1038/s41418-018-0212-6 · Cited by 1,062
Interleukin-1 and Related Cytokines in the Regulation of Inflammation and Immunity
Mantovani, A., Dinarello, C. A., Molgora, M., & Garlanda, C. (2019) · Immunity · doi:10.1016/j.immuni.2019.03.012 · Cited by 1,046
Walsh, J. G., Muruve, D. A., & Power, C. (2014) · Nature Reviews Neuroscience · doi:10.1038/nrn3638 · Cited by 637
Metadata
- Authors
- Zheng, Y., Humphry, M., Maguire, J. J., Bennett, M. R., & Clarke, M. C. H.
- Affiliations
- University of Cambridge (GB)
- Corresponding author
- Clarke, Murray C.H.
- Venue
- Immunity
- Publisher
- Elsevier BV
- Published
- 2013-02
- Volume
- 38
- Issue
- 2
- Pages
- 285-295
- ISSN
- 1074-7613 (ISSN-L)
- PMC
- PMC3659285
- OpenAlex
- W2038182824
- Cited by
- 205
- References
- 54
- Citations by year
- 2026: 6 · 2025: 10 · 2024: 15 · 2023: 11 · 2022: 18 · 2021: 15 · 2020: 6 · 2019: 14 · 2018: 15 · 2017: 17 · 2016: 18 · 2015: 20 · 2014: 18 · 2013: 22
- FWCI
- 11.65
- Type
- journal article
- Language
- en
- Open access
- hybrid
- doi.org
- Licence
- Locations
- Immunity (publishedVersion, cc-by)
- Europe PMC (PubMed Central) (publishedVersion, cc-by-nc-nd)
- PubMed Central (publishedVersion, cc-by-nc-nd)
- PubMed (publishedVersion)
- Apollo (University of Cambridge) (submittedVersion, cc-by-nc-nd)
- Apollo (University of Cambridge) (submittedVersion, cc-by)
- Apollo (cc-by)
- Funders
- National Institute for Health and Care Research
- British Heart Foundation (RG/08/009/25841, PG/06/024/20354, FS/13/3/30038, RG04/001, FS/09/005/26845)
- NIHR Cambridge Biomedical Research Centre
- Topics
- Life Sciences › Biochemistry, Genetics and Molecular Biology › Molecular Biology › Inflammasome and immune disorders
- Life Sciences › Immunology and Microbiology › Immunology › Immune Response and Inflammation
- Life Sciences › Biochemistry, Genetics and Molecular Biology › Molecular Biology › Cell death mechanisms and regulation
- Keywords
- interleukin-1 alpha, interleukin-1 receptor 2, sterile inflammation, necrosis, caspase-1, calpain, IL-1 receptor 1, damage-associated molecular patterns
- MeSH terms
- Animals, Calpain, Cell Line, Gene Expression Regulation, Humans, Inflammation, Necrosis, Organ Specificity, Protein Binding, Protein Precursors, Signal Transduction, Caspase 1, Mice, Receptors, Interleukin-1 Type II, Interleukin-1alpha, Proteolysis
About these checks
Registry, retraction, Cites and statistics results are computed, not judged, with one exception: a printed reference that no index lists is read once by a model before it counts as a citation error. Claims are extracted by a model and kept only when their quote appears verbatim in the text; each cited source is then checked, with a model’s help, for whether it says what the claim relies on. Those verdicts can be wrong — read the claim’s quote and the cited source before relying on one.
Statistics and arithmetic are recomputed, not judged.
Confidence bands are shown only for fields calibrated on our annotated test set. None is calibrated yet, so no band is shown.
What counts as a claim ›How we measure confidence ›How we check this ›
Are you an author, or do you see a problem with this page? Request a review
