Cited by 196Viral Infections and Immunology ResearchCOVID-19 Clinical Research StudiesSARS-CoV-2 and COVID-19 Research

The DOI matches its Crossref record; 78 of the 80 references it cites were found in a registry or an index.

SARS-CoV-2 Infects Human Engineered Heart Tissues and Models COVID-19 Myocarditis

Open access

Published version of a preprint

Abstract

Epidemiological studies of the COVID-19 pandemic have revealed evidence of cardiac involvement and documented that myocardial injury and myocarditis are predictors of poor outcomes. Nonetheless, little is understood regarding SARS-CoV-2 tropism within the heart and whether cardiac complications result directly from myocardial infection. Here, we develop a human engineered heart tissue model and demonstrate that SARS-CoV-2 selectively infects cardiomyocytes. Viral infection is dependent on expression of angiotensin-I converting enzyme 2 (ACE2) and endosomal cysteine proteases, suggesting an endosomal mechanism of cell entry. After infection with SARS-CoV-2, engineered tissues display typical features of myocarditis, including cardiomyocyte cell death, impaired cardiac contractility, and innate immune cell activation. Consistent with these findings, autopsy tissue obtained from individuals with COVID-19 myocarditis demonstrated cardiomyocyte infection, cell death, and macrophage-predominate immune cell infiltrate. These findings establish human cardiomyocyte tropism for SARS-CoV-2 and provide an experimental platform for interrogating and mitigating cardiac complications of COVID-19.

Overview

The claims and statistics of this paper haven’t been checked yet.

Run the check — free, no account needed. It reads the open-access text and checks the sources it cites.

A few free checks a day · papers already verified open instantly · results are public

Integrity signals

Registry

Crossref · 10.1016/j.jacbts.2021.01.002

Cites

78 of 78 references verified0 citation errors · 0 not checkable

Statistics

Figures

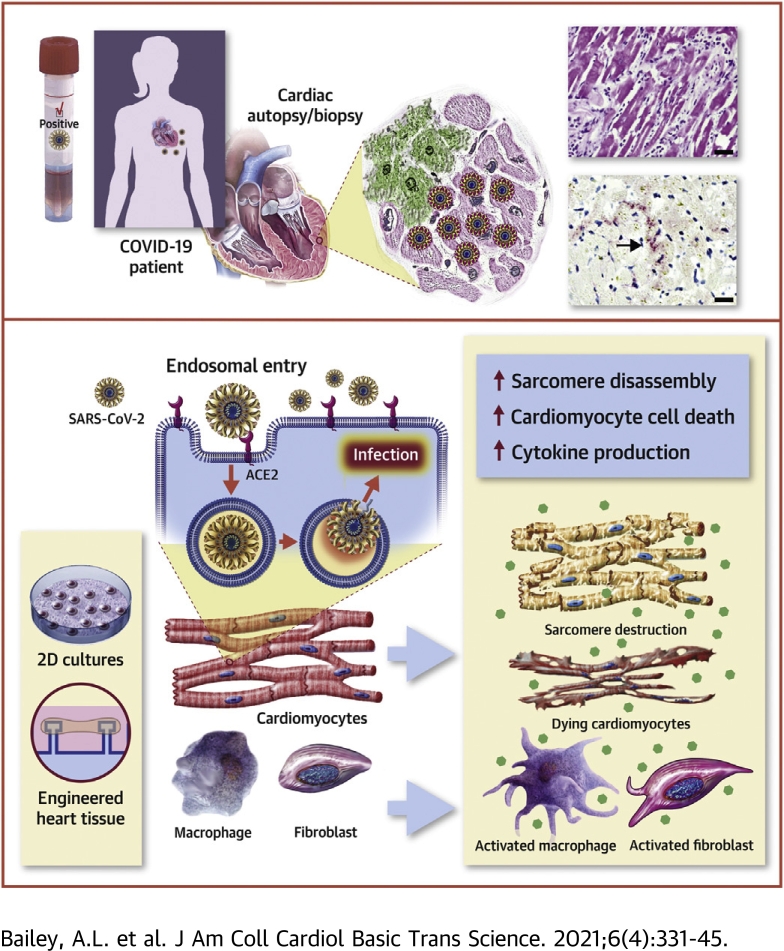
Graphical abstract Visual Abstract
Graphical abstract Visual AbstractCC BY-NC-ND · PubMed Central
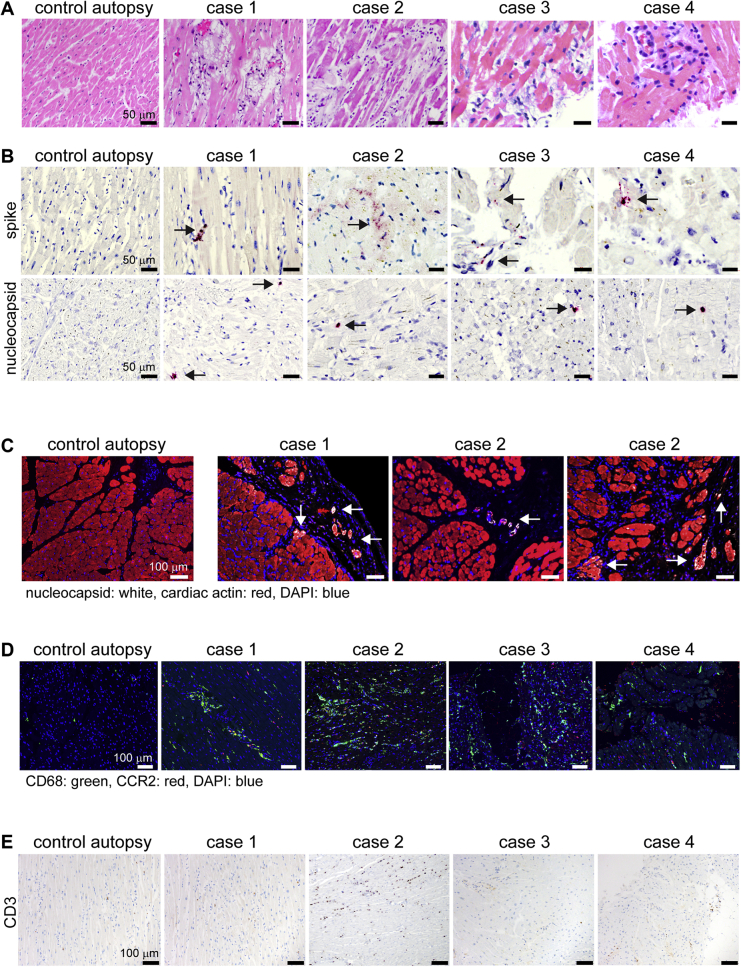
Figure 1 Specimens From Patients With Severe COVID-19 Myocarditis Show Evidence of SARS-CoV-2 Cardiomyocyte Infection (A) Hematoxylin and eosin staining of cardiac autopsy (anterior left ventricular wall) and biopsy samples (right ventricular septum) from subjects without coronavirus disease-2019 (COVID-19) (control case) and patients with severe COVID-19 myocarditis (case 1-4). (B) In situ hybridization for severe acute respiratory syndrome-coronavirus-2 (SARS-CoV-2) spike and nucleocapsid RNA (red). Hematoxylin: blue. The arrows denote viral RNA staining in cells with cardiomyocyte morphology. (C) Immunostaining of control and COVID-19 myocarditis cardiac autopsy tissue for SARS-CoV-2 nucleocapsid (white) and cardiac actin (red). DAPI: blue. The arrows denote nucleocapsid staining in cardiomyocytes. (D) Immunostaining of control and COVID-19 myocarditis specimens for CD68 (green) and CCR2 (red). DAPI: blue. (E) Immunostaining of control and COVID-19 myocarditis tissue for CD3 (brown). Hematoxylin: blue. DAPI = 4′,6-diamidino-2-phenylindole.
Figure 1 Specimens From Patients With Severe COVID-19 Myocarditis Show Evidence of SARS-CoV-2 Cardiomyocyte Infection (A) Hematoxylin and eosin staining of cardiac autopsy (anterior left ventricular wall) and biopsy samples (right ventricular septum) from subjects without coronavirus disease-2019 (COVID-19) (control case) and patients with severe COVID-19 myocarditis (case 1-4). (B) In situ hybridization for severe acute respiratory syndrome-coronavirus-2 (SARS-CoV-2) spike and nucleocapsid RNA (red). Hematoxylin: blue. The arrows denote viral RNA staining in cells with cardiomyocyte morphology. (C) Immunostaining of control and COVID-19 myocarditis cardiac autopsy tissue for SARS-CoV-2 nucleocapsid (white) and cardiac actin (red). DAPI: blue. The arrows denote nucleocapsid staining in cardiomyocytes. (D) Immunostaining of control and COVID-19 myocarditis specimens for CD68 (green) and CCR2 (red). DAPI: blue. (E) Immunostaining of control and COVID-19 myocarditis tissue for CD3 (brown). Hematoxylin: blue. DAPI = 4′,6-diamidino-2-phenylindole.CC BY-NC-ND · PubMed Central
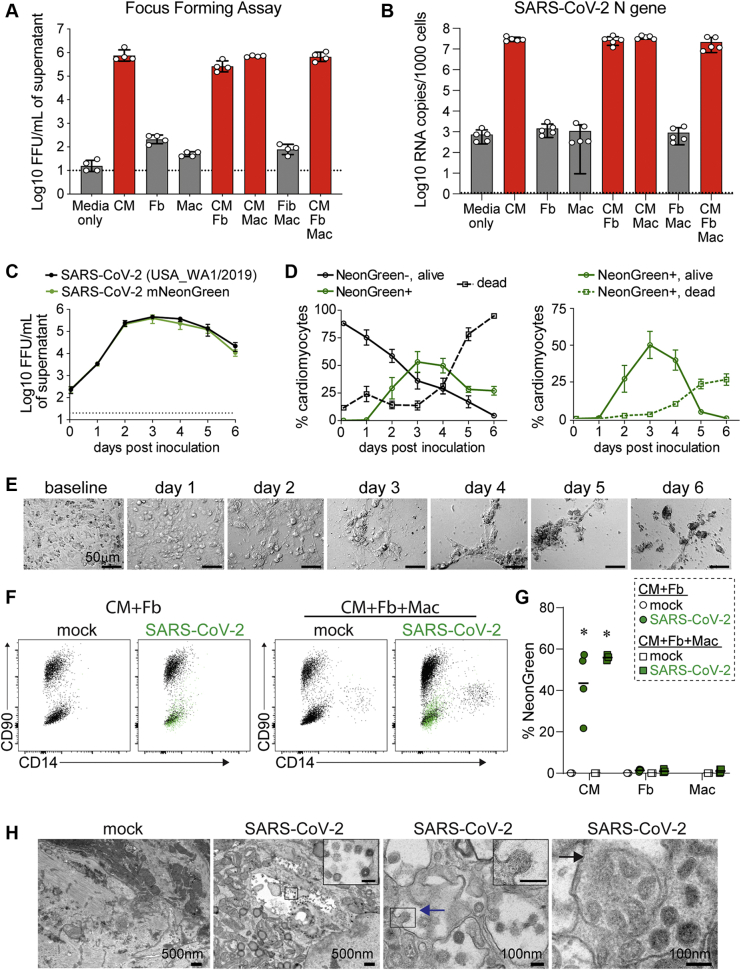
Figure 2 SARS-CoV-2 Infects Cardiomyocytes (A) Focus-forming assay measuring production of infectious virus from human pluripotent stem cell (hPSC)–derived cardiomyocytes (CM), fibroblasts (Fb), and macrophages (Mac) inoculated with SARS-CoV-2 (multiplicity of infection [MOI], 0.1). Media only denotes wells that contain no cells. Assays were performed 3 days following inoculation. Dashed line indicates limit of assay detection. (B) Quantitative real-time polymerase chain reaction (RT-PCR) showing viral N-gene copies in cultures containing CM, Fb, and Macs inoculated with SARS-CoV-2 (MOI 0.1). RNA was collected 3 days post-inoculation (n = 5 per group). (C) Focus-forming assay measuring infectious SARS-CoV-2 (black line indicates wild-type; green line indicates NeonGreen) in supernatant of hPSC-derived cardiomyocytes over time following inoculation (MOI 0.1). A dashed line indicates the limit of detection (n = 4 per group). (D) Two-dimensional cultures of hPSC-derived cardiomyocytes were inoculated with SARS-CoV-2 (MOI 0.1) and analyzed for viability (Zombie-Violet) and infection (NeonGreen) as a function of time by flow cytometry. Right plot shows viability of NeonGreen-positive cells (n = 4 per group). (A–D) Mean values are plotted and error bars denote standard error of the mean. (E) Brightfield microscopy showing cytopathic effect in hPSC-derived cardiomyocytes infected with SARS-CoV-2 (MOI 0.1). Representative images from 5 individual samples. (F) Flow cytometry of 2-dimensional tissues containing CM and Fb (left) or CM, Fb, and Mac (right) harvested on day 3 following mock infection or inoculation with SARS-CoV-2 (MOI 0.1). Representative plot from 4 independent samples. Cardiomyocytes (CD90-CD14-) showed prominent NeonGreen fluorescence (green overlay). NeonGreen signal was not detected in fibroblasts (CD90+CD14-) or macrophages (CD90-CD14+). (G) Quantification of NeonGreen-positive cells from 2-dimensional tissues containing hPSC-cardiomyocytes and fibroblasts or hPSC-cardiomyocytes, fibroblasts, and macrophages (n = 4 per group). Bars denotes median value. ∗p < 0.05 compared to mock infection (Mann-Whitney test). (H) Transmission electron microscopy micrographs of cardiomyocytes in 2-dimensional tissues infected with either mock or SARS-CoV-2 (MOI 0.1). Tissues were harvested on day 3 post-inoculation. Viral budding (blue arrow) and endosomal compartments filled with virions (black arrow) are denoted. Scale bars in insets are 100 nm. Representative image from 4 independent samples. FFU = focus forming units; other abbreviation as in Figure 1.
Figure 2 SARS-CoV-2 Infects Cardiomyocytes (A) Focus-forming assay measuring production of infectious virus from human pluripotent stem cell (hPSC)–derived cardiomyocytes (CM), fibroblasts (Fb), and macrophages (Mac) inoculated with SARS-CoV-2 (multiplicity of infection [MOI], 0.1). Media only denotes wells that contain no cells. Assays were performed 3 days following inoculation. Dashed line indicates limit of assay detection. (B) Quantitative real-time polymerase chain reaction (RT-PCR) showing viral N-gene copies in cultures containing CM, Fb, and Macs inoculated with SARS-CoV-2 (MOI 0.1). RNA was collected 3 days post-inoculation (n = 5 per group). (C) Focus-forming assay measuring infectious SARS-CoV-2 (black line indicates wild-type; green line indicates NeonGreen) in supernatant of hPSC-derived cardiomyocytes over time following inoculation (MOI 0.1). A dashed line indicates the limit of detection (n = 4 per group). (D) Two-dimensional cultures of hPSC-derived cardiomyocytes were inoculated with SARS-CoV-2 (MOI 0.1) and analyzed for viability (Zombie-Violet) and infection (NeonGreen) as a function of time by flow cytometry. Right plot shows viability of NeonGreen-positive cells (n = 4 per group). (A–D) Mean values are plotted and error bars denote standard error of the mean. (E) Brightfield microscopy showing cytopathic effect in hPSC-derived cardiomyocytes infected with SARS-CoV-2 (MOI 0.1). Representative images from 5 individual samples. (F) Flow cytometry of 2-dimensional tissues containing CM and Fb (left) or CM, Fb, and Mac (right) harvested on day 3 following mock infection or inoculation with SARS-CoV-2 (MOI 0.1). Representative plot from 4 independent samples. Cardiomyocytes (CD90-CD14-) showed prominent NeonGreen fluorescence (green overlay). NeonGreen signal was not detected in fibroblasts (CD90+CD14-) or macrophages (CD90-CD14+). (G) Quantification of NeonGreen-positive cells from 2-dimensional tissues containing hPSC-cardiomyocytes and fibroblasts or hPSC-cardiomyocytes, fibroblasts, and macrophages (n = 4 per group). Bars denotes median value. ∗p < 0.05 compared to mock infection (Mann-Whitney test). (H) Transmission electron microscopy micrographs of cardiomyocytes in 2-dimensional tissues infected with either mock or SARS-CoV-2 (MOI 0.1). Tissues were harvested on day 3 post-inoculation. Viral budding (blue arrow) and endosomal compartments filled with virions (black arrow) are denoted. Scale bars in insets are 100 nm. Representative image from 4 independent samples. FFU = focus forming units; other abbreviation as in Figure 1.CC BY-NC-ND · PubMed Central
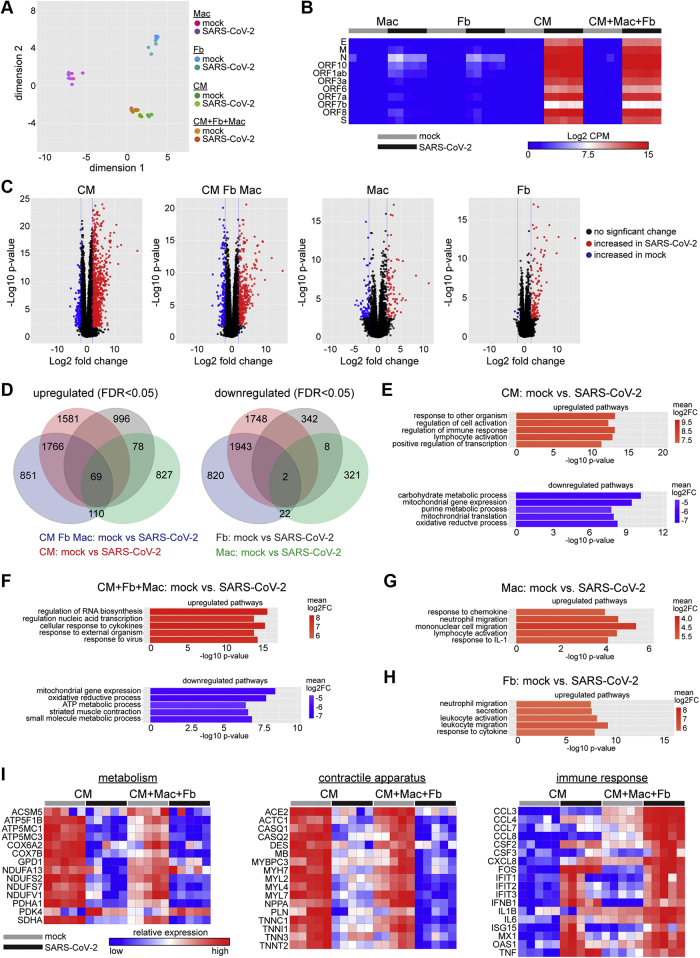
Figure 3 RNA Sequencing Identified Viral Transcription and Activation of Innate Immune Response in hPSC-Derived Cardiomyocytes and Tissues (A) MDS plot of RNA sequencing data obtained from mock and SARS-CoV-2–infected (MOI 0.1) hPSC-derived CMs, Fbs, Macs, and 2-dimensional tissues (CM + Fb + Mac). Cells and tissues were harvested on day 3 post-inoculation (n = 5 per group). (B) Heatmap of SARS-CoV-2 viral gene expression. Color scale denotes absolute expression as log2 counts per million reads (CPM) (scale: blue = 0, red = 15). (C) Volcano plots showing differentially expressed genes between mock and SARS-CoV-2–infected conditions. Black dots indicate no significant change, red dots indicate upregulated during infection (log2 fold change>2, FDR p < 0.05), and blue dots indicate downregulated during infection (log2 fold change<2, FDR p < 0.05). Data points correspond to individual transcripts. (D) Venn diagram of genes upregulated and downregulated in each cell type and tissues. Differential expression is based on change relative to corresponding uninfected (mock) samples. (E to H) Gene ontology (GO) pathway analysis of CM (E), CM + Fb + Mac (F), Mac (G) and Fib (H) showing top 5 upregulated (red) and downregulated (blue) pathways in SARS-CoV-2–infected samples compared to mock. Color indicates log2 fold change (log2FC). (I) Heat maps of selected differentially expressed genes implicated in metabolism (left), contractile apparatus (center), and immune response (right). CM and tissues (CM + Mac + Fb) are displayed. Color scale denotes relative gene expression (high red, low blue) across cell types and conditions. ATP = adenosine triphosphate; FDR = false discovery rate; IL = interleukin. other abbreviations as in Figures 1 and 2.
Figure 3 RNA Sequencing Identified Viral Transcription and Activation of Innate Immune Response in hPSC-Derived Cardiomyocytes and Tissues (A) MDS plot of RNA sequencing data obtained from mock and SARS-CoV-2–infected (MOI 0.1) hPSC-derived CMs, Fbs, Macs, and 2-dimensional tissues (CM + Fb + Mac). Cells and tissues were harvested on day 3 post-inoculation (n = 5 per group). (B) Heatmap of SARS-CoV-2 viral gene expression. Color scale denotes absolute expression as log2 counts per million reads (CPM) (scale: blue = 0, red = 15). (C) Volcano plots showing differentially expressed genes between mock and SARS-CoV-2–infected conditions. Black dots indicate no significant change, red dots indicate upregulated during infection (log2 fold change>2, FDR p < 0.05), and blue dots indicate downregulated during infection (log2 fold change<2, FDR p < 0.05). Data points correspond to individual transcripts. (D) Venn diagram of genes upregulated and downregulated in each cell type and tissues. Differential expression is based on change relative to corresponding uninfected (mock) samples. (E to H) Gene ontology (GO) pathway analysis of CM (E), CM + Fb + Mac (F), Mac (G) and Fib (H) showing top 5 upregulated (red) and downregulated (blue) pathways in SARS-CoV-2–infected samples compared to mock. Color indicates log2 fold change (log2FC). (I) Heat maps of selected differentially expressed genes implicated in metabolism (left), contractile apparatus (center), and immune response (right). CM and tissues (CM + Mac + Fb) are displayed. Color scale denotes relative gene expression (high red, low blue) across cell types and conditions. ATP = adenosine triphosphate; FDR = false discovery rate; IL = interleukin. other abbreviations as in Figures 1 and 2.CC BY-NC-ND · PubMed Central
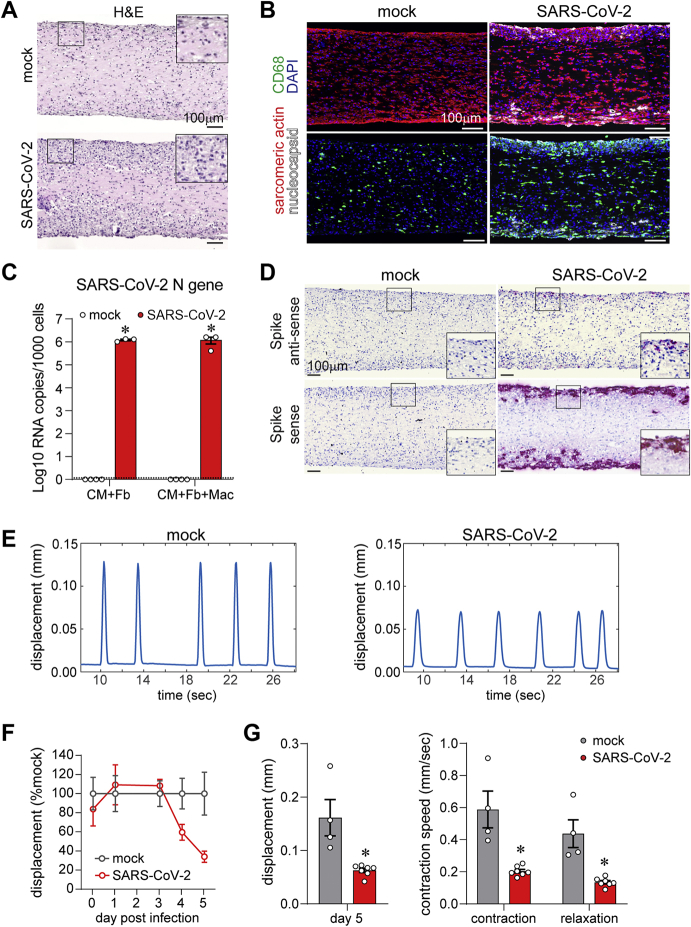
Figure 4 EHTs Recapitulate Aspects of COVID-19 Myocarditis (A) Hematoxylin and eosin (H&E)–stained sections of 3-dimensional engineered heart tissue (EHT) consisting of hPSC-derived CM, Fbs, and Macs 5 days following mock infection or inoculation with SARS-CoV-2 (MOI 0.1). Insets are high-magnification images of the boxed areas. Representative images from 4 independent samples. (B) Immunostaining of mock or SARS-CoV-2–infected 3-dimensional EHTs for sarcomeric actin (cardiomyocytes, red), CD68 (macrophages, green), and nucleocapsid protein (white). EHTs were harvested 5 days post-inoculation. Blue: DAPI. Representative images from 4 independent samples. (C) Quantitative RT-PCR of SARS-CoV-2 N-gene expression in EHTs consisting of hPSC-derived CM, Fb, and/or Macs. EHTs were either mock infected or inoculated with SARS-CoV-2 (MOI 0.1) and harvested 5 days post-inoculation. Error bars denote SE of the mean. Dotted line: limit of detection. ∗p < 0.05 compared to uninfected control (mock, Student t test test). (D) In situ hybridization for SARS-CoV-2 spike RNA sense and antisense strands (red) in EHTs 5 days after mock or SARS-CoV-2 infection (MOI 0.1). Blue: hematoxylin. Representative images from 4 independent specimens. Insets are high magnification images of the boxed areas. (E) Spontaneous beating displacement traces for infected and uninfected EHTs on day 5 post-infection. (F) Displacement (relative to uninfected mock condition) generated by spontaneous beating of EHTs as a function of time following inoculation with SARS-CoV-2 (MOI 0.1). Each data point represents a mean value from 4 to 7 independent samples, error bars denote SE of the mean. (G) Quantification of absolute displacement (left) and contraction speed (right) generated by spontaneous beating of EHTs 5 days following mock or SARS-CoV-2 infection (MOI 0.1). Error bars represent SE of the mean; ∗p < 0.05 compared to mock (Student’s t-test test). Abbreviations as in Figures 1 and 2.
Figure 4 EHTs Recapitulate Aspects of COVID-19 Myocarditis (A) Hematoxylin and eosin (H&E)–stained sections of 3-dimensional engineered heart tissue (EHT) consisting of hPSC-derived CM, Fbs, and Macs 5 days following mock infection or inoculation with SARS-CoV-2 (MOI 0.1). Insets are high-magnification images of the boxed areas. Representative images from 4 independent samples. (B) Immunostaining of mock or SARS-CoV-2–infected 3-dimensional EHTs for sarcomeric actin (cardiomyocytes, red), CD68 (macrophages, green), and nucleocapsid protein (white). EHTs were harvested 5 days post-inoculation. Blue: DAPI. Representative images from 4 independent samples. (C) Quantitative RT-PCR of SARS-CoV-2 N-gene expression in EHTs consisting of hPSC-derived CM, Fb, and/or Macs. EHTs were either mock infected or inoculated with SARS-CoV-2 (MOI 0.1) and harvested 5 days post-inoculation. Error bars denote SE of the mean. Dotted line: limit of detection. ∗p < 0.05 compared to uninfected control (mock, Student t test test). (D) In situ hybridization for SARS-CoV-2 spike RNA sense and antisense strands (red) in EHTs 5 days after mock or SARS-CoV-2 infection (MOI 0.1). Blue: hematoxylin. Representative images from 4 independent specimens. Insets are high magnification images of the boxed areas. (E) Spontaneous beating displacement traces for infected and uninfected EHTs on day 5 post-infection. (F) Displacement (relative to uninfected mock condition) generated by spontaneous beating of EHTs as a function of time following inoculation with SARS-CoV-2 (MOI 0.1). Each data point represents a mean value from 4 to 7 independent samples, error bars denote SE of the mean. (G) Quantification of absolute displacement (left) and contraction speed (right) generated by spontaneous beating of EHTs 5 days following mock or SARS-CoV-2 infection (MOI 0.1). Error bars represent SE of the mean; ∗p < 0.05 compared to mock (Student’s t-test test). Abbreviations as in Figures 1 and 2.CC BY-NC-ND · PubMed Central
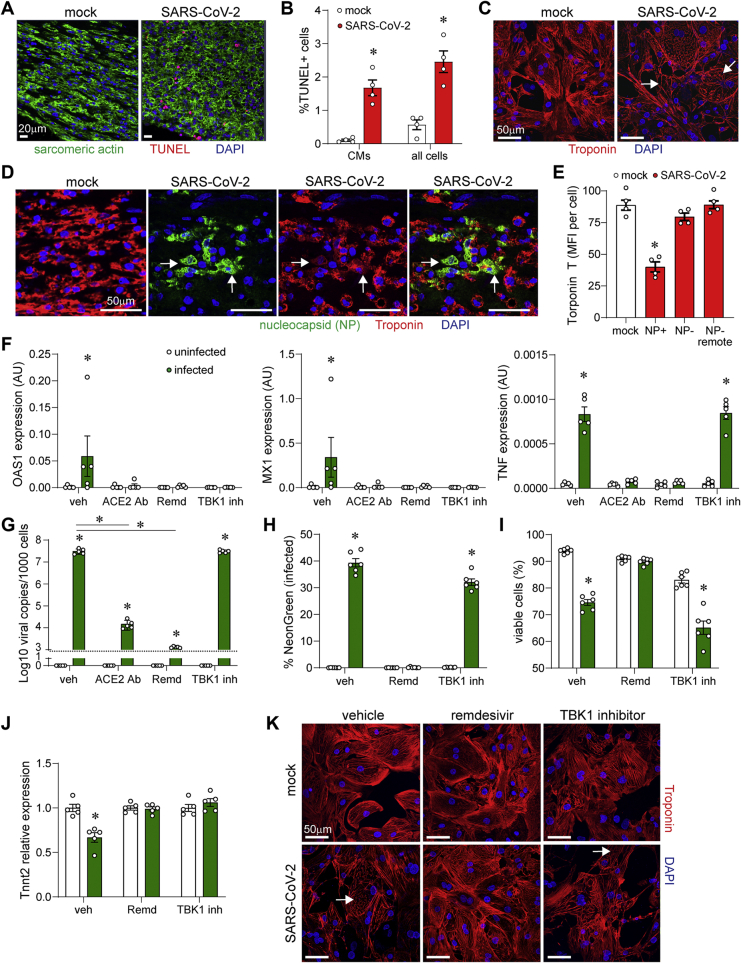
Figure 5 Mechanisms of Reduced EHT Contractility (A) Terminal deoxynucleotidyl transferase dUTP nick end labelling (TUNEL) stain (red) and cardiac actin (green) immunostaining of EHTs (CM +Fb + Mac) 5 days after mock or SARS-CoV-2 infection (MOI 0.1). Blue: DAPI. Representative images from 4 independent experiments. (B) Quantification of TUNEL-positive cells in areas of viral infection. Error bars represent SE of the mean, ∗p < 0.05 compared to mock (Student t test). (C) Immunostaining of hPSC-derived cardiomyocytes for troponin T (red) 3 days after inoculation with mock control or SARS-CoV-2–NeonGreen (MOI 0.1). Blue: DAPI. Arrows denote areas of sarcomere disassembly. (D) Immunostaining of EHTs for troponin T (red) and SARS-CoV-2 nucleocapsid (green) 5 days after inoculation with mock control or SARS-CoV-2–NeonGreen (MOI 0.1). Blue: DAPI. Arrows denote SARS-CoV-2 nucleocapsid–positive cells with reduced troponin T staining. (E) Quantification of troponin T staining in mock (white) and SARS-CoV-2 infected (red) EHTs. Data is presented as mean florescence intensity (MFI). MFI was measured in infected (nucleocapsid-positive [NP+]) cardiomyocytes and uninfected (NP-) cardiomyocytes located proximal or remote to areas of infection. Error bars represent SE of the mean, ∗p < 0.05 compared to mock (Student t test). (F) Quantitative RT-PCR measuring OAS1, MX1, and tumor necrosis factor (TNF) mRNA expression in hPSC-derived cardiomyocytes 3 days post-inoculation with mock control (white) or SARS-CoV-2 (green, MOI 0.1). Cells were treated with vehicle, angiotensin-converting enzyme 2 antibody (ACE2 Ab) (20 μg/ml), remdesivir (10 μM), or TBK inhibitor (MRT67307, 10μM). Error bars indicate SE of the mean. ∗p < 0.05 compared to mock control (Student t test). (G) Quantitative RT-PCR of SARS-CoV-2 N gene expression in hPSC-derived cardiomyocytes that were either mock infected (white) or inoculated with SARS-CoV-2 (green, MOI 0.1) and harvested 3 days post-inoculation. Error bars denote SE of the mean. Dotted line: limit of detection. ∗p < 0.05 compared to uninfected control (analysis of variance [ANOVA]) or vehicle infected as indicated by the bar (ANOVA). (H,I) Flow cytometry measuring the percent of infected (H) and viable (I) cardiomyocytes following either mock infection (white) or inoculation with SARS-CoV-2 (green, MOI 0.1). Cells were harvested and analyzed 3 days post-inoculation. Error bars denote SE of the mean. ∗p < 0.05 compared to uninfected control (ANOVA). (J) Quantitative RT-PCR measuring TNNT2 mRNA expression 3 days post-inoculation with mock control (white) or SARS-CoV-2 (green, MOI 0.1). Error bars indicate SE of the mean. ∗p < 0.05 compared to mock control (ANOVA). (K) Immunostaining for troponin T (red) 3 days post-inoculation with mock control or SARS-CoV-2–NeonGreen (MOI 0.1). Blue: DAPI. Arrows denote areas of sarcomere disassembly. Abbreviations as in Figures 1 and 2.
Figure 5 Mechanisms of Reduced EHT Contractility (A) Terminal deoxynucleotidyl transferase dUTP nick end labelling (TUNEL) stain (red) and cardiac actin (green) immunostaining of EHTs (CM +Fb + Mac) 5 days after mock or SARS-CoV-2 infection (MOI 0.1). Blue: DAPI. Representative images from 4 independent experiments. (B) Quantification of TUNEL-positive cells in areas of viral infection. Error bars represent SE of the mean, ∗p < 0.05 compared to mock (Student t test). (C) Immunostaining of hPSC-derived cardiomyocytes for troponin T (red) 3 days after inoculation with mock control or SARS-CoV-2–NeonGreen (MOI 0.1). Blue: DAPI. Arrows denote areas of sarcomere disassembly. (D) Immunostaining of EHTs for troponin T (red) and SARS-CoV-2 nucleocapsid (green) 5 days after inoculation with mock control or SARS-CoV-2–NeonGreen (MOI 0.1). Blue: DAPI. Arrows denote SARS-CoV-2 nucleocapsid–positive cells with reduced troponin T staining. (E) Quantification of troponin T staining in mock (white) and SARS-CoV-2 infected (red) EHTs. Data is presented as mean florescence intensity (MFI). MFI was measured in infected (nucleocapsid-positive [NP+]) cardiomyocytes and uninfected (NP-) cardiomyocytes located proximal or remote to areas of infection. Error bars represent SE of the mean, ∗p < 0.05 compared to mock (Student t test). (F) Quantitative RT-PCR measuring OAS1, MX1, and tumor necrosis factor (TNF) mRNA expression in hPSC-derived cardiomyocytes 3 days post-inoculation with mock control (white) or SARS-CoV-2 (green, MOI 0.1). Cells were treated with vehicle, angiotensin-converting enzyme 2 antibody (ACE2 Ab) (20 μg/ml), remdesivir (10 μM), or TBK inhibitor (MRT67307, 10μM). Error bars indicate SE of the mean. ∗p < 0.05 compared to mock control (Student t test). (G) Quantitative RT-PCR of SARS-CoV-2 N gene expression in hPSC-derived cardiomyocytes that were either mock infected (white) or inoculated with SARS-CoV-2 (green, MOI 0.1) and harvested 3 days post-inoculation. Error bars denote SE of the mean. Dotted line: limit of detection. ∗p < 0.05 compared to uninfected control (analysis of variance [ANOVA]) or vehicle infected as indicated by the bar (ANOVA). (H,I) Flow cytometry measuring the percent of infected (H) and viable (I) cardiomyocytes following either mock infection (white) or inoculation with SARS-CoV-2 (green, MOI 0.1). Cells were harvested and analyzed 3 days post-inoculation. Error bars denote SE of the mean. ∗p < 0.05 compared to uninfected control (ANOVA). (J) Quantitative RT-PCR measuring TNNT2 mRNA expression 3 days post-inoculation with mock control (white) or SARS-CoV-2 (green, MOI 0.1). Error bars indicate SE of the mean. ∗p < 0.05 compared to mock control (ANOVA). (K) Immunostaining for troponin T (red) 3 days post-inoculation with mock control or SARS-CoV-2–NeonGreen (MOI 0.1). Blue: DAPI. Arrows denote areas of sarcomere disassembly. Abbreviations as in Figures 1 and 2.CC BY-NC-ND · PubMed Central

Verification

Claims the paper makes

The claims and statistics of this paper haven’t been checked yet.

Run the check — free, no account needed. It reads the open-access text and checks the sources it cites.

A few free checks a day · papers already verified open instantly · results are public

Self-check

Percentages, sums and reported differences re-computed from the paper’s own numbers.

The self-check needs the paper’s full text.

Citations

Cites

Show all 80 references

Cited by

Sorted by citations

See all 196

Metadata

Authors
Bailey, A. L., Dmytrenko, O., Greenberg, L., Bredemeyer, A. L., Ma, P., Liu, J., Penna, V., Winkler, E. S., Sviben, S., Brooks, E., Nair, A. P., Heck, K. A., Rali, A. S., Simpson, L., Saririan, M., Hobohm, D., Stump, W. T., Fitzpatrick, J. A., Xie, X., Zhang, X., Shi, P.-Y., Hinson, J. T., Gi, W.-T., Schmidt, C., Leuschner, F., Lin, C.-Y., Diamond, M. S., Greenberg, M. J., & Lavine, K. J.
Affiliations
  • Washington University in St. Louis (US)
  • University of Wisconsin–Madison (US)
  • Baylor College of Medicine (US)
  • Vanderbilt University (US)
  • Creighton University (US)
  • The University of Texas Medical Branch at Galveston (US)
  • The Jackson Laboratory for Genomic Medicine (US)
  • Heidelberg University (DE)
Corresponding author
Lavine, Kory J.
Venue
JACC: Basic to Translational Science
Publisher
Elsevier BV
Published
2021-04
Volume
6
Issue
4
Pages
331-345
ISSN
2452-302X (ISSN-L)
OpenAlex
W3134776434
Cited by
193
References
80
Citations by year
2026: 8 · 2025: 13 · 2024: 37 · 2023: 50 · 2022: 42 · 2021: 43
FWCI
29.50
Type
journal article
Language
en
Open access
Locations
  • JACC Basic to Translational Science (publishedVersion, cc-by-nc-nd)
  • bioRxiv (Cold Spring Harbor Laboratory) (acceptedVersion)
  • PubMed Central (publishedVersion, cc-by-nc-nd)
  • PubMed (publishedVersion)
  • Digital Commons@Becker (Washington University School of Medicine) (submittedVersion, cc-by-nc-nd)
  • PubMed Central (submittedVersion)
  • Digital Commons-TMC (Texas Medical Center) (submittedVersion)
  • The Mouseion at the JAXlibrary (Jackson Laboratory) (submittedVersion)
Funders
  • Foundation for Barnes-Jewish Hospital
  • Center for Cellular Imaging, Washington University
  • National Institutes of Health (75N93019C00062, R01 AI127828, R01 HL138466, R01 HL139714, R01 HL141086)
  • St. Louis Children&apos;s Hospital (CDI-CORE-2015-505, CDI-CORE-2019-813)
  • Defense Advanced Research Projects Agency (HR001117S0019)
  • Burroughs Wellcome Fund (1014782)
  • March of Dimes Foundation (FY18-BOC-430198)
Topics
  • Health Sciences › Medicine › Infectious Diseases › Viral Infections and Immunology Research
  • Health Sciences › Medicine › Infectious Diseases › COVID-19 Clinical Research Studies
  • Health Sciences › Medicine › Infectious Diseases › SARS-CoV-2 and COVID-19 Research
Keywords
SARS-CoV-2, COVID-19 myocarditis, engineered heart tissue, cardiac complications of COVID-19, sarcomere disassembly, cytokine production, cardiomyocyte contractile dysfunction, cell death, viral pathogenesis, myocardial pathology

About these checks

Registry, retraction, Cites and statistics results are computed, not judged, with one exception: a printed reference that no index lists is read once by a model before it counts as a citation error. Claims are extracted by a model and kept only when their quote appears verbatim in the text; each cited source is then checked, with a model’s help, for whether it says what the claim relies on. Those verdicts can be wrong — read the claim’s quote and the cited source before relying on one.

Statistics and arithmetic are recomputed, not judged.

Confidence bands are shown only for fields calibrated on our annotated test set. None is calibrated yet, so no band is shown.

What counts as a claim ›How we measure confidence ›How we check this ›

Are you an author, or do you see a problem with this page? Request a review