

The DOI matches its Crossref record; 26 of the 26 references it cites were found in a registry or an index.
Elevated DNA methylation across a 48‐kb region spanning the HOXA gene cluster is associated with Alzheimer's disease neuropathology
Open accessAbstract
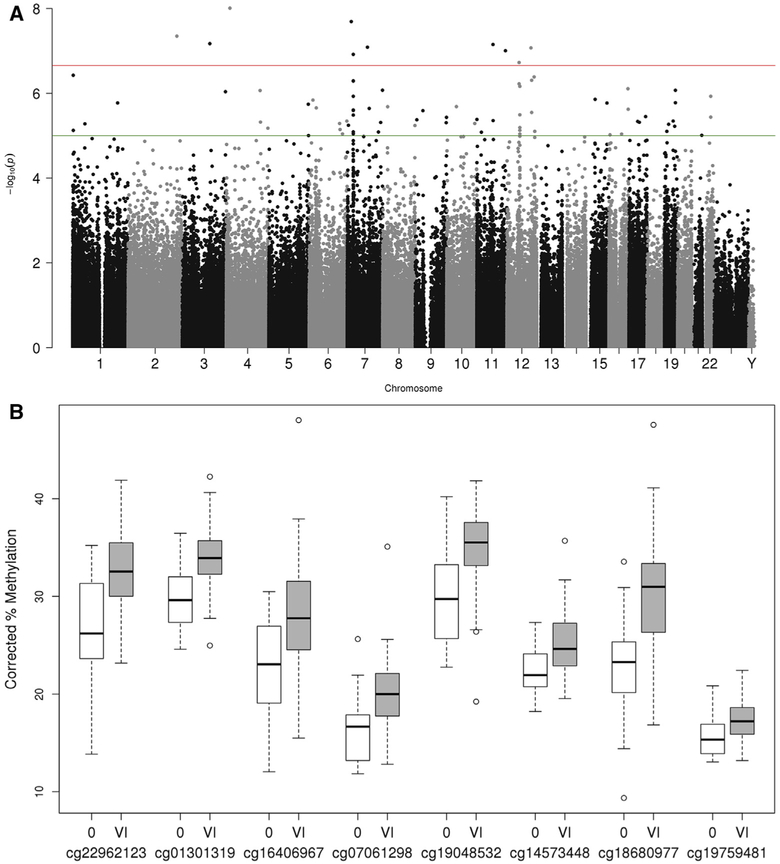
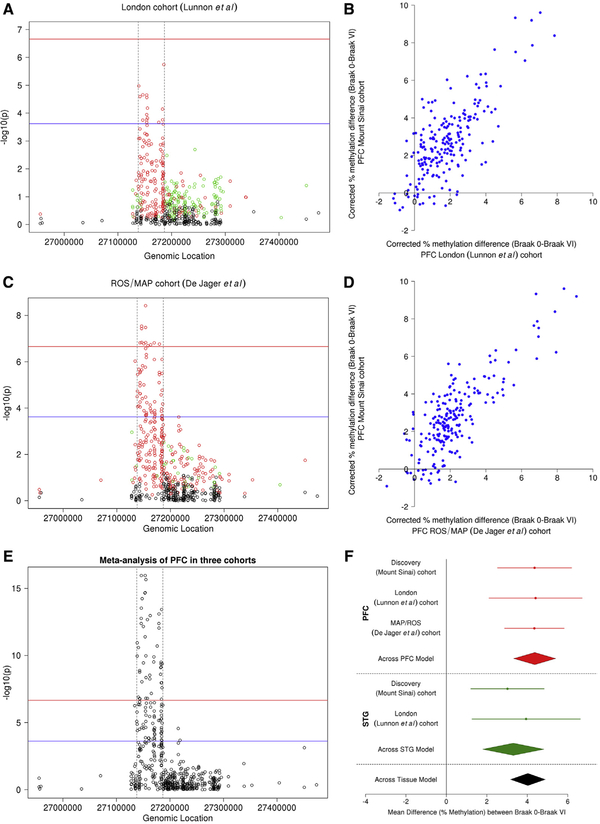
Introduction: Alzheimer's disease is a neurodegenerative disorder that is hypothesized to involve epigenetic dysregulation of gene expression in the brain. Methods: We performed an epigenome‐wide association study to identify differential DNA methylation associated with neuropathology in prefrontal cortex and superior temporal gyrus samples from 147 individuals, replicating our findings in two independent data sets (N = 117 and 740). Results: We identify elevated DNA methylation associated with neuropathology across a 48‐kb region spanning 208 CpG sites within the HOXA gene cluster. A meta‐analysis of the top‐ranked probe within the HOXA3 gene (cg22962123) highlighted significant hypermethylation across all three cohorts (P = 3.11 × 10⁻¹⁸). Discussion: We present robust evidence for elevated DNA methylation associated with Alzheimer's disease neuropathology spanning the HOXA gene cluster on chromosome 7. These data add to the growing evidence highlighting a role for epigenetic variation in Alzheimer's disease, implicating the HOX gene family as a target for future investigation.
Overview
The claims and statistics of this paper haven’t been checked yet.
Run the check — free, no account needed. It reads the open-access text and checks the sources it cites.
Integrity signals
Registry
Cites
Statistics
Figures
Verification
Claims the paper makes
The claims and statistics of this paper haven’t been checked yet.
Run the check — free, no account needed. It reads the open-access text and checks the sources it cites.
Claims other papers make about this one
Each is checked against this paper’s own text: does it say what the citing paper says it does?
The source backs part of the claim, not all of it — or backs it for a different population, condition or comparison.
In the citing paper
“Alterations of DNA methylation levels have been shown to be involved in many diseases, including AD [19–24].”
From Distinct sex-specific DNA methylation differences in Alzheimer’s disease (2022) · cites this paper as [23]
Experimental — accuracy not yet measuredThe source backs part of the claim, not all of it — or backs it for a different population, condition or comparison.
In the citing paper
“DNA methylation is an important epigenetic modification that regulates gene transcription and is known to be involved in AD”
From Sex-specific DNA methylation differences in Alzheimer’s disease pathology (2021) · cites this paper as [20]
Experimental — accuracy not yet measuredThe source backs part of the claim, not all of it — or backs it for a different population, condition or comparison.
In the citing paper
“Importantly, alterations of DNA methylation levels have also been implicated in multiple neurological disorders including AD [18–22]”
From Sex-specific DNA methylation differences in Alzheimer’s disease pathology (2021) · cites this paper as [20]
Experimental — accuracy not yet measuredThe cited source says what the claim attributes to it.
In the citing paper
“Notably, none of the 14 CpGs detected in our interaction analysis was identified in previous large-scale DNA methylation studies [18–22]”
From Sex-specific DNA methylation differences in Alzheimer’s disease pathology (2021) · cites this paper as [20]
Self-check
Percentages, sums and reported differences re-computed from the paper’s own numbers.
The self-check needs the paper’s full text.
Citations
Cites
Sperling, R. A., Aisen, P. S., Beckett, L. A., Bennett, D. A., Craft, S., Fagan, A. M., Iwatsubo, T., Jack, C. R., Kaye, J., Montine, T. J., et al. (2011) · Alzheimer's & Dementia · doi:10.1016/j.jalz.2011.03.003 · Cited by 7,155
Self-citationLeek, J. T., Johnson, W. E., Parker, H. S., Jaffe, A. E., & Storey, J. D. (2012) · Bioinformatics · doi:10.1093/bioinformatics/bts034 · Cited by 6,231
Hypothetical model of dynamic biomarkers of the Alzheimer's pathological cascade
Jack, C. R., Knopman, D. S., Jagust, W. J., Shaw, L. M., Aisen, P. S., Weiner, M. W., Petersen, R. C., & Trojanowski, J. Q. (2010) · The Lancet Neurology · doi:10.1016/s1474-4422(09)70299-6 · Cited by 4,806
GREAT improves functional interpretation of cis-regulatory regions
McLean, C. Y., Bristor, D., Hiller, M., Clarke, S. L., Schaar, B. T., Lowe, C. B., Wenger, A. M., & Bejerano, G. (2010) · Nature Biotechnology · doi:10.1038/nbt.1630 · Cited by 4,502
Blennow, K., de Leon, M. J., & Zetterberg, H. (2006) · The Lancet · doi:10.1016/s0140-6736(06)69113-7 · Cited by 3,134
Hox genes in vertebrate development
Krumlauf, R. K. (1994) · Cell · doi:10.1016/0092-8674(94)90290-9 · Cited by 2,079
Chen, Y. A., Lemire, M., Choufani, S., Butcher, D. T., Grafodatskaya, D., Zanke, B. W., Gallinger, S., Hudson, T. J., & Weksberg, R. (2013) · Epigenetics · doi:10.4161/epi.23470 · Cited by 1,547
Schwarzer, G., Carpenter, J. R., & Rücker, G. (2015) · Use R! · doi:10.1007/978-3-319-21416-0 · Cited by 1,230
A data-driven approach to preprocessing Illumina 450K methylation array data
Pidsley, R., Y Wong, C. C., Volta, M., Lunnon, K., Mill, J., & Schalkwyk, L. C. (2013) · BMC Genomics · doi:10.1186/1471-2164-14-293 · Cited by 1,143
Self-citationAlzheimer's disease: early alterations in brain DNA methylation at ANK1, BIN1, RHBDF2 and other loci
De Jager, P. L., Srivastava, G., Lunnon, K., Burgess, J., Schalkwyk, L. C., Yu, L., Eaton, M. L., Keenan, B. T., Ernst, J., McCabe, C., et al. (2014) · Nature Neuroscience · doi:10.1038/nn.3786 · Cited by 956 · cited 9×
“Although one previous study had demonstrated differential methylation at a single CpG within the HOXA gene cluster [7] and another identified a DMR spanning seven CpG sites [6], this represents the first study to illustrate that hypermethylation in this region extends to 208 DMPs, spanning approximately 48.”
BackgroundMethodInfluentialSelf-citation
Cited by
Sorted by citations
Gasparoni, G., Bultmann, S., Lutsik, P., Kraus, T. F. J., Sordon, S., Vlcek, J., Dietinger, V., Steinmaurer, M., Haider, M., Mulholland, C. B., et al. (2018) · Epigenetics & Chromatin · doi:10.1186/s13072-018-0211-3 · Cited by 229
Gene–environment interactions in Alzheimer disease: the emerging role of epigenetics
Migliore, L., & Coppedè, F. (2022) · Nature Reviews Neurology · doi:10.1038/s41582-022-00714-w · Cited by 217
Recalibrating the epigenetic clock: implications for assessing biological age in the human cortex
Shireby, G. L., Davies, J. P., Francis, P. T., Burrage, J., Walker, E., Neilson, G., Dahir, A., Thomas, A. J., Love, S., Smith, R. G., et al. (2020) · Brain · doi:10.1093/brain/awaa334 · Cited by 194
Self-citationPsychosis in Alzheimer disease—mechanisms, genetics and therapeutic opportunities
Ismail, Z., Creese, B., Aarsland, D., Kales, H. C., Lyketsos, C. G., Sweet, R. A., & Ballard, C. (2022) · Nature Reviews Neurology · doi:10.1038/s41582-021-00597-3 · Cited by 189
Park, C., Ha, J., & Park, S. (2020) · Expert Systems with Applications · doi:10.1016/j.eswa.2019.112873 · Cited by 184
Epigenetics of Alzheimer’s Disease
Perković, M. N., Paska, A. V., Konjevod, M., Kouter, K., Štrac, D. Š., Erjavec, G. N., & Pivac, N. (2021) · Biomolecules · doi:10.3390/biom11020195 · Cited by 192
Smith, R. G., Pishva, E., Shireby, G. L., Smith, A. R., Roubroeks, J. A. Y., Hannon, E. J., Wheildon, G., Mastroeni, D., Gasparoni, G., Riemenschneider, M. J., et al. (2021) · Nature Communications · doi:10.1038/s41467-021-23243-4 · Cited by 176
Self-citationThe Epigenetics of Alzheimer’s Disease: Factors and Therapeutic Implications
Liu, X., Jiao, B., & Shen, L. H. (2018) · Frontiers in Genetics · doi:10.3389/fgene.2018.00579 · Cited by 153
Zhang, L., Silva, T. C., Young, J. I., Gomez, L., Schmidt, M. A., Hamilton-Nelson, K. L., Kunkle, B. W., Chen, X., Martin, E. R., & Wang, L. (2020) · Nature Communications · doi:10.1038/s41467-020-19791-w · Cited by 139
Systematic underestimation of the epigenetic clock and age acceleration in older subjects
Khoury, L. Y. E., Gorrie-Stone, T. J., Smart, M., Hughes, A., Bao, Y., Andrayas, A., Burrage, J., Hannon, E. J., Meena Kumari, B., Mill, J. S., et al. (2019) · Genome biology · doi:10.1186/s13059-019-1810-4 · Cited by 135
Self-citationShireby, G. L., Dempster, E. L., Policicchio, S. S. S., Smith, R. G., Pishva, E., Chioza, B. A., Davies, J. P., Burrage, J., Lunnon, K., Vellame, D. S., et al. (2022) · Nature Communications · doi:10.1038/s41467-022-33394-7 · Cited by 127
Self-citationSmith, A. R., Smith, R. G., Pishva, E., Hannon, E. J., Roubroeks, J. A. Y., Burrage, J., Troakes, C., Al‐Sarraj, S., Sloan, C., Mill, J. S., et al. (2019) · Clinical Epigenetics · doi:10.1186/s13148-019-0636-y · Cited by 118
Self-citationSemick, S. A., Bharadwaj, R. A., Collado‐Torres, L., Tao, R., Shin, J. H., Deep‐Soboslay, A., Weiss, J. R., Weinberger, D. R., Hyde, T. M., Kleinman, J. E., et al. (2019) · Acta Neuropathologica · doi:10.1007/s00401-019-01966-5 · Cited by 121
Alzheimer’s Disorder: Epigenetic Connection and Associated Risk Factors
Sharma, V., Mehta, V., & Singh, T. G. (2020) · Current Neuropharmacology · doi:10.2174/1570159x18666200128125641 · Cited by 124
Pellegrini, C., Pirazzini, C., Sala, C., Sambati, L., Yusipov, I., Kalyakulina, A., Ravaioli, F., Kwiatkowska, K. M., Durso, D. F., Ivanchenko, M., et al. (2021) · Frontiers in Aging Neuroscience · doi:10.3389/fnagi.2021.639428 · Cited by 90
Roubroeks, J. A. Y., Smith, A. R., Smith, R. G., Pishva, E., Ibrahim, Z., Sattlecker, M., Hannon, E. J., Kłoszewska, I., Mecocci, P., Soininen, H., et al. (2020) · Neurobiology of Aging · doi:10.1016/j.neurobiolaging.2020.06.023 · Cited by 82
Self-citationEpigenetics in Alzheimer’s Disease
Gao, X., Chen, Q., Yao, H., Tan, J., Liu, Z., Zhou, Y., & Zou, Z. (2022) · Frontiers in Aging Neuroscience · doi:10.3389/fnagi.2022.911635 · Cited by 89
Li, Q. S., Sun, Y., & Wang, T. (2020) · Clinical Epigenetics · doi:10.1186/s13148-020-00944-z · Cited by 84
Kaur, G., Rathod, S. S. S., Ghoneim, M. M., Alshehri, S., Ahmad, J., Mishra, A., & Alhakamy, N. A. (2022) · Biology · doi:10.3390/biology11010090 · Cited by 79
Association of peripheral blood DNA methylation level with Alzheimer’s disease progression
Li, Q. S., Vasanthakumar, A., Davis, J. W., Idler, K. B., Nho, K. T., Waring, J. F., Saykin, A. J., & Initiative, A. D. N. (2021) · Clinical Epigenetics · doi:10.1186/s13148-021-01179-2 · Cited by 66
Epigenetic Modifications in Alzheimer’s Neuropathology and Therapeutics
Esposito, M. M., & Sherr, G. L. (2019) · Frontiers in Neuroscience · doi:10.3389/fnins.2019.00476 · Cited by 69
Li, Q. S., & Muynck, L. D. (2021) · Brain Behavior & Immunity - Health · doi:10.1016/j.bbih.2021.100227 · Cited by 60
Sex-specific DNA methylation differences in Alzheimer’s disease pathology
Zhang, L., Young, J. I., Gomez, L., Silva, T. C., Schmidt, M. A., Cai, J., Chen, X., Martin, E. R., & Wang, L. (2021) · Acta Neuropathologica Communications · doi:10.1186/s40478-021-01177-8 · Cited by 58
Cross-tissue analysis of blood and brain epigenome-wide association studies in Alzheimer’s disease
Silva, T. C., Young, J. I., Zhang, L., Gomez, L., Schmidt, M. A., Varma, A., Chen, X. S., Martin, E. R., & Wang, L. (2022) · Nature Communications · doi:10.1038/s41467-022-32475-x · Cited by 56
Belonwu, S., Li, Y., Bunis, D. G., Rao, A. A., Solsberg, C. W., Tang, A., Fragiadakis, G. K., Dubal, D. B., Oskotsky, T., & Sirota, M. (2021) · Molecular Neurobiology · doi:10.1007/s12035-021-02591-8 · Cited by 55
Wang, Y., Grant, O. A., Zhai, X., McDonald-Maier, K. D., & Schalkwyk, L. C. (2023) · GeroScience · doi:10.1007/s11357-023-00871-w · Cited by 55
Self-citationBettencourt, C., Foti, S. C., Miki, Y., Botía, J. A., Chatterjee, A., Warner, T. T., Révész, T., Lashley, T., Balázs, R., Viré, E. A., et al. (2019) · Acta Neuropathologica · doi:10.1007/s00401-019-02074-0 · Cited by 51
Huang, Y., Sun, X., Jiang, H., Yu, S., Robins, C., Armstrong, M. J., Li, R., Mei, Z. X., Shi, X., Gerasimov, E. S., et al. (2021) · Nature Communications · doi:10.1038/s41467-021-24710-8 · Cited by 53
Self-citationA dynamic recursive feature elimination framework (dRFE) to further refine a set of OMIC biomarkers
Han, Y., Huang, L., & Zhou, F. (2021) · Bioinformatics · doi:10.1093/bioinformatics/btab055 · Cited by 48
Early- and Late-Onset Alzheimer’s Disease: Two Sides of the Same Coin?
Valdez-Gaxiola, C. A., Rosales-Leycegui, F., Gaxiola-Rubio, A., Moreno-Ortíz, J. M., & Figuera, L. E. (2024) · Diseases · doi:10.3390/diseases12060110 · Cited by 55
DNA methylation variability in Alzheimer's disease
Huo, Z., Zhu, Y., Yu, L., Yang, J., Jager, P. L. D., Bennett, D. A., & Zhao, J. (2018) · Neurobiology of Aging · doi:10.1016/j.neurobiolaging.2018.12.003 · Cited by 45
Self-citationWei, S., Tao, J., Xu, J., Chen, X., Wang, Z., Zhang, N., Zuo, L., Jia, Z., Chen, H., Sun, H., et al. (2021) · Advanced Science · doi:10.1002/advs.202100727 · Cited by 46
Yang, X., Zhang, Y., Chen, Y., He, X., Qian, Y., Xu, S., Gao, C., Mo, C., Chen, S., & Xiao, Q. (2021) · Journal of Neuroinflammation · doi:10.1186/s12974-021-02267-z · Cited by 43
Pihlstrøm, L., Shireby, G. L., Geut, H., Henriksen, S. P., Rozemüller, A. J. M., Tunold, J., Hannon, E. J., Francis, P. T., Thomas, A. J., Love, S., et al. (2022) · Nature Communications · doi:10.1038/s41467-022-32619-z · Cited by 42
Self-citationAbnormal Homocysteine Metabolism: An Insight of Alzheimer’s Disease from DNA Methylation
Pi, T., Liu, B., & Jing-shan, S. (2020) · Behavioural Neurology · doi:10.1155/2020/8438602 · Cited by 43
The ROSMAP project: aging and neurodegenerative diseases through omic sciences
Pérez-González, A. P., García-Kroepfly, A. L., Pérez-Fuentes, K. A., García-Reyes, R. I., Solis-Roldan, F. F., Alba-González, J. A., Lemus, E. H., & de Anda‐Jáuregui, G. (2024) · Frontiers in Neuroinformatics · doi:10.3389/fninf.2024.1443865 · Cited by 49
Higham, J. P., Malik, B. R., Buhl, E., Dawson, J., Ogier, A. S., Lunnon, K., & Hodge, J. J. L. (2019) · Frontiers in Cellular Neuroscience · doi:10.3389/fncel.2019.00260 · Cited by 40
Self-citationZhang, W., Young, J. I., Gomez, L., Schmidt, M. A., Lukacsovich, D., Varma, A., Chen, X. S., Martin, E. R., & Wang, L. (2023) · Alzheimer s Research & Therapy · doi:10.1186/s13195-023-01216-7 · Cited by 38
Gomez, L., Odom, G., Young, J. I., Martin, E. R., Liu, L., Chen, X., Griswold, A. J., Gao, Z., Zhang, L., & Wang, L. (2019) · Nucleic Acids Research · doi:10.1093/nar/gkz590 · Cited by 37
Targeting epigenetics: A novel promise for Alzheimer’s disease treatment
Jeremic, D., Jiménez‐Díaz, L., & Navarro‐López, J. D. (2023) · Ageing Research Reviews · doi:10.1016/j.arr.2023.102003 · Cited by 36
Promoter DNA hypermethylation – Implications for Alzheimer’s disease
Liu, Y., Wang, M., Marcora, E. M., Zhang, B., & Goate, A. (2019) · Neuroscience Letters · doi:10.1016/j.neulet.2019.134403 · Cited by 37
Mitsumori, R., Sakaguchi, K., Shigemizu, D., Mori, T., Akiyama, S., Ozaki, K., Niida, S., & Shimoda, N. (2020) · PLOS ONE · doi:10.1371/journal.pone.0239196 · Cited by 34
Distinct sex-specific DNA methylation differences in Alzheimer’s disease
C. Silva, T., Zhang, W., Young, J. I., Gomez, L., Schmidt, M. A., Varma, A., Chen, X. S., Martin, E. R., & Wang, L. (2022) · Alzheimer's Research & Therapy · doi:10.1186/s13195-022-01070-z · Cited by 33
Utility of DNA Methylation as a Biomarker in Aging and Alzheimer’s Disease
Milicic, L., Porter, T., Vacher, M. A., & Laws, S. M. (2023) · Journal of Alzheimer s Disease Reports · doi:10.3233/adr-220109 · Cited by 36
Li, Z., Liang, D., Ebelt, S., Gearing, M., Kobor, M. S., Konwar, C., Maclsaac, J. L., Dever, K., Wingo, A. P., Levey, A. I., et al. (2024) · Alzheimer s & Dementia · doi:10.1002/alz.13650 · Cited by 33
Bowman, G. L., Dodge, H. H., Guyonnet, S., Zhou, N., Donohue, J., Bichsel, A., Schmitt, J. A. J., Hooper, C., Bartfai, T., Andrieu, S., et al. (2019) · Alzheimer s & Dementia Translational Research & Clinical Interventions · doi:10.1016/j.trci.2019.11.004 · Cited by 35
Liu, D., Wang, Y., Jing, H., Meng, Q., & Yang, J. (2020) · Neurobiology of Aging · doi:10.1016/j.neurobiolaging.2020.09.019 · Cited by 30
Abbas, Z., Tayara, H., & Chong, K. T. (2022) · Chemometrics and Intelligent Laboratory Systems · doi:10.1016/j.chemolab.2022.104536 · Cited by 32
Deep belief network-based approach for detecting Alzheimer's disease using the multi-omics data
Mahendran, N., & Vincent P M, D. R. (2023) · Computational and Structural Biotechnology Journal · doi:10.1016/j.csbj.2023.02.021 · Cited by 31
Alshamlan, H., Omar, S., Aljurayyad, R., & Alabduljabbar, R. (2023) · Diagnostics · doi:10.3390/diagnostics13101771 · Cited by 33
Wang, Q., Chen, Y., Readhead, B. P., Chen, K., Su, Y., Reiman, E. M., & Dudley, J. T. (2020) · Clinical Epigenetics · doi:10.1186/s13148-020-00984-5 · Cited by 32
Sommerer, Y., Dobričić, V., Schilling, M., Ohlei, O., Sabet, S. S., Wesse, T., Fuß, J., Franzenburg, S., Franke, A., Parkkinen, L., et al. (2023) · Alzheimer s Research & Therapy · doi:10.1186/s13195-023-01232-7 · Cited by 29
Psychosis-associated DNA methylomic variation in Alzheimer's disease cortex
Pishva, E., Creese, B., Smith, A. R., Viechtbauer, W., Proitsi, P., van den Hove, D., Ballard, C. G., Mill, J. S., & Lunnon, K. (2020) · Neurobiology of Aging · doi:10.1016/j.neurobiolaging.2020.01.001 · Cited by 33
Self-citationLi, H., Wang, F., Guo, X., & Jiang, Y. (2021) · Frontiers in Neuroscience · doi:10.3389/fnins.2021.682247 · Cited by 31
Nuclear dynamics and stress responses in Alzheimer’s disease
Iatrou, A., Clark, E. M., & Wang, Y. (2021) · Molecular Neurodegeneration · doi:10.1186/s13024-021-00489-6 · Cited by 31
Rabaneda‐Bueno, R., Mena‐Montes, B., Torres‐Castro, S., Torres‐Carrillo, N., & Torres-Carrillo, N. M. (2021) · Genes · doi:10.3390/genes12121959 · Cited by 30
Genome‐wide methylomic regulation of multiscale gene networks in Alzheimer's disease
Wang, E., Wang, M., Guo, L., Fullard, J. F., Micallef, C., Bendl, J. M., Song, W., Chen, M., Huang, Y., Li, Y., et al. (2023) · Alzheimer s & Dementia · doi:10.1002/alz.12969 · Cited by 32
Self-citationRydbirk, R., Folke, J., Busato, F., Roché, E., Chauhan, A. S., Løkkegaard, A., Hejl, A., Bode, M., Blaabjerg, M., Møller, M., et al. (2020) · Acta Neuropathologica Communications · doi:10.1186/s40478-020-00908-7 · Cited by 27
MethReg: estimating the regulatory potential of DNA methylation in gene transcription
Silva, T. C., Young, J. I., Martin, E. R., Chen, X. S., & Wang, L. (2022) · Nucleic Acids Research · doi:10.1093/nar/gkac030 · Cited by 26
Methylation differences in Alzheimer’s disease neuropathologic change in the aged human brain
Lang, A.-L., Eulalio, T. Y., Fox, E., Yakabi, K., Bukhari, S. A., Kawas, C. H., Corrada, M. M., Montgomery, S. B., Heppner, F. L., Capper, D., et al. (2022) · Acta Neuropathologica Communications · doi:10.1186/s40478-022-01470-0 · Cited by 26
Drzymalla, E., Crider, K. S., Wang, A., Marta, G., Khoury, M. J., & Rasooly, D. (2023) · Translational Psychiatry · doi:10.1038/s41398-023-02620-1 · Cited by 27
Neuroepigenetics and Alzheimer’s Disease: An Update
Zusso, M., Barbierato, M., Facci, L., Skaper, S. D., & Giusti, P. (2018) · Journal of Alzheimer s Disease · doi:10.3233/jad-180259 · Cited by 28
The Histone Modification H3K4me3 is Altered at the ANK1 Locus in Alzheimer's Disease Brain
Smith, A. R., Smith, R. G., Macdonald, R., Marzi, S. J., Burrage, J., Troakes, C., Al‐Sarraj, S., Mill, J. S., & Lunnon, K. (2021) · Future Science OA · doi:10.2144/fsoa-2020-0161 · Cited by 25
Self-citationZhu, K., Yang, T.-H. O., Dorie, V., Zheng, T., & Anastassiou, D. (2019) · Translational Psychiatry · doi:10.1038/s41398-018-0358-5 · Cited by 24
Epigenetic regulation in the pathophysiology of Lewy body dementia
Chouliaras, L., Kumar, G. S., Thomas, A. J., Lunnon, K., Chinnery, P. F., & O'Brien, J. T. (2020) · Progress in Neurobiology · doi:10.1016/j.pneurobio.2020.101822 · Cited by 24
Self-citationZhang, Z., Wiencke, J. K., Kelsey, K. T., Koestler, D. C., Molinaro, A. M., Pike, S. C., Karra, P., Christensen, B. C., & Salas, L. A. (2023) · Frontiers in Neuroscience · doi:10.3389/fnins.2023.1198243 · Cited by 23
Feature Selection of OMIC Data by Ensemble Swarm Intelligence Based Approaches
Yao, Z., Zhu, G., Too, J., Duan, M., & Wang, Z. (2022) · Frontiers in Genetics · doi:10.3389/fgene.2021.793629 · Cited by 21
Hannon, E. J., Dempster, E. L., Davies, J. P., Davies, J. P., Blake, G. E. T., Burrage, J., Policicchio, S. S. S., Franklin, A., Walker, E., Bamford, R. A., et al. (2024) · BMC Biology · doi:10.1186/s12915-024-01827-y · Cited by 25
Self-citationMacBean, L. F., Smith, A. R., & Lunnon, K. (2020) · Current Genetic Medicine Reports · doi:10.1007/s40142-020-00190-y · Cited by 21
Self-citationKim, J. P., Kim, B.-H., Bice, P. J., Seo, S. W., Bennett, D. A., Saykin, A. J., & Nho, K. T. (2022) · Biological Psychiatry · doi:10.1016/j.biopsych.2022.06.020 · Cited by 21
Self-citationGenome-wide association study in Alzheimer’s disease: a bibliometric and visualization analysis
Zhang, J., Wang, Y., Zhang, Y., & Yao, J. (2023) · Frontiers in Aging Neuroscience · doi:10.3389/fnagi.2023.1290657 · Cited by 22
The contribution of DNA methylation to the (dys)function of oligodendroglia in neurodegeneration
Fodder, K., de Silva, R., Warner, T. T., & Bettencourt, C. (2023) · Acta Neuropathologica Communications · doi:10.1186/s40478-023-01607-9 · Cited by 22
Association of Blood-Based DNA Methylation Markers With Late-Onset Alzheimer Disease
Acha, B., Corroza, J., de Gordoa, J. S., Cabello, C., Robles, M., Méndez-López, I., Macías, M., Zueco, S., Roldán, M., Urdánoz‐Casado, A., et al. (2023) · Neurology · doi:10.1212/wnl.0000000000207865 · Cited by 20
Minding the Gap: Exploring Neuroinflammatory and Microglial Sex Differences in Alzheimer’s Disease
Reed-Geaghan, E. G., & Keller-Norrell, P. R. (2023) · International Journal of Molecular Sciences · doi:10.3390/ijms242417377 · Cited by 19
Parikh, D., & Shah, M. (2024) · Biomedical Analysis · doi:10.1016/j.bioana.2024.05.005 · Cited by 20
Epilepsy Is Associated With Dysregulation of Long Non-coding RNAs in the Peripheral Blood
Hashemian, F., Ghafouri‐Fard, S., Arsang‐Jang, S., Mirzajani, S., Fallah, H., Habibabadi, J. M., Sayad, A., & Taheri, M. N. (2019) · Frontiers in Molecular Biosciences · doi:10.3389/fmolb.2019.00113 · Cited by 17
Schrauben, M., Dempster, E. L., & Lunnon, K. (2020) · Brain Pathology · doi:10.1111/bpa.12881 · Cited by 17
Self-citationSmith, R. G., Pishva, E., Kouhsar, M. P., Imm, J. L., Dobričić, V., Johannsen, P., Wittig, M., Franke, A., Vandenberghe, R. R., Schaeverbeke, J. M., et al. (2024) · Alzheimer s & Dementia · doi:10.1002/alz.14098 · Cited by 15
Self-citationMa, Y., Yu, L., Olah, M., Smith, R. G., Oatman, S. R., Allen, M., Pishva, E., Zhang, B., Menon, V., Ertekin‐Taner, N., et al. (2021) · Alzheimer s & Dementia · doi:10.1002/alz.12425 · Cited by 14
Self-citationDNA methylation: The epigenetic mechanism of Alzheimer's disease
Qin, H., Liu, J., Fang, C., Deng, Y., & Zhang, Y. (2023) · Ibrain · doi:10.1002/ibra.12121 · Cited by 16
Epigenome‐wide association studies in Alzheimer’s disease; achievements and challenges
van den Hove, D., Riemens, R. J. M., Koulousakis, P., & Pishva, E. (2020) · Brain Pathology · doi:10.1111/bpa.12880 · Cited by 17
Han, Y., Huang, L., & Zhou, F. (2021) · Genes · doi:10.3390/genes12111814 · Cited by 16
Ruffini, N., Klingenberg, S., Heese, R., Schweiger, S., & Gerber, S. (2022) · Frontiers in Aging Neuroscience · doi:10.3389/fnagi.2022.866886 · Cited by 16
Smith, A. R., Wheildon, G., & Lunnon, K. (2020) · Neuropathology and Applied Neurobiology · doi:10.1111/nan.12650 · Cited by 14
Self-citationUnveiling DNA methylation in Alzheimer’s disease: a review of array-based human brain studies
Alves, V. C., Carro, E., & Figueiro‐Silva, J. (2024) · Neural Regeneration Research · doi:10.4103/1673-5374.393106 · Cited by 13
Blood DNA methylation signature for incident dementia: Evidence from longitudinal cohorts
Zhang, W., Young, J. I., Gomez, L., Schmidt, M. A., Lukacsovich, D., Kunkle, B. W., Chen, X. S., Martin, E. R., & Wang, L. (2025) · Alzheimer s & Dementia · doi:10.1002/alz.14496 · Cited by 14
Sommerer, Y., Dobričić, V., Schilling, M., Ohlei, O., Bartrés‐Faz, D., Cattaneo, G., Demuth, I., Düzel, S., Franzenburg, S., Fuß, J., et al. (2022) · Biomedicines · doi:10.3390/biomedicines10112798 · Cited by 13
Assessing DNA methylation detection for primary human tissue using Nanopore sequencingPreprint
Genner, R. M., Akeson, S., Meredith, M., Jerez, P. Á., Malik, L., Baker, B., Miano‐Burkhardt, A., CARD-long-read Team, Paten, B., Billingsley, K. J., et al. (2025) · Genome Research · doi:10.1101/gr.279159.124 · Cited by 13
Agarwal, D., Kumari, R., Ilyas, A., Tyagi, S., Kumar, R., & Poddar, N. K. (2021) · International Journal of Biological Macromolecules · doi:10.1016/j.ijbiomac.2021.10.026 · Cited by 12
Liquid Biopsy in Alzheimer’s Disease Patients Reveals Epigenetic Changes in the PRLHR Gene
Macías, M., Acha, B., Corroza, J., Urdánoz‐Casado, A., Roldán, M., Robles, M., de Gordoa, J. S., Erro, M. E., Jericó, I., Blanco‐Luquin, I., et al. (2023) · Cells · doi:10.3390/cells12232679 · Cited by 11
ADmeth: A Manually Curated Database for the Differential Methylation in Alzheimer's Disease
Peng, X., Zhang, W., Cui, W., Ding, B., Lyu, Q., & Wang, J. (2022) · IEEE Transactions on Computational Biology and Bioinformatics · doi:10.1109/tcbb.2022.3178087 · Cited by 12
Emerging roles for HOX proteins in synaptogenesis
Gofflot, F., & Lizen, B. (2018) · The International Journal of Developmental Biology · doi:10.1387/ijdb.180299fg · Cited by 12
Venkatesh, R., Cardone, K. M., Bradford, Y., Moore, A. K., Kumar, R., Moore, J. H., Shen, L., Kim, D., & Ritchie, M. D. (2025) · Alzheimer s & Dementia · doi:10.1002/alz.70886 · Cited by 12
Lv, L., Zhang, D., Hua, P., & Yang, S. (2020) · Life Sciences · doi:10.1016/j.lfs.2020.118760 · Cited by 11
High-dimensional generalized propensity score with application to omics data
Gao, Q., Zhang, Y., Liang, J., Sun, H., & Wang, T. (2021) · Briefings in Bioinformatics · doi:10.1093/bib/bbab331 · Cited by 10
Dunnet, M. J., Ortega‐Recalde, O., Waters, S. A., Weeks, R. J., Morison, I. M., & Hore, T. A. (2022) · Epigenetics Communications · doi:10.1186/s43682-022-00011-z · Cited by 11
Wu, S., Yang, F., Shan, C., Wang, B., Wang, W., Li, H., Yu, L., He, L., Li, X., Sun, L., et al. (2023) · Frontiers in Genetics · doi:10.3389/fgene.2023.1175864 · Cited by 10
Assessing methylation detection for primary human tissue using Nanopore sequencingPreprint
Genner, R. M., Akeson, S., Meredith, M., Jerez, P. Á., Malik, L., Baker, B., Miano‐Burkhardt, A., CARD-long-read Team, Paten, B., Billingsley, K. J., et al. (2024) · bioRxiv (Cold Spring Harbor Laboratory) · doi:10.1101/2024.02.29.581569 · Cited by 11
Lukacsovich, D., O’Shea, D. M., Huang, H., Zhang, W., Young, J. I., Chen, X. S., Dietrich, S., Kunkle, B. W., Martin, E. R., & Wang, L. (2024) · Database · doi:10.1093/database/baae061 · Cited by 9
Abir, A. R., Dip, S. A., & Zhang, L. (2025) · Briefings in Bioinformatics · doi:10.1093/bib/bbaf438 · Cited by 10
Metadata
- Authors
- Smith, R. G., Hannon, E., De Jager, P. L., Chibnik, L., Lott, S. J., Condliffe, D., Smith, A. R., Haroutunian, V., Troakes, C., Al‐Sarraj, S., Bennett, D. A., Powell, J., Lovestone, S., Schalkwyk, L., Mill, J., & Lunnon, K.
- Affiliations
- University of Exeter (GB)
- Program in Translational NeuroPsychiatric Genomics Departments of Neurology and Psychiatry Institute for the Neurosciences Brigham and Women's Hospital Boston MA USA
- Brigham and Women's Hospital (US)
- King's College London (GB)
- Queen Mary University of London (GB)
- James J. Peters VA Medical Center (US)
- Rush University Medical Center (US)
- Warneford Hospital (GB)
- University of Essex (GB)
- Corresponding author
- Mill, Jonathan
- Lunnon, Katie
- ORCID
- Venue
- Alzheimer's & Dementia
- Publisher
- Wiley
- Published
- 2018-03-14
- Volume
- 14
- Issue
- 12
- Pages
- 1580-1588
- ISSN
- 1552-5260 (ISSN-L)
- 1552-5279
- PMC
- PMC6438205
- OpenAlex
- W2789414284
- Cited by
- 184
- References
- 26
- Citations by year
- 2026: 13 · 2025: 20 · 2024: 22 · 2023: 28 · 2022: 26 · 2021: 27 · 2020: 26 · 2019: 15 · 2018: 7
- FWCI
- 7.56
- Type
- journal article
- Language
- en
- Open access
- green
- www.ncbi.nlm.nih.gov
- Licence
- Locations
- Alzheimer s & Dementia (publishedVersion)
- PubMed (publishedVersion)
- PubMed Central (acceptedVersion, cc-by-nc-nd)
- Open Access at Essex (University of Essex) (acceptedVersion)
- Figshare (submittedVersion, cc-by-nc-nd)
- Research Portal (King's College London) (submittedVersion, other-oa)
- Open Research Exeter (University of Exeter) (submittedVersion, cc-by-nc-nd)
- Royal Devon and Exeter Research Repository (Royal Devon and Exeter) (submittedVersion)
- Funders
- National Institutes of Health (R01 AG036039, AG02219, AG05138, MH064673, R01 AG036042, R01AG036836, R01 AG17917, R01 AG15819, R01 AG032990, R01 AG18023, RC2 AG036547, P30 AG10161, P50 AG016574, U01 ES017155, KL2 RR024151, K25 AG041906‐01)
- Alzheimer's Society (AS‐PG‐14‐038)
- Alzheimer's Association (NIRG‐14‐320878)
- BRACE
- Topics
- Life Sciences › Biochemistry, Genetics and Molecular Biology › Molecular Biology › Epigenetics and DNA Methylation
- Health Sciences › Medicine › Psychiatry and Mental health › Dementia and Cognitive Impairment Research
- Life Sciences › Neuroscience › Cellular and Molecular Neuroscience › Alzheimer's disease research and treatments
- Keywords
- Alzheimer's disease, DNA methylation
- MeSH terms
- Alzheimer Disease, Multigene Family, Temporal Lobe, Prefrontal Cortex, Homeodomain Proteins, CpG Islands, DNA Methylation, Genetic Predisposition to Disease, Epigenesis, Genetic, Genome-Wide Association Study
About these checks
Registry, retraction, Cites and statistics results are computed, not judged, with one exception: a printed reference that no index lists is read once by a model before it counts as a citation error. Claims are extracted by a model and kept only when their quote appears verbatim in the text; each cited source is then checked, with a model’s help, for whether it says what the claim relies on. Those verdicts can be wrong — read the claim’s quote and the cited source before relying on one.
Statistics and arithmetic are recomputed, not judged.
Confidence bands are shown only for fields calibrated on our annotated test set. None is calibrated yet, so no band is shown.
What counts as a claim ›How we measure confidence ›How we check this ›
Are you an author, or do you see a problem with this page? Request a review
