

The DOI matches its Crossref record; 137 of the 146 references it cites were found in a registry or an index.
The Liver Tumor Segmentation Benchmark (LiTS)
Open accessAbstract
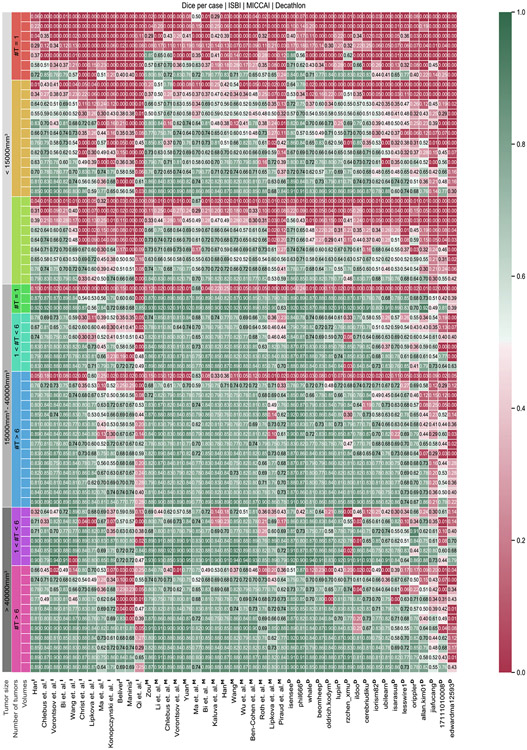
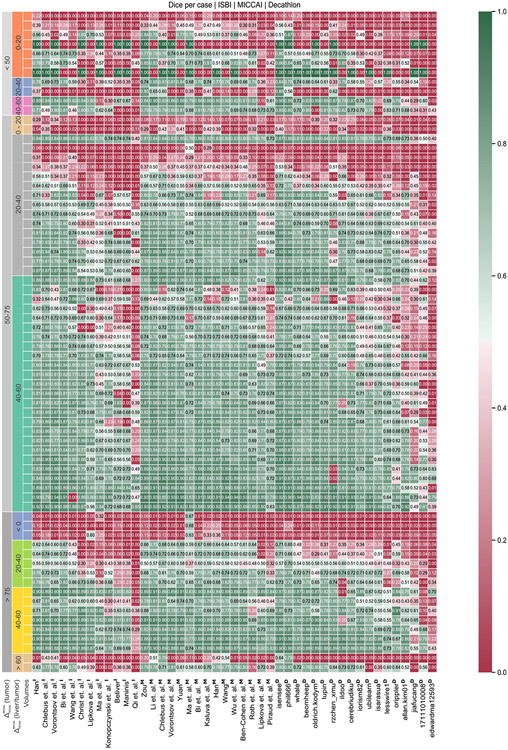
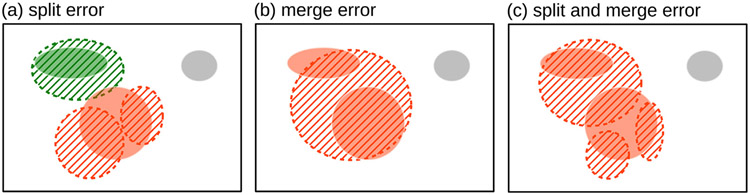
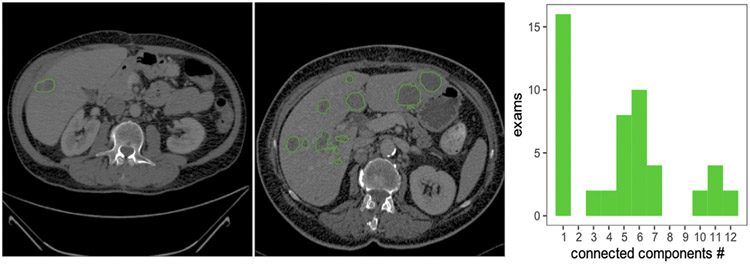
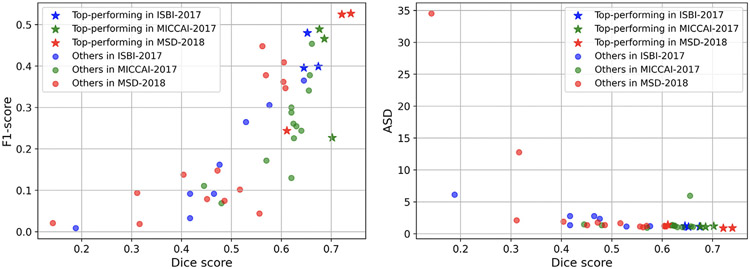
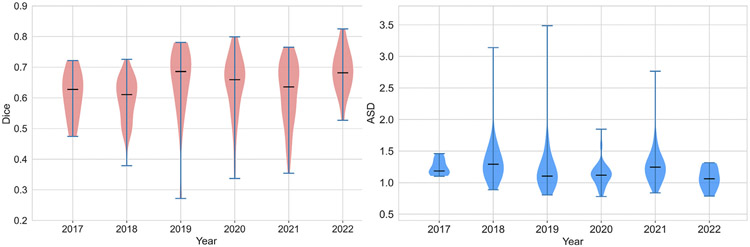
In this work, we report the set-up and results of the Liver Tumor Segmentation Benchmark (LiTS), which was organized in conjunction with the IEEE International Symposium on Biomedical Imaging (ISBI) 2017 and the International Conferences on Medical Image Computing and Computer-Assisted Intervention (MICCAI) 2017 and 2018. The image dataset is diverse and contains primary and secondary tumors with varied sizes and appearances with various lesion-to-background levels (hyper-/hypo-dense), created in collaboration with seven hospitals and research institutions. Seventy-five submitted liver and liver tumor segmentation algorithms were trained on a set of 131 computed tomography (CT) volumes and were tested on 70 unseen test images acquired from different patients. We found that not a single algorithm performed best for both liver and liver tumors in the three events. The best liver segmentation algorithm achieved a Dice score of 0.963, whereas, for tumor segmentation, the best algorithms achieved Dices scores of 0.674 (ISBI 2017), 0.702 (MICCAI 2017), and 0.739 (MICCAI 2018). Retrospectively, we performed additional analysis on liver tumor detection and revealed that not all top-performing segmentation algorithms worked well for tumor detection. The best liver tumor detection method achieved a lesion-wise recall of 0.458 (ISBI 2017), 0.515 (MICCAI 2017), and 0.554 (MICCAI 2018), indicating the need for further research. LiTS remains an active benchmark and resource for research, e.g., contributing the liver-related segmentation tasks in http://medicaldecathlon.com/. In addition, both data and online evaluation are accessible via https://competitions.codalab.org/competitions/17094.
Overview
The claims and statistics of this paper haven’t been checked yet.
Run the check — free, no account needed. It reads the open-access text and checks the sources it cites.
Integrity signals
Registry
Cites
Statistics
Figures
Verification
Claims the paper makes
The claims and statistics of this paper haven’t been checked yet.
Run the check — free, no account needed. It reads the open-access text and checks the sources it cites.
Claims other papers make about this one
Each is checked against this paper’s own text: does it say what the citing paper says it does?
The cited source says what the claim attributes to it.
In the citing paper
“different lesion appearances and annotation targets have been reported across tumor benchmarks [3,8,23]”
From Correction-aware interactive 3D tumor segmentation with sparse and revisable prompts (2026) · cites this paper as [3]
The cited source says what the claim attributes to it.
In the citing paper
“Tumor segmentation is less stable because lesions are not tied to a fixed anatomical shape or location and may be small, heterogeneous, or weakly contrasted [3,8,23].”
From Correction-aware interactive 3D tumor segmentation with sparse and revisable prompts (2026) · cites this paper as [3]
The check wasn’t confident either way, so it gives no verdict — never disputed.
In the citing paper
“The source of the OrganMNIST3D is the same as that of the Organ{A,C,S}MNIST. Instead of 2D images, we directly use the 3D bounding boxes and process the images into 28 × 28 × 28 to perform multi-class classification of 11 body organs.”
From MedMNIST v2 - A large-scale lightweight benchmark for 2D and 3D biomedical image classification (2023) · cites this paper as [30]
Experimental — accuracy not yet measured
Self-check
Percentages, sums and reported differences re-computed from the paper’s own numbers.
The self-check needs the paper’s full text.
Citations
Cites
U-Net: Convolutional Networks for Biomedical Image Segmentation
Ronneberger, O., Fischer, P., & Brox, T. (2015) · Lecture notes in computer science · doi:10.1007/978-3-319-24574-4_28 · Cited by 99,404
New response evaluation criteria in solid tumours: revised RECIST guideline (version 1.1)
Eisenhauer, E. A., Therasse, P., Bogaerts, J., Schwartz, L. H., Sargent, D., Ford, R., Dancey, J., Arbuck, S., Gwyther, S., Mooney, M., et al. (2009) · European Journal of Cancer · doi:10.1016/j.ejca.2008.10.026 · Cited by 29,534
Kass, M., Witkin, A., & Terzopoulos, D. (1988) · International Journal of Computer Vision · doi:10.1007/bf00133570 · Cited by 17,330
A survey on deep learning in medical image analysis
Litjens, G., Kooi, T., Bejnordi, B. E., Setio, A. A. A., Ciompi, F., Ghafoorian, M., van der Laak, J. A. W. M., van Ginneken, B., & Sánchez, C. I. (2017) · Medical Image Analysis · doi:10.1016/j.media.2017.07.005 · Cited by 15,332
Fronts propagating with curvature-dependent speed: Algorithms based on Hamilton-Jacobi formulations
Osher, S., & Sethian, J. A. (1988) · Journal of Computational Physics · doi:10.1016/0021-9991(88)90002-2 · Cited by 14,196
V-Net: Fully Convolutional Neural Networks for Volumetric Medical Image Segmentation
Milletari, F., Navab, N., & Ahmadi, S.-A. (2016) · 2016 Fourth International Conference on 3D Vision (3DV) · doi:10.1109/3dv.2016.79 · Cited by 11,931
Fully convolutional networks for semantic segmentation
Shelhamer, E., Long, J., & Darrell, T. (2017) · IEEE Transactions on Pattern Analysis and Machine Intelligence · doi:10.1109/tpami.2016.2572683 · Cited by 11,898
nnU-Net: a self-configuring method for deep learning-based biomedical image segmentation
Isensee, F., Jaeger, P. F., Kohl, S. A. A., Petersen, J., & Maier-Hein, K. H. (2021) · Nature Methods · doi:10.1038/s41592-020-01008-z · Cited by 10,477
Self-citationYushkevich, P. A., Piven, J., Hazlett, H. C., Smith, R. G., Ho, S., Gee, J. C., & Gerig, G. (2006) · NeuroImage · doi:10.1016/j.neuroimage.2006.01.015 · Cited by 8,868
Active Shape Models-Their Training and Application
Cootes, T. F., Taylor, C. J., Cooper, D. H., & Graham, J. (1995) · Computer Vision and Image Understanding · doi:10.1006/cviu.1995.1004 · Cited by 7,190
Research works printed but not linked: 5
- Ben-Dan, 2008, Liver tumor segmentation in CT images using probabilistic methods, vol. 41, 43
- Deng, X., Du, G., 2008. 3D segmentation in the clinic: A grand challenge II-liver tumor segmentation. In: MICCAI Workshop.
- Erickson, 2016, Radiology data from the cancer genome atlas liver hepatocellular carcinoma [TCGA-LIHC] collection, Cancer Imaging Arch.
- Hann, 2000, Diagnostic imaging approaches and relationship to hepatobiliary cancer staging and therapy, vol. 19, 94
- Heussel, 2007, Follow-up CT measurement of liver malignoma according to RECIST and WHO vs. volumetry, RoFo: Fortschr. Geb. Rontgenstr. Nuklearmed., 179, 958
Cited by
Sorted by citations
Items 301–400 of 1,004
Continual learning in medical image analysis: A survey
Wu, X., Xu, Z., & Tong, R. K. (2024) · Computers in Biology and Medicine · doi:10.1016/j.compbiomed.2024.109206 · Cited by 29
Kumar, K. N., Mohan, C. K., Cenkeramaddi, L. R., & Awasthi, N. (2024) · Artificial Intelligence in Medicine · doi:10.1016/j.artmed.2024.103024 · Cited by 24
Salimi, Y., Shiri, I., Mansouri, Z., & Zaidi, H. (2025) · Physica Medica · doi:10.1016/j.ejmp.2025.104911 · Cited by 20
Ghribi, F., & Hamdaoui, F. (2025) · The Visual Computer · doi:10.1007/s00371-025-04122-1 · Cited by 24
Olimov, B., Koh, S., & Kim, J. (2021) · IEEE Access · doi:10.1109/access.2021.3128607 · Cited by 20
Self-citationSS-3DCAPSNET: Self-Supervised 3d Capsule Networks for Medical Segmentation on Less Labeled Data
Tran, M., Ly, L., Hua, B., & Le, N. (2022) · IEEE International Symposium on Biomedical Imaging (ISBI) · doi:10.1109/isbi52829.2022.9761627 · Cited by 19
Context Label Learning: Improving Background Class Representations in Semantic Segmentation
Li, Z., Kamnitsas, K., Ouyang, C., Chen, C., & Glocker, B. (2023) · IEEE Transactions on Medical Imaging · doi:10.1109/tmi.2023.3242838 · Cited by 21
ETISTP: An Enhanced Model for Brain Tumor Identification and Survival Time Prediction
Hussain, S., Haider, S., Maqsood, S., Damaševičius, R., Maskeliūnas, R., & Khan, M. (2023) · Diagnostics · doi:10.3390/diagnostics13081456 · Cited by 20
Zhu, J., Liu, Z., Gao, W., & Fu, Y. (2023) · Biomedical Signal Processing and Control · doi:10.1016/j.bspc.2023.105660 · Cited by 20
Attention Connect Network for Liver Tumor Segmentation from CT and MRI Images
Shao, J., Luan, S., Ding, Y., Xue, X., Zhu, B., & Wei, W. (2024) · Technology in Cancer Research & Treatment · doi:10.1177/15330338231219366 · Cited by 20
Chen, J., Xia, Y., Yao, J., Yan, K., Zhang, J., Lü, L., Wang, F., Zhou, B., Qiu, M., Yu, Q., et al. (2023) · IEEE/CVF International Conference on Computer Vision (ICCV) · doi:10.1109/iccv51070.2023.01950 · Cited by 26
Self-citationPham, X. L., Luu, H. M., van Walsum, T., Mai, H. S., Klein, S., Le, N. H., & Duc, T. C. (2024) · Medical Image Analysis · doi:10.1016/j.media.2024.103212 · Cited by 20
Conquering Data Variations in Resolution: A Slice-Aware Multi-Branch Decoder Network
Wang, S., Cao, S., Chai, Z., Wei, D., Ma, K., Wang, L., & Zheng, Y. (2020) · IEEE Transactions on Medical Imaging · doi:10.1109/tmi.2020.3014433 · Cited by 20
Artificial intelligence in assessment of hepatocellular carcinoma treatment response
Spieler, B. M., Sabottke, C. F., Moawad, A. W., Gabr, A., Bashir, M. R., Gian, R. K., Yaghmai, V., Rozenberg, R., Gerena, M., Yacoub, J. H., et al. (2021) · Abdominal Radiology · doi:10.1007/s00261-021-03056-1 · Cited by 21
A Review of Advancements and Challenges in Liver Segmentation
Wei, D., Jiang, Y., Zhou, C., Wu, D., & Feng, X. (2024) · Journal of Imaging · doi:10.3390/jimaging10080202 · Cited by 22
Slama, A. B., Sahli, H., Amri, Y., & Labidi, S. (2025) · Intelligence-Based Medicine · doi:10.1016/j.ibmed.2025.100210 · Cited by 22
Deep learning-based segmentation of ultra-low-dose CT images using an optimized nnU-Net model
Salimi, Y., Mansouri, Z., Sun, C., Sanaat, A., Yazdanpanah, M., Shooli, H., Nkoulou, R. N., Boudabbous, S., & Zaidi, H. (2025) · La radiologia medica · doi:10.1007/s11547-025-01989-x · Cited by 19
Mukherjee, S., Antony, A., Patnam, N. G., Trivedi, K. H., Karbhari, A., Nagaraj, M., Murlidhar, M., & Goenka, A. H. (2025) · Scientific Reports · doi:10.1038/s41598-025-01802-9 · Cited by 19
Attention GhostUNet++: Enhanced Segmentation of Adipose Tissue and Liver in CT Images
Hayat, M., Aramvith, S., Bhattacharjee, S., & Ahmad, N. (2025) · Annual International Conference of the IEEE Engineering in Medicine and Biology Society (EMBC) · doi:10.1109/embc58623.2025.11254588 · Cited by 19
Radiya, K., Joakimsen, H. L., Mikalsen, K. Ø., Aahlin, E. K., Lindsetmo, R., & Mortensen, K. E. (2023) · European Radiology · doi:10.1007/s00330-023-09609-w · Cited by 21
Deep Learning Algorithms for Pancreas Segmentation from Radiology Scans
Zhang, Z., Yao, L., Keleş, E., Velichko, Y., & Bağcı, U. (2023) · Advances in Clinical Radiology · doi:10.1016/j.yacr.2023.05.001 · Cited by 22
Self-citationWu, H., Zhang, B., Li, Z., Qin, J., & Lee, T. (2023) · IEEE Transactions on Cybernetics · doi:10.1109/tcyb.2023.3291369 · Cited by 19
Velichko, Y., Gennaro, N., Karri, M., Antalek, M. D., & Bağcı, U. (2023) · Advances in Clinical Radiology · doi:10.1016/j.yacr.2023.06.001 · Cited by 19
Automatic Liver Cancer Detection Using Deep Convolution Neural Network
Napte, K. M., Mahajan, A., & Urooj, S. (2023) · IEEE Access · doi:10.1109/access.2023.3307640 · Cited by 19
Qi, H., Wang, W., Shi, Y., & Wang, X. (2024) · Biomedical Signal Processing and Control · doi:10.1016/j.bspc.2024.106397 · Cited by 19
Multimodal parallel attention network for medical image segmentation
Wang, Z., Wang, W., Li, N., Zhang, S., Chen, Q., & Jiang, Z. (2024) · Image and Vision Computing · doi:10.1016/j.imavis.2024.105069 · Cited by 21
Matsui, Y., Ueda, D., Fujita, S., Fushimi, Y., Tsuboyama, T., Kamagata, K., Ito, R., Yanagawa, M., Yamada, A., Kawamura, M., et al. (2024) · Japanese Journal of Radiology · doi:10.1007/s11604-024-01668-3 · Cited by 19
Joint Liver Lesion Segmentation and Classification via Transfer LearningPreprint
Heker, M., & Greenspan, H. K. (2020) · arXiv (Cornell University) · doi:10.48550/arxiv.2004.12352 · Cited by 19
Self-citationToward Reliable Medical Image Segmentation by Modeling Evidential Calibrated Uncertainty
Zou, K., Chen, Y., Huang, L., Zhou, N., Yuan, X., Shen, X., Wang, M., Goh, R. S. M., Liu, Y., Tham, Y. C., et al. (2025) · IEEE Transactions on Cybernetics · doi:10.1109/tcyb.2025.3604432 · Cited by 24
FedCostWAvg: A New Averaging for Better Federated Learning
Mächler, L., Ezhov, I., Kofler, F., Shit, S., Paetzold, J. C., Loehr, T., Zimmer, C., Wiestler, B., & Menze, B. H. (2022) · Lecture notes in computer science · doi:10.1007/978-3-031-09002-8_34 · Cited by 18
Self-citationAn improved 3D KiU-Net for segmentation of liver tumor
Chen, G., Li, Z., Wang, J., Wang, J., Du, S., Zhou, J., Shi, J., & Zhou, Y. (2023) · Computers in Biology and Medicine · doi:10.1016/j.compbiomed.2023.107006 · Cited by 18
Wen, W., Yuan, Z., Qi, S., Zhang, Y., & Fang, Y. (2023) · IEEE Transactions on Multimedia · doi:10.1109/tmm.2023.3339588 · Cited by 18
LesionMix: A Lesion-Level Data Augmentation Method for Medical Image Segmentation
Basaran, B. D., Zhang, W., Qiao, M., Kainz, B., Matthews, P. M., & Bai, W. (2024) · Lecture notes in computer science · doi:10.1007/978-3-031-58171-7_8 · Cited by 22
Comprehensive multi-phase 3D contrast-enhanced CT imaging for primary liver cancer
Luo, J., Wan, X., Du, J., Liu, L., Zhao, L., Peng, X., Wu, M., Huang, S., & Nie, X. (2025) · Scientific Data · doi:10.1038/s41597-025-05125-2 · Cited by 18
ResTransUNet: A hybrid CNN-transformer approach for liver and tumor segmentation in CT images
Anwar, A. S., Amin, K., Hadhoud, M. M., & Ibrahim, M. (2025) · Computers in Biology and Medicine · doi:10.1016/j.compbiomed.2025.110048 · Cited by 17
Tang, F., Yao, Q., Ma, W., Wu, C., Jiang, Z., & Zhou, S. K. (2025) · Medical Image Analysis · doi:10.1016/j.media.2025.103770 · Cited by 17
Evaluation of Preprocessing Techniques for U-Net Based Automated Liver Segmentation
Islam, M., Khan, K. N., & Khan, M. S. (2021) · doi:10.1109/icai52203.2021.9445204 · Cited by 22
Gottlich, H. C., Gregory, A., Sharma, V., Khanna, A., Moustafa, A. U., Lohse, C. M., Potretzke, T. A., Korfiatis, P. D., Potretzke, A. M., Đenić, A., et al. (2023) · Journal of Imaging Informatics in Medicine · doi:10.1007/s10278-023-00804-1 · Cited by 17
MFA-Net: Multiple Feature Association Network for medical image segmentation
Li, Z., Zhang, N., Gong, H., Qiu, R., & Zhang, W. (2023) · Computers in Biology and Medicine · doi:10.1016/j.compbiomed.2023.106834 · Cited by 21
Slice-Fusion: Reducing False Positives in Liver Tumor Detection for Mask R-CNN
Tu, D.-Y., Lin, P., Chou, H., Shen, M., & Hsieh, S. (2023) · IEEE Transactions on Computational Biology and Bioinformatics · doi:10.1109/tcbb.2023.3265394 · Cited by 17
A deep learning approach for liver cancer detection in CT scans
Hameed, U., Rehman, M. U., Rehman, A. U., Damaševičius, R., Sattar, A., & Saba, T. (2023) · Computer Methods in Biomechanics and Biomedical Engineering Imaging & Visualization · doi:10.1080/21681163.2023.2280558 · Cited by 17
GAN-Driven Liver Tumor Segmentation: Enhancing Accuracy in Biomedical Imaging
Biswas, A., Maity, S. P., Banik, R., Bhattacharya, P., & Debbarma, J. (2024) · SN Computer Science · doi:10.1007/s42979-024-02991-2 · Cited by 17
Huang, S., Nie, X., Pu, K., Wan, X., & Luo, J. (2024) · Journal of Cancer Research and Clinical Oncology · doi:10.1007/s00432-024-05977-y · Cited by 20
Huang, Z., Deng, Z., Jin, Y., Wang, H., Su, Y., Li, T., Sun, H., Cheng, J., Chen, J., He, J., et al. (2025) · Medical Image Analysis · doi:10.1016/j.media.2025.103499 · Cited by 17
Мелдо, А. А., Utkin, L. V., & Трофимова, Т. Н. (2020) · Diagnostic radiology and radiotherapy · doi:10.22328/2079-5343-2020-11-1-9-17 · Cited by 22
Ultra-Lightweight Network for Medical Image Segmentation Inspired by Bio-Visual Interaction
Cai, Z., Fan, Y., Zhu, M., & Fang, T. (2024) · IEEE Transactions on Circuits and Systems for Video Technology · doi:10.1109/tcsvt.2024.3507383 · Cited by 21
Shan, R., Pei, C., Fan, Q., Liu, J., Wang, D., Yang, S., & Wang, X. (2025) · BMC Cancer · doi:10.1186/s12885-025-13529-x · Cited by 16
LA-ResUNet: Attention-based network for longitudinal liver tumor segmentation from CT images
Jin, R., Tang, H.-Y., Yang, Q., & Chen, W. (2025) · Computerized Medical Imaging and Graphics · doi:10.1016/j.compmedimag.2025.102536 · Cited by 16
Paolucci, I., Silva, J. A. M., Lin, Y., Shieh, A., Ierardi, A. M., Caraffiello, G., Gazzera, C., Jones, A. K., Fonio, P., Bale, R. J., et al. (2025) · Radiology Imaging Cancer · doi:10.1148/rycan.240293 · Cited by 16
A Review of Non-Fully Supervised Deep Learning for Medical Image Segmentation
Zhang, X., Wang, J., Wei, J., Yuan, X., & Wu, M. (2025) · Information · doi:10.3390/info16060433 · Cited by 16
Li, C., Mao, Y., Guo, Y., Li, J., & Wang, Y. (2022) · Computer Methods and Programs in Biomedicine · doi:10.1016/j.cmpb.2022.106887 · Cited by 16
Self-citationLearning multi-organ segmentation via partial- and mutual-prior from single-organ datasets
Lian, S., Li, L., Luo, Z., Zhong, Z., Wang, B., & Li, S. (2022) · Biomedical Signal Processing and Control · doi:10.1016/j.bspc.2022.104339 · Cited by 16
Deep Learning for Image Segmentation: A Focus on Medical Imaging
Khalifa, A. F., & Badr, E. (2023) · Computers, materials & continua/Computers, materials & continua (Print) · doi:10.32604/cmc.2023.035888 · Cited by 17
Liu, J., Yan, Z., Zhou, C., Shao, L., Han, Y., & Song, Y. (2023) · Mathematical Biosciences & Engineering · doi:10.3934/mbe.2023336 · Cited by 16
Exploring Generalizable Distillation for Efficient Medical Image Segmentation
Qi, X., Wu, Z., Zou, W., Ren, M., Gao, Y., Sun, M., Zhang, S., Shan, C., & Sun, Z. (2024) · IEEE Journal of Biomedical and Health Informatics · doi:10.1109/jbhi.2024.3385098 · Cited by 18
Self-citationMedghalchi, S., Kortmann, J., Lee, S.-H., Karimi, E., Kerzel, U., & Korte‐Kerzel, S. (2024) · Materials & Design · doi:10.1016/j.matdes.2024.113031 · Cited by 16
Hering, A., Westphal, M., Gerken, A., Almansour, H., Maurer, M., Geisler, B., Kohlbrandt, T., Eigentler, T., Amaral, T., Leßmann, N., et al. (2024) · International Journal of Computer Assisted Radiology and Surgery · doi:10.1007/s11548-024-03181-4 · Cited by 16
Self-citationCamouflaged Object Detection via location-awareness and feature fusion
Ge, Y., Zhong, Y., Ren, J., He, M., Bi, H., & Zhang, Q. (2024) · Image and Vision Computing · doi:10.1016/j.imavis.2024.105339 · Cited by 16
Volumetric medical image segmentation via fully 3D adaptation of Segment Anything Model
Lin, H., Zou, J., Deng, S., Wong, K. P., Avilés-Rivero, A. I., Fan, Y., Lee, A. P., Hu, X., & Qin, J. (2024) · Journal of Applied Biomedicine · doi:10.1016/j.bbe.2024.11.001 · Cited by 16
Self-citationHyper-Convolution Networks for Biomedical Image Segmentation
Ma, T., Dalca, A. V., & Sabuncu, M. R. (2022) · IEEE Winter Conference on Applications of Computer Vision · doi:10.1109/wacv51458.2022.00205 · Cited by 16
Lee, S., Kim, E., Bae, J. S., Kim, J. H., & Yoon, S. (2021) · IEEE Transactions on Emerging Topics in Computational Intelligence · doi:10.1109/tetci.2021.3132382 · Cited by 16
Self-citationA generalist foundation model and database for open-world medical image segmentation
Zhang, S., Zhang, Q., Zhang, S., Liu, X., Yue, J., Lu, M., Xu, H., Cao, J., Wei, X., Cao, J., et al. (2025) · Nature Biomedical Engineering · doi:10.1038/s41551-025-01497-3 · Cited by 22
A Systematic Review of U‐Net Optimizations: Advancing Tumour Segmentation in Medical Imaging
Abueed, O., Wang, Y., & Khasawneh, M. T. (2025) · IET Image Processing · doi:10.1049/ipr2.70203 · Cited by 16
3DConvCaps: 3DUnet with Convolutional Capsule Encoder for Medical Image Segmentation
Tran, M., Vo-Ho, V.-K., & Le, N. (2022) · Proceedings - International Conference on Pattern Recognition/Proceedings/International Conference on Pattern Recognition · doi:10.1109/icpr56361.2022.9956588 · Cited by 15
Edge-guided multi-scale adaptive feature fusion network for liver tumor segmentation
Zhang, T., Liu, Y., Zhao, Q., Xue, G., & Shen, H. (2024) · Scientific Reports · doi:10.1038/s41598-024-79379-y · Cited by 15
Dumachi, A. I., & Buiu, C. (2024) · Electronics · doi:10.3390/electronics13234697 · Cited by 15
Sattari, M. A., Zonouri, S. A., Salimi, A., Izadi, S., Rezaei, A. R., Ghezelbash, Z., Hayati, M., Seifi, M., & Ekhteraei, M. (2025) · Scientific Reports · doi:10.1038/s41598-025-92423-9 · Cited by 15
Cao, X., Guo, X., Yang, G., Chen, Q., & Dong, H. (2025) · Expert Systems with Applications · doi:10.1016/j.eswa.2025.127223 · Cited by 15
Multiple objective planning for thermal ablation of liver tumors
Liang, L., Cool, D. W., Kakani, N. K., Wang, G., Ding, H., & Fenster, A. (2020) · International Journal of Computer Assisted Radiology and Surgery · doi:10.1007/s11548-020-02252-6 · Cited by 15
Yang, C.-J., Wang, C., Fang, Y.-H. D., Wang, J., Su, F., Tsai, H., Lin, Y., Tsai, H., & Yeh, L. (2021) · PLoS ONE · doi:10.1371/journal.pone.0255605 · Cited by 15
Self-citationData enhancement based on M2-Unet for liver segmentation in Computed Tomography
Kong, Z., Zhang, M., Zhu, W., Yang, Y., Wang, T., & Zhang, B. (2022) · Biomedical Signal Processing and Control · doi:10.1016/j.bspc.2022.104032 · Cited by 15
Evaluating the Robustness of Self-Supervised Learning in Medical ImagingPreprint
Navarro, F., Watanabe, C., Shit, S., Sekuboyina, A., Peeken, J. C., Combs, S. E., & Menze, B. H. (2021) · Zurich Open Repository and Archive (University of Zurich) · doi:10.48550/arxiv.2105.06986 · Cited by 15
Self-citationLow-Rank Mixture-of-Experts for Continual Medical Image Segmentation
Chen, Q., Zhu, L., He, H., Zhang, X., Zeng, S., Ren, Q., & Lu, Y. (2024) · Lecture notes in computer science · doi:10.1007/978-3-031-72111-3_36 · Cited by 15
Göçeri, E. (2025) · Multimedia Tools and Applications · doi:10.1007/s11042-025-20760-y · Cited by 14
Sethia, K., Strakoš, P., Jaros, M., Kubíček, J., Roman, J., Penhaker, M., & Řı́ha, L. (2025) · Artificial Intelligence Review · doi:10.1007/s10462-025-11310-x · Cited by 19
Segment Anything Model 2: An Application to 2D and 3D Medical Images
Dong, H., Gu, H., Chen, Y., Yang, J., Chen, Y., & Mazurowski, M. A. (2026) · IEEE Transactions on Biomedical Engineering · doi:10.1109/tbme.2026.3653267 · Cited by 14
Zhou, Y., Jiang, H., Diao, Z., Tong, G., Luan, Q., Li, Y., & Li, X. (2023) · Computers in Biology and Medicine · doi:10.1016/j.compbiomed.2023.106538 · Cited by 14
Self-citationFedDK: Improving Cyclic Knowledge Distillation for Personalized Healthcare Federated Learning
Xu, Y., & Fan, H. (2023) · IEEE Access · doi:10.1109/access.2023.3294812 · Cited by 14
Liver Tumor Computed Tomography Image Segmentation Based on an Improved U-Net Model
Li, H., & Liang, B. (2023) · Applied Sciences · doi:10.3390/app132011283 · Cited by 14
Self-citationReFs: A hybrid pre-training paradigm for 3D medical image segmentation
Xie, Y., Zhang, J., Liu, L., Wang, H., Ye, Y., Verjans, J. W. H., & Xia, Y. (2023) · Medical Image Analysis · doi:10.1016/j.media.2023.103023 · Cited by 14
Quinton, F., Presles, B., Leclerc, S., Nodari, G., Lopez, O., Chevallier, O., Pellegrinelli, J., Vrigneaud, J., Popoff, R., Mériaudeau, F., et al. (2024) · Scientific Reports · doi:10.1038/s41598-024-53528-9 · Cited by 14
Multi-organ segmentation: a progressive exploration of learning paradigms under scarce annotation
Li, S., Wang, H., Meng, Y., Zhang, C., & Song, Z. (2024) · Physics in Medicine and Biology · doi:10.1088/1361-6560/ad33b5 · Cited by 15
Light&fast generative adversarial network for high-fidelity CT image synthesis of liver tumor
Zheng, Z., Wang, M., Fan, C., Wang, C., He, X., & He, X. (2024) · Computer Methods and Programs in Biomedicine · doi:10.1016/j.cmpb.2024.108252 · Cited by 14
Self-citationBi-Fusion of Structure and Deformation at Multi-Scale for Joint Segmentation and Registration
Zhang, J., Fu, T., Xiao, D., Fan, J., Song, H., Ai, D., & Yang, J. (2024) · IEEE Transactions on Image Processing · doi:10.1109/tip.2024.3407657 · Cited by 14
Segmentation of Liver Tumors by Monai and PyTorch in CT Images with Deep Learning Techniques
Muhammad, S. U., & Zhang, J. (2024) · Applied Sciences · doi:10.3390/app14125144 · Cited by 14
Panzade, P. P., Takabi, D., & Cai, Z. (2024) · Studies in computational intelligence · doi:10.1007/978-3-031-63592-2_15 · Cited by 14
Sun, L., Jiang, L., Wang, M., Wang, Z., & Xin, Y. (2024) · Sensors · doi:10.3390/s24175845 · Cited by 14
Chen, D., Gao, Z., Liu, J., Song, T., Li, L., & Tian, L. (2024) · Biomedical Signal Processing and Control · doi:10.1016/j.bspc.2024.106926 · Cited by 14
Delmoral, J. C., & Tavares, J. M. R. S. (2024) · Journal of Medical Systems · doi:10.1007/s10916-024-02115-6 · Cited by 14
Rethinking model prototyping through the MedMNIST+ dataset collection
Doerrich, S., Salvo, F. D., Brockmann, J., & Ledig, C. (2025) · Scientific Reports · doi:10.1038/s41598-025-92156-9 · Cited by 26
MAGAN: Mask Attention Generative Adversarial Network for Liver Tumor CT Image Synthesis
Liu, Y., Meng, L., & Zhong, J. (2021) · Journal of Healthcare Engineering · doi:10.1155/2021/6675259 · Cited by 14
AugMS-Net:Augmented multiscale network for small cervical tumor segmentation from MRI volumes
Lu, P., Fang, F., Zhang, H., Ling, L., & Hua, K. (2021) · Computers in Biology and Medicine · doi:10.1016/j.compbiomed.2021.104774 · Cited by 14
Qiang, L., Song, H., Zhang, W., Fan, J., Ai, D., Lin, Y., & Yang, J. (2021) · IEEE International Conference on Bioinformatics and Biomedicine (BIBM) · doi:10.1109/bibm52615.2021.9669823 · Cited by 14
Harmonizing Pathological and Normal Pixels for Pseudo-Healthy Synthesis
Zhang, Y., Lin, X., Zhuang, Y., Sun, L., Huang, Y., Ding, X., Wang, G., Yang, L., & Yu, Y. (2022) · IEEE Transactions on Medical Imaging · doi:10.1109/tmi.2022.3164095 · Cited by 15
SAROS: A dataset for whole-body region and organ segmentation in CT imaging
Koitka, S., Baldini, G., Kroll, L., van Landeghem, N., Pollok, O. B., Haubold, J., Pelka, O., Kim, M., Kleesiek, J., Nensa, F., et al. (2024) · Scientific Data · doi:10.1038/s41597-024-03337-6 · Cited by 14
Xu, C., Song, Y., Zhang, D., Bittencourt, L. K., Tirumani, S. H., & Li, S. (2023) · Medical Image Analysis · doi:10.1016/j.media.2023.102980 · Cited by 13
CTBANet: Convolution transformers and bidirectional attention for medical image segmentation
Luo, S., Pan, L., Jian, Y., Lu, Y., & Luo, S. (2024) · Alexandria Engineering Journal · doi:10.1016/j.aej.2024.01.018 · Cited by 13
Boundary-Sensitive Segmentation of Small Liver Lesions
Wei, T., Wang, Y., Zhang, Y., Wang, Y., & Zhao, L. (2024) · IEEE Journal of Biomedical and Health Informatics · doi:10.1109/jbhi.2024.3375609 · Cited by 13
Mask-Enhanced Segment Anything Model for Tumor Lesion Semantic Segmentation
Shi, H., Han, S., Huang, S., Liao, Y., Li, G., Kong, X., Zhu, H., Wang, X., & Liu, S. (2024) · Lecture notes in computer science · doi:10.1007/978-3-031-72111-3_38 · Cited by 13
Swin SMT: Global Sequential Modeling for Enhancing 3D Medical Image Segmentation
Płotka, S., Chrabaszcz, M., & Biecek, P. (2024) · Lecture notes in computer science · doi:10.1007/978-3-031-72111-3_65 · Cited by 13
Metadata
- Authors
- Bilic, P., Christ, P., Li, H. B., Vorontsov, E., Ben-Cohen, A., Kaissis, G., Szeskin, A., Jacobs, C., Mamani, G. E. H., Chartrand, G., Lohöfer, F., Holch, J. W., Sommer, W., Hofmann, F., Hostettler, A., Lev-Cohain, N., Drozdzal, M., Amitai, M. M., Vivanti, R., Sosna, J., Ezhov, I., Sekuboyina, A., Navarro, F., Kofler, F., Paetzold, J. C., Shit, S., Hu, X., Lipková, J., Rempfler, M., Piraud, M., Kirschke, J., Wiestler, B., Zhang, Z., Hülsemeyer, C., Beetz, M., Ettlinger, F., Antonelli, M., Bae, W., Bellver, M., Bi, L., Chen, H., Chlebus, G., Dam, E. B., Dou, Q., Fu, C.-W., Georgescu, B., Giró-i-Nieto, X., Gruen, F., Han, X., Heng, P.-A., Hesser, J., Moltz, J. H., Igel, C., Isensee, F., Jäger, P., Jia, F., Kaluva, K. C., Khened, M., Kim, I., Kim, J.-H., Kim, S., Kohl, S., Konopczynski, T., Kori, A., Krishnamurthi, G., Li, F., Li, H., Li, J., Li, X., Lowengrub, J., Ma, J., Maier-Hein, K., Maninis, K.-K., Meine, H., Merhof, D., Pai, A., Perslev, M., Petersen, J., Pont-Tuset, J., Qi, J., Qi, X., Rippel, O., Roth, K., Sarasua, I., Schenk, A., Shen, Z., Torres, J., Wachinger, C., Wang, C., Weninger, L., Wu, J., Xu, D., Yang, X., Yu, S. C.-H., Yuan, Y., Yue, M., Zhang, L., Cardoso, J., Bakas, S., Braren, R., Heinemann, V., Pal, C., Tang, A., Kadoury, S., Soler, L., van Ginneken, B., Greenspan, H., Joskowicz, L., & Menze, B.
- Affiliations
- Technical University of Munich (DE)
- Guangdong University of Foreign Studies (CN)
- Polytechnique Montréal (CA)
- Tel Aviv University (IL)
- TUM Klinikum (DE)
- Hebrew University of Jerusalem (IL)
- Radboud University Medical Center (NL)
- Université de Montréal (CA)
- German Cancer Research Center (DE)
- LMU Klinikum (DE)
- Institut de Recherche contre les Cancers de l’Appareil Digestif (FR)
- Rafael Advanced Defense Systems (Israel) (IL)
- Hadassah Medical Center (IL)
- University of Zurich (CH)
- Helmholtz Munich (DE)
- Chinese University of Hong Kong (HK)
- Brigham and Women's Hospital (US)
- ETH Zurich (CH)
- Nanjing Drum Tower Hospital (CN)
- King's College London (GB)
- Hong Kong University of Science and Technology (HK)
- Barcelona Supercomputing Center (ES)
- The University of Sydney (AU)
- University of Copenhagen (DK)
- Siemens Healthcare (United States) (US)
- Heidelberg University (DE)
- University of North Carolina at Chapel Hill (US)
- Fraunhofer Institute for Digital Medicine (DE)
- Chinese Academy of Sciences (CN)
- Indian Institute of Technology Madras (IN)
- Samsung Medical Center (KR)
- Kakao Brain (South Korea) (KR)
- University of California, Irvine (US)
- University of Bremen (DE)
- RWTH Aachen University (DE)
- University of Hong Kong (HK)
- University of Tübingen (DE)
- Medizinische Hochschule Hannover (DE)
- University of Illinois Urbana-Champaign (US)
- KTH Royal Institute of Technology (SE)
- Nvidia (United States) (US)
- Nanjing University (CN)
- Icahn School of Medicine at Mount Sinai (US)
- Corresponding author
- Li, Hongwei Bran
- Li, Hongchao
- ORCID
- Li, Hongwei Bran
- Vorontsov, Eugene
- Kaissis, Georgios
- Szeskin, Adi
- Jacobs, Colin
- Mamani, Gabriel Efrain Humpire
- Chartrand, Gabriel
- Lohöfer, Fabian
- Holch, Julian Walter
- Hostettler, Alexandre
- Drozdzal, Michal
- Amitai, Michal Marianne
- Sosna, Jacob
- Ezhov, Ivan
- Sekuboyina, Anjany
- Navarro, Fernando
- Kofler, Florian
- Paetzold, Johannes C.
- Shit, Suprosanna
- Hu, Xiaobin
- Lipková, Jana
- Piraud, Marie
- Kirschke, Jan
- Wiestler, Benedikt
- Zhang, Zhiheng
- Beetz, Marcel
- Antonelli, Michela
- Bae, Woong
- Bellver, Míriam
- Chen, Hao
- Chlebus, Grzegorz
- Dam, Erik B.
- Dou, Qi
- Fu, Chi-Wing
- Georgescu, Bogdan
- Giró-i-Nieto, Xavier
- Han, Xu
- Heng, Pheng-Ann
- Hesser, Jürgen
- Moltz, Jan Hendrik
- Igel, Christian
- Isensee, Fabian
- Jäger, Paul
- Jia, Fucang
- Kaluva, Krishna Chaitanya
- Khened, Mahendra
- Kim, Jae-Hun
- Kim, Sungwoong
- Kori, Avinash
- Krishnamurthi, Ganapathy
- Li, Fan
- Li, Hongchao
- Li, Junbo
- Li, Xiaomeng
- Lowengrub, John
- Ma, Jun
- Maier-Hein, Klaus
- Maninis, Kevis-Kokitsi
- Meine, Hans
- Merhof, Dorit
- Pai, Akshay
- Perslev, Mathias
- Petersen, Jens
- Pont-Tuset, Jordi
- Qi, Xiaojuan
- Rippel, Oliver
- Roth, Karsten
- Schenk, Andrea
- Shen, Zengming
- Torres, Jordi
- Wachinger, Christian
- Wang, Chunliang
- Weninger, Leon
- Xu, Daguang
- Yang, Xiaoping
- Yu, Simon Chun-Ho
- Yuan, Yading
- Zhang, Liping
- Bakas, Spyridon
- Braren, Rickmer
- Heinemann, Volker
- Pal, Christopher
- Tang, An
- Kadoury, Samuel
- van Ginneken, Bram
- Greenspan, Hayit
- Menze, Bjoern
- Venue
- Medical Image Analysis
- Publisher
- Elsevier BV
- Published
- 2023-02
- Volume
- 84
- Pages
- 102680
- ISSN
- 1361-8415 (ISSN-L)
- PMC
- PMC10631490
- OpenAlex
- W2910094941
- Cited by
- 1,412
- References
- 146
- Citations by year
- 2026: 259 · 2025: 337 · 2024: 311 · 2023: 195
- FWCI
- 77.21
- Type
- journal article
- Language
- en
- Open access
- hybrid
- doi.org
- Licence
- Locations
- Medical Image Analysis (publishedVersion, cc-by-nc-nd)
- PubMed (publishedVersion)
- Research at the University of Copenhagen (University of Copenhagen) (publishedVersion, cc-by-nc-nd)
- PubMed Central (acceptedVersion, cc-by-nc-nd)
- Zurich Open Repository and Archive (University of Zurich) (acceptedVersion, cc-by-nc-nd)
- arXiv (Cornell University) (submittedVersion, cc-by-nc-nd)
- Rare & Special e-Zone (The Hong Kong University of Science and Technology) (submittedVersion)
- Rare & Special e-Zone (The Hong Kong University of Science and Technology) (submittedVersion, cc-by-nc-sa)
- eScholarship (California Digital Library) (submittedVersion, cc-by-nc-nd)
- Radboud Repository (Radboud University) (submittedVersion, cc-by-nc-sa)
- IRIS eCampus Telematic University (Università degli Studi eCampus) (submittedVersion)
- mediaTUM (Technical University of Munich) (submittedVersion)
- Site cant be reached (submittedVersion, cc-by-nc-nd)
- Fraunhofer-Publica (Fraunhofer-Gesellschaft) (submittedVersion)
- PolyPublie (École Polytechnique de Montréal) (submittedVersion)
- PuSH - Publication Server of Helmholtz Zentrum München (submittedVersion, cc-by-nc-nd)
- UPCommons institutional repository (Universitat Politècnica de Catalunya) (submittedVersion, cc-by-nc-nd)
- Repository for Publications and Research Data (ETH Zurich) (submittedVersion, cc-by-nc-nd)
- Zurich Open Repository and Archive (University of Zurich) (submittedVersion, cc-by-nc-nd)
- Radboud Repository (Radboud University) (submittedVersion, other-oa)
- arXiv (Cornell University)
- ETH Zürich Research Collection
- Zurich Open Repository and Archive (University of Zurich)
- Funders
- Deutsche Forschungsgemeinschaft (SFB824, GSC81, subproject B12)
- Universität Zürich
- Fondation de l'Association des radiologistes du Québec (34939)
- National Institutes of Health (1s10od023495-01)
- Fonds de Recherche du Québec - Santé (34939, Junior 2)
- National Cancer Institute (U01CA242871)
- International Graduate School of Science and Engineering (GSC 81)
- Topics
- Physical Sciences › Computer Science › Computer Vision and Pattern Recognition › Medical Image Segmentation Techniques
- Physical Sciences › Computer Science › Computer Vision and Pattern Recognition › Brain Tumor Detection and Classification
- Health Sciences › Medicine › Radiology, Nuclear Medicine and Imaging › Radiomics and Machine Learning in Medical Imaging
- Keywords
- liver tumor segmentation, liver segmentation, liver cancer, computed tomography, segmentation benchmark, primary liver tumors, secondary liver tumors, lesion detection, medical image segmentation
- MeSH terms
- Algorithms, Humans, Image Processing, Computer-Assisted, Liver, Liver Neoplasms, Retrospective Studies, Benchmarking
About these checks
Registry, retraction, Cites and statistics results are computed, not judged, with one exception: a printed reference that no index lists is read once by a model before it counts as a citation error. Claims are extracted by a model and kept only when their quote appears verbatim in the text; each cited source is then checked, with a model’s help, for whether it says what the claim relies on. Those verdicts can be wrong — read the claim’s quote and the cited source before relying on one.
Statistics and arithmetic are recomputed, not judged.
Confidence bands are shown only for fields calibrated on our annotated test set. None is calibrated yet, so no band is shown.
What counts as a claim ›How we measure confidence ›How we check this ›
Are you an author, or do you see a problem with this page? Request a review
