

The DOI matches its Crossref record; 66 of the 66 references it cites were found in a registry or an index.
METTL1 Promotes let-7 MicroRNA Processing via m7G Methylation
Open accessAbstract
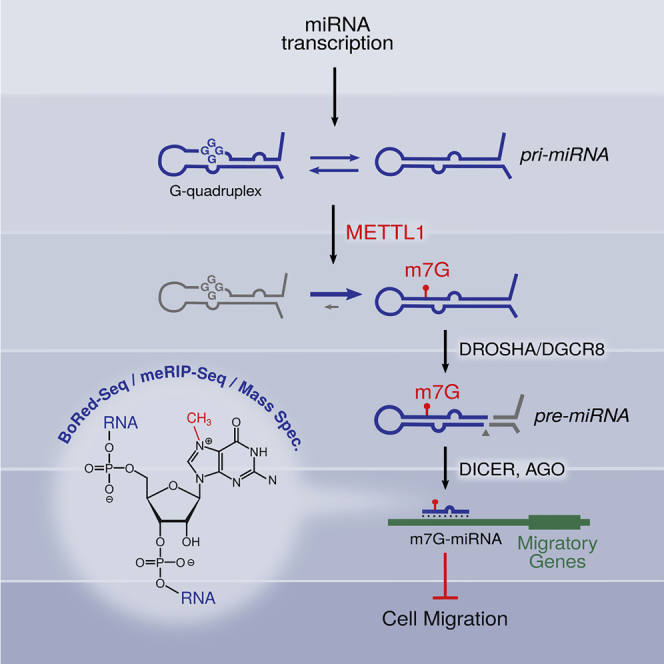
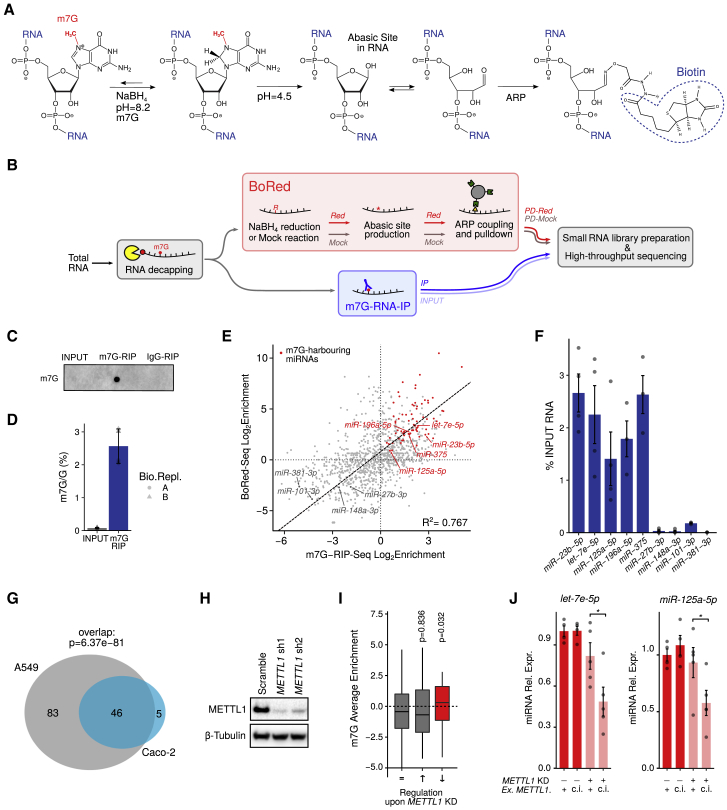
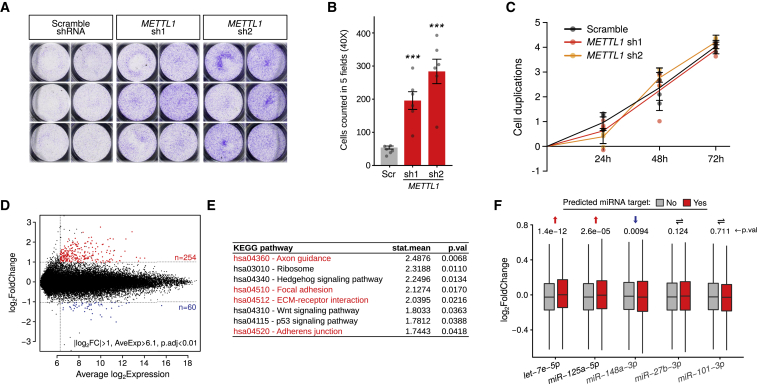
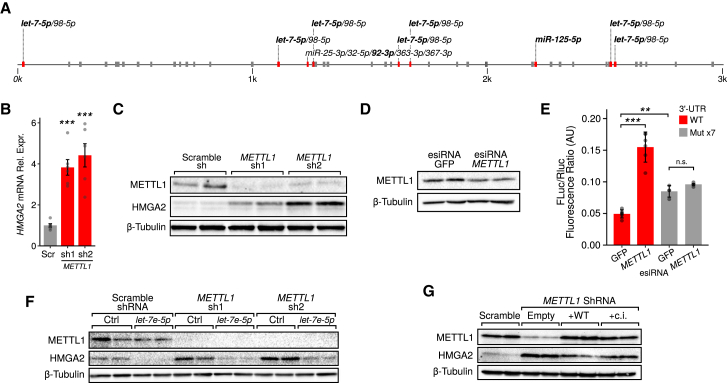
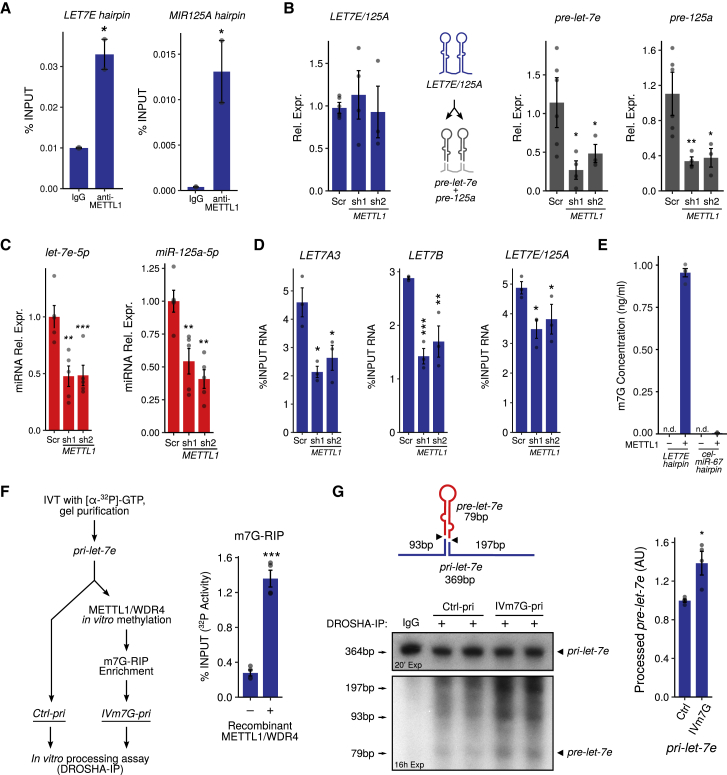
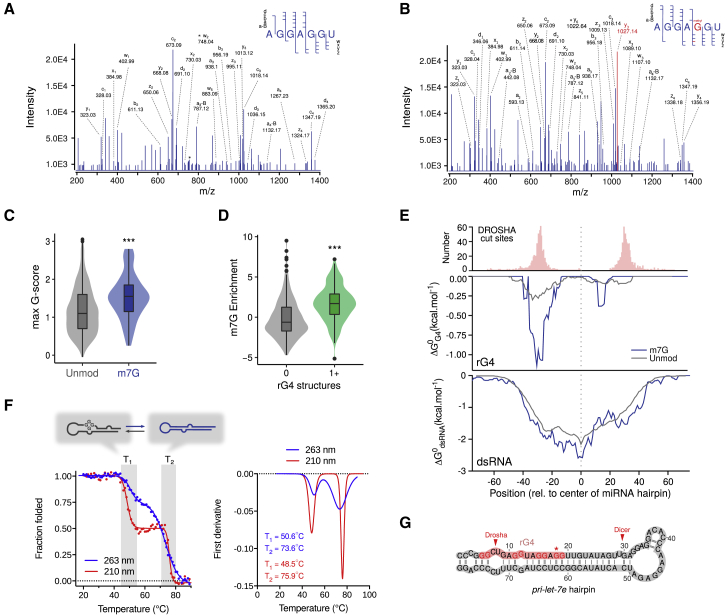
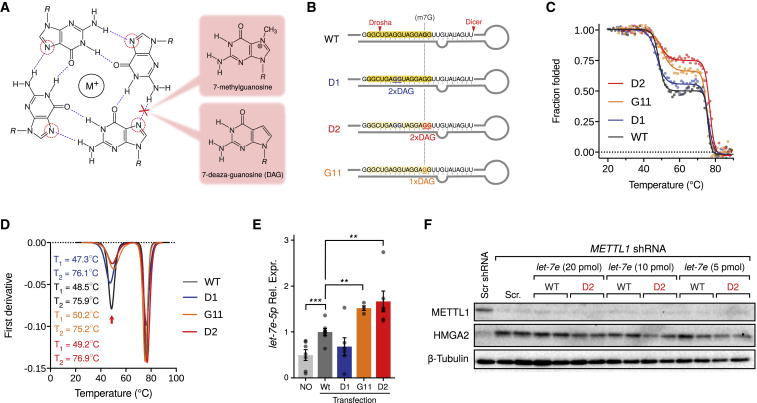
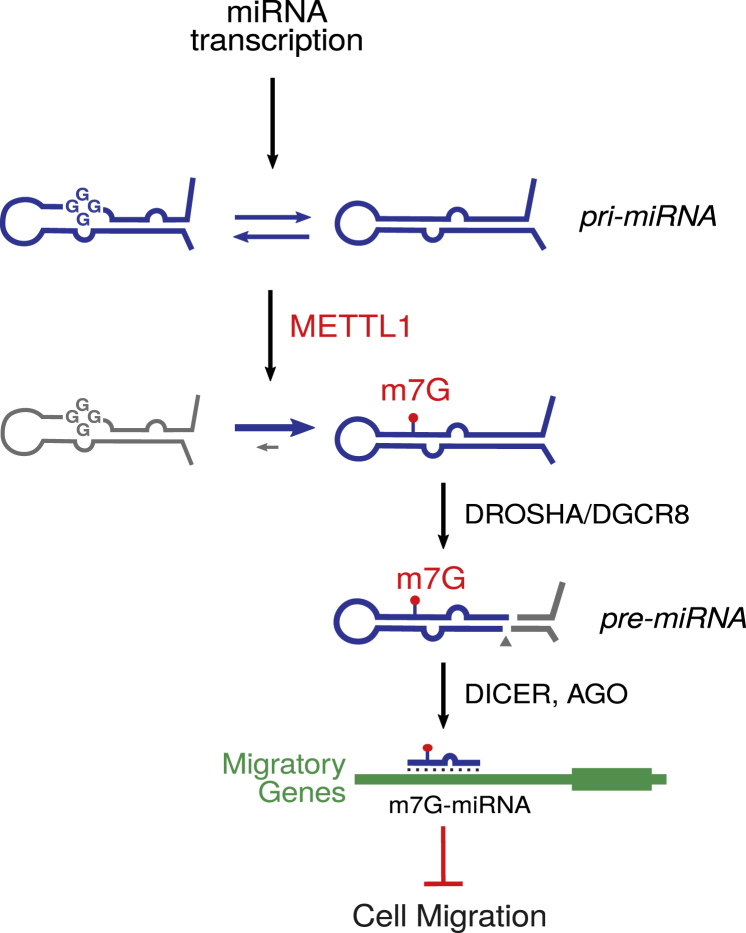
7-methylguanosine (m7G) is present at mRNA caps and at defined internal positions within tRNAs and rRNAs. However, its detection within low-abundance mRNAs and microRNAs (miRNAs) has been hampered by a lack of sensitive detection strategies. Here, we adapt a chemical reactivity assay to detect internal m7G in miRNAs. Using this technique (Borohydride Reduction sequencing [BoRed-seq]) alongside RNA immunoprecipitation, we identify m7G within a subset of miRNAs that inhibit cell migration. We show that the METTL1 methyltransferase mediates m7G methylation within miRNAs and that this enzyme regulates cell migration via its catalytic activity. Using refined mass spectrometry methods, we map m7G to a single guanosine within the let-7e-5p miRNA. We show that METTL1-mediated methylation augments let-7 miRNA processing by disrupting an inhibitory secondary structure within the primary miRNA transcript (pri-miRNA). These results identify METTL1-dependent N7-methylation of guanosine as a new RNA modification pathway that regulates miRNA structure, biogenesis, and cell migration.
Overview
The claims and statistics of this paper haven’t been checked yet.
Run the check — free, no account needed. It reads the open-access text and checks the sources it cites.
Integrity signals
Registry
Cites
Statistics
Figures
Verification
Claims the paper makes
The claims and statistics of this paper haven’t been checked yet.
Run the check — free, no account needed. It reads the open-access text and checks the sources it cites.
Claims other papers make about this one
Each is checked against this paper’s own text: does it say what the citing paper says it does?
In the citing paper
“Furthermore, the ubiquitin-like domain within the ligase promotes ubiquitination of histone H3, which recruits DNMT1 to newly replicated chromatin to ensure the inheritance of DNA methylation 42 .”
From The roles of DNA, RNA and histone methylation in ageing and cancer (2019) · cites this paper as [42]
Self-check
Percentages, sums and reported differences re-computed from the paper’s own numbers.
The self-check needs the paper’s full text.
Citations
Cites
Moderated estimation of fold change and dispersion for RNA-seq data with DESeq2
Love, M. I., Huber, W., & Anders, S. (2014) · Genome Biology · doi:10.1186/s13059-014-0550-8 · Cited by 95,106 · cited 2×
“G Addgene #12259 pMirGlo Promega Cat# E1330 Software and Algorithms Bioconductor https://www.bioconductor.org/ N/A DESeq2 Love et al., 2014 N/A FastQC https://github.com/s-andrews/ FastQC N/A featureCounts Liao et al., 2014 N/A G4Hunter Bedrat et al., 2016 N/A Gage Luo et al., 2009 N/A gbm Freund and Schapire, 1997 N/…”
InfluentialTrimmomatic: a flexible trimmer for Illumina sequence data
Bolger, A. M., Lohse, M., & Usadel, B. (2014) · Bioinformatics · doi:10.1093/bioinformatics/btu170 · Cited by 65,548
STAR: ultrafast universal RNA-seq aligner
Dobin, A., Davis, C. A., Schlesinger, F., Drenkow, J., Zaleski, C., Jha, S., Batut, P., Chaisson, M., & Gingeras, T. R. (2013) · Bioinformatics · doi:10.1093/bioinformatics/bts635 · Cited by 51,709
featureCounts: an efficient general purpose program for assigning sequence reads to genomic features
Liao, Y., Smyth, G. K., & Shi, W. (2014) · Bioinformatics · doi:10.1093/bioinformatics/btt656 · Cited by 27,219
A decision-theoretic generalization of on-line learning and an application to boosting
Freund, Y., & Schapire, R. E. (1997) · Journal of Computer and System Sciences · doi:10.1006/jcss.1997.1504 · Cited by 20,466
MicroRNAs: Target Recognition and Regulatory Functions
Bartel, D. P. (2009) · Cell · doi:10.1016/j.cell.2009.01.002 · Cited by 20,068 · cited 1×
“Their specificity is mediated by partial base pairing to sequences predominantly found in the 30 UTR of mRNAs (Bartel, 2009).”
The nuclear RNase III Drosha initiates microRNA processing
Lee, Y., Ahn, C., Han, J., Choi, H., Kim, J., Yim, J., Lee, J., Provost, P., Rådmark, O., Kim, S., et al. (2003) · Nature · doi:10.1038/nature01957 · Cited by 5,292
Lorenz, R., Bernhart, S. H., Höner zu Siederdissen, C., Tafer, H., Flamm, C., Stadler, P. F., & Hofacker, I. L. (2011) · Algorithms for Molecular Biology · doi:10.1186/1748-7188-6-26 · Cited by 5,098
miRBase: annotating high confidence microRNAs using deep sequencing data
Kozomara, A., & Griffiths-Jones, S. (2014) · Nucleic Acids Research · doi:10.1093/nar/gkt1181 · Cited by 5,073
Topology of the human and mouse m6A RNA methylomes revealed by m6A-seq
Dominissini, D., Moshitch-Moshkovitz, S., Schwartz, S., Salmon-Divon, M., Ungar, L., Osenberg, S., Cesarkas, K., Jacob-Hirsch, J., Amariglio, N., Kupiec, M., et al. (2012) · Nature · doi:10.1038/nature11112 · Cited by 4,884 · cited 2×
“, 2016], N6-methyladenosine [Dominissini et al., 2012], and 5-hydroxymethylcytosine [Delatte et al.”
Bartel, D. P. (2018) · Cell · doi:10.1016/j.cell.2018.03.006 · Cited by 3,751 · cited 1×
“…physiological and pathological processes. miRNA biosynthesis is complex and involves a multistep pathway that can be regulated at many levels (Bartel, 2018), including post-transcriptional modification of miRNA precursors (Alarcón et al., 2015; Xhemalce et al., 2012). miRNAs are synthesized…”
BackgroundDynamic RNA Modifications in Gene Expression Regulation
Roundtree, I. A., Evans, M., Pan, T., & He, C. (2017) · Cell · doi:10.1016/j.cell.2017.05.045 · Cited by 3,512
Regulation of mRNA Translation and Stability by microRNAs
Fabian, M. R., Sonenberg, N., & Filipowicz, W. (2010) · Annual Review of Biochemistry · doi:10.1146/annurev-biochem-060308-103103 · Cited by 3,214
MicroRNA maturation: stepwise processing and subcellular localization
Lee, Y., Jeon, K., Lee, J., Kim, S., & Kim, V. N. (2002) · The EMBO Journal · doi:10.1093/emboj/cdf476 · Cited by 2,572
Small silencing RNAs: an expanding universe
Ghildiyal, M., & Zamore, P. D. (2009) · Nature Reviews Genetics · doi:10.1038/nrg2504 · Cited by 2,416
TRBP recruits the Dicer complex to Ago2 for microRNA processing and gene silencing
Chendrimada, T. P., Gregory, R. I., Kumaraswamy, E., Norman, J. A., Cooch, N. S., Nishikura, K., & Shiekhattar, R. (2005) · Nature · doi:10.1038/nature03868 · Cited by 2,195
Normalization of cDNA microarray data
Smyth, G. K., & Speed, T. (2003) · Methods · doi:10.1016/s1046-2023(03)00155-5 · Cited by 1,871
Prevalence of quadruplexes in the human genome
Huppert, J. L., & Balasubramanian, S. (2005) · Nucleic Acids Research · doi:10.1093/nar/gki609 · Cited by 1,795
Self-citationCircular dichroism and conformational polymorphism of DNA
Kypr, J., Kejnovská, I., Renčiuk, D., & Vorlı́čková, M. (2009) · Nucleic Acids Research · doi:10.1093/nar/gkp026 · Cited by 1,782
The Encyclopedia of DNA elements (ENCODE): data portal update
Davis, C. A., Hitz, B. C., Sloan, C. A., Chan, E. T., Davidson, J. M., Gabdank, I., Hilton, J. A., Jain, K., Baymuradov, U. K., Narayanan, A. K., et al. (2018) · Nucleic Acids Research · doi:10.1093/nar/gkx1081 · Cited by 1,717
N6-methyladenosine marks primary microRNAs for processing
Alarcón, C. R., Lee, H., Goodarzi, H., Halberg, N., & Tavazoie, S. F. (2015) · Nature · doi:10.1038/nature14281 · Cited by 1,420
Use of within-array replicate spots for assessing differential expression in microarray experiments
Smyth, G. K., Michaud, J., & Scott, H. S. (2005) · Computer applications in the biosciences · doi:10.1093/bioinformatics/bti270 · Cited by 1,406
miRWalk2.0: a comprehensive atlas of microRNA-target interactions
Dweep, H., & Gretz, N. (2015) · Nature Methods · doi:10.1038/nmeth.3485 · Cited by 1,350
GAGE: generally applicable gene set enrichment for pathway analysis
Luo, W., Friedman, M. S., Shedden, K., Hankenson, K. D., & Woolf, P. J. (2009) · BMC Bioinformatics · doi:10.1186/1471-2105-10-161 · Cited by 1,333
The tumor suppressor microRNA let-7 represses the HMGA2 oncogenePreprint
Lee, Y. S., & Dutta, A. (2007) · Genes & Development · doi:10.1101/gad.1540407 · Cited by 1,155
Disrupting the Pairing Between let-7 and Hmga2 Enhances Oncogenic Transformation
Mayr, C., Hemann, M. T., & Bartel, D. P. (2007) · Science · doi:10.1126/science.1137999 · Cited by 1,112
The dynamic N1-methyladenosine methylome in eukaryotic messenger RNA
Dominissini, D., Nachtergaele, S., Moshitch-Moshkovitz, S., Peer, E., Kol, N., Ben-Haim, M. S., Dai, Q., Segni, A. D., Salmon‐Divon, M., Clark, W. C., et al. (2016) · Nature · doi:10.1038/nature16998 · Cited by 1,047
Pseudouridine profiling reveals regulated mRNA pseudouridylation in yeast and human cells
Carlile, T. M., Rojas-Durán, M. F., Zinshteyn, B., Shin, H., Bartoli, K. M., & Gilbert, W. V. (2014) · Nature · doi:10.1038/nature13802 · Cited by 1,042 · cited 1×
“, 2016]) or chemical reactivity of the modification (for pseudouridine [Carlile et al., 2014; Schwartz et al., 2014], m5C [Schaefer, 2015], and 2 0-O-methylation [Dai et al.”
BackgroundTranscriptome-wide Mapping Reveals Widespread Dynamic-Regulated Pseudouridylation of ncRNA and mRNA
Schwartz, S., Bernstein, D. A., Mumbach, M. R., Jovanović, M., Herbst, R. H., León-Ricardo, B. X., Engreitz, J., Guttman, M., Satija, R., Lander, E. S., et al. (2014) · Cell · doi:10.1016/j.cell.2014.08.028 · Cited by 1,013 · cited 1×
“…et al., 2016], N6-methyladenosine [Dominissini et al., 2012], and 5-hydroxymethylcytosine [Delatte et al., 2016]) or chemical reactivity of the modification (for pseudouridine [Carlile et al., 2014; Schwartz et al., 2014], m5C [Schaefer, 2015], and 2 0-O-methylation [Dai et al., 2017]).”
MODOMICS: a database of RNA modification pathways—2013 update
Machnicka, M. A., Milanowska, K., Oglou, O. O., Purta, E., Kurkowska, M., Olchowik, A., Januszewski, W., Kalinowski, S., Dunin-Horkawicz, S., Rother, K. M., et al. (2012) · Nucleic Acids Research · doi:10.1093/nar/gks1007 · Cited by 1,003
Lin28 Mediates the Terminal Uridylation of let-7 Precursor MicroRNA
Heo, I., Joo, C., Cho, J., Ha, M., Han, J., & Kim, V. N. (2008) · Molecular Cell · doi:10.1016/j.molcel.2008.09.014 · Cited by 985
Direct chemical method for sequencing RNA.
Peattie, D. A. (1979) · Proceedings of the National Academy of Sciences · doi:10.1073/pnas.76.4.1760 · Cited by 943 · cited 1×
“This reaction is the basis of direct RNA sequencing (RNA-seq) by the Maxam and Gilbert method (Peattie, 1979) and has been used formappingm7G residues in highly abundant rRNAs and tRNAs at single nucleotide resolution (Zueva et al., 1985).”
MethodLandthaler, M., Yalçın, A., & Tuschl, T. (2004) · Current Biology · doi:10.1016/j.cub.2004.11.001 · Cited by 877
An unconventional role for miRNA: let-7 activates toll-like receptor 7 and causes neurodegeneration
Lehmann, S. M., Krüger, C., Park, B., Derkow, K., Rosenberger, K., Baumgart, J., Trimbuch, T., Eom, G., Hinz, M., Kaul, D., et al. (2012) · Nature Neuroscience · doi:10.1038/nn.3113 · Cited by 786
Therapeutic miRNA and siRNA: Moving from Bench to Clinic as Next Generation Medicine
Chakraborty, C., Sharma, A. R., Sharma, G., Doss, C. G. P., & Lee, S. (2017) · Molecular Therapy — Nucleic Acids · doi:10.1016/j.omtn.2017.06.005 · Cited by 735
Re-evaluation of G-quadruplex propensity with G4Hunter
Bedrat, A., Lacroix, L., & Mergny, J. (2016) · Nucleic Acids Research · doi:10.1093/nar/gkw006 · Cited by 693
5'-UTR RNA G-quadruplexes: translation regulation and targeting
Bugaut, A., & Balasubramanian, S. (2012) · Nucleic Acids Research · doi:10.1093/nar/gks068 · Cited by 654
Self-citationDistinct roles of Akt1 and Akt2 in regulating cell migration and epithelial–mesenchymal transition
Irie, H. Y., Pearline, R. V., Grueneberg, D. A., Hsia, M., Ravichandran, P., Kothari, N. H., Natesan, S., & Brugge, J. S. (2005) · The Journal of Cell Biology · doi:10.1083/jcb.200505087 · Cited by 582
Lin, S., Liu, Q., Lelyveld, V. S., Choe, J., Szostak, J. W., & Gregory, R. I. (2018) · Molecular Cell · doi:10.1016/j.molcel.2018.06.001 · Cited by 494
The LIN28/let-7 Pathway in Cancer
Balzeau, J. C., Menezes, M. R., Cao, S., & Hagan, J. P. (2017) · Frontiers in Genetics · doi:10.3389/fgene.2017.00031 · Cited by 461
Pathview Web: user friendly pathway visualization and data integration
Luo, W., Pant, G., Bhavnasi, Y. K., Blanchard, S. G., & Brouwer, C. (2017) · Nucleic Acids Research · doi:10.1093/nar/gkx372 · Cited by 446
Transcriptome-wide distribution and function of RNA hydroxymethylcytosine
Delatte, B., Wang, F., Ngoc, L. V., Collignon, É., Bonvin, E., Deplus, R., Calonne, E., Hassabi, B., Putmans, P., Awe, S., et al. (2016) · Science · doi:10.1126/science.aac5253 · Cited by 444 · cited 1×
“…antibodies (e.g., against N1-methyladenosine [Dominissini et al., 2016], N6-methyladenosine [Dominissini et al., 2012], and 5-hydroxymethylcytosine [Delatte et al., 2016]) or chemical reactivity of the modification (for pseudouridine [Carlile et al., 2014; Schwartz et al., 2014], m5C [Schaefer,…”
BackgroundrG4-seq reveals widespread formation of G-quadruplex structures in the human transcriptome
Kwok, C. K., Marsico, G., Sahakyan, A. B., Chambers, V. S., & Balasubramanian, S. (2016) · Nature Methods · doi:10.1038/nmeth.3965 · Cited by 434
Self-citationTwo proteins that form a complex are required for 7-methylguanosine modification of yeast tRNA
Alexandrov, A., Martzen, M. R., & Phizicky, E. M. (2002) · RNA · doi:10.1017/s1355838202024019 · Cited by 371
Lin28 Enhances Tissue Repair by Reprogramming Cellular Metabolism
Shyh‐Chang, N., Zhu, H., de Soysa, Y., Shinoda, G., Seligson, M. T., Tsanov, K. M., Nguyen, L. H., Asara, J. M., Cantley, L. C., & Daley, G. Q. (2013) · Cell · doi:10.1016/j.cell.2013.09.059 · Cited by 368
Nm-seq maps 2′-O-methylation sites in human mRNA with base precision
Dai, Q., Moshitch-Moshkovitz, S., Han, D., Kol, N., Amariglio, N., Rechavi, G., Dominissini, D., & He, C. (2017) · Nature Methods · doi:10.1038/nmeth.4294 · Cited by 301
Detecting microRNA binding and siRNA off-target effects from expression data
van Dongen, S., Abreu‐Goodger, C., & Enright, A. J. (2008) · Nature Methods · doi:10.1038/nmeth.1267 · Cited by 269
Capturing the interactome of newly transcribed RNA
Bao, X., Guo, X., Yin, M., Tariq, M., Lai, Y., Kanwal, S., Zhou, J., Li, N., Lv, Y., Pulido-Quetglas, C., et al. (2018) · Nature Methods · doi:10.1038/nmeth.4595 · Cited by 222
The 3D rRNA modification maps database: with interactive tools for ribosome analysis
Piekna‐Przybylska, D., Decatur, W. A., & Fournier, M. J. (2007) · Nucleic Acids Research · doi:10.1093/nar/gkm855 · Cited by 215
Genome-wide functional screening of miR-23b as a pleiotropic modulator suppressing cancer metastasis
Zhang, H., Hao, Y., Yang, J., Zhou, Y., Li, J., Yin, S., Sun, C., Ma, M., Huang, Y., & Xi, J. (2011) · Nature Communications · doi:10.1038/ncomms1555 · Cited by 203
Structure and Function of Noncanonical Nucleobases
Carell, T., Brandmayr, C., Hienzsch, A., Müller, M., Pearson, D., Reiter, V., Thoma, I., Thumbs, P., & Wagner, M. (2012) · Angewandte Chemie International Edition · doi:10.1002/anie.201201193 · Cited by 200
Polysome Fractionation to Analyze mRNA Distribution Profiles
Panda, A. C., Martindale, J. L., & Gorospe, M. (2017) · BIO-PROTOCOL · doi:10.21769/bioprotoc.2126 · Cited by 165
Human RNA Methyltransferase BCDIN3D Regulates MicroRNA Processing
Xhemalçe, B., Robson, S. C., & Kouzarides, T. (2012) · Cell · doi:10.1016/j.cell.2012.08.041 · Cited by 153
Self-citationA Potassium Ion-Dependent RNA Structural Switch Regulates Human Pre-miRNA 92b Maturation
Arachchilage, G. M., Dassanayake, A. C., & Basu, S. (2015) · Chemistry & Biology · doi:10.1016/j.chembiol.2014.12.013 · Cited by 127
Structural Analysis using SHALiPE to Reveal RNA G‐Quadruplex Formation in Human Precursor MicroRNA
Kwok, C. K., Sahakyan, A. B., & Balasubramanian, S. (2016) · Angewandte Chemie International Edition · doi:10.1002/anie.201603562 · Cited by 113
Self-citationThe tRNA methylase METTL1 is phosphorylated and inactivated by PKB and RSK in vitro and in cells
Cartlidge, R. A., Knebel, A., Peggie, M. W., Alexandrov, A., Phizicky, E. M., & Cohen, P. (2005) · The EMBO Journal · doi:10.1038/sj.emboj.7600648 · Cited by 99 · cited 1×
“Notably, AKT has been shown to directly phosphorylate METTL1 to inhibit its enzymatic activity (Cartlidge et al., 2005).”
BackgroundThe RNA Stem–Loop to G-Quadruplex Equilibrium Controls Mature MicroRNA Production inside the Cell
Pandey, S., Agarwala, P., Jayaraj, G. G., Gargallo, R., & Maiti, S. (2015) · Biochemistry · doi:10.1021/acs.biochem.5b00574 · Cited by 85
Methylation of deoxyribonucleic acid by diazomethane
Kriek, E., & Emmelot, P. (1964) · Biochimica et Biophysica Acta (BBA) - Specialized Section on Nucleic Acids and Related Subjects · doi:10.1016/0926-6550(64)90170-7 · Cited by 78
RNA 5-Methylcytosine Analysis by Bisulfite Sequencing
Schaefer, M. (2015) · Methods in enzymology on CD-ROM/Methods in enzymology · doi:10.1016/bs.mie.2015.03.007 · Cited by 64 · cited 2×
“…et al., 2016], N6-methyladenosine [Dominissini et al., 2012], and 5-hydroxymethylcytosine [Delatte et al., 2016]) or chemical reactivity of the modification (for pseudouridine [Carlile et al., 2014; Schwartz et al., 2014], m5C [Schaefer, 2015], and 2 0-O-methylation [Dai et al., 2017]).”
Zueva, V. S., Mankin, A. S., BOGDANOV, A. A., & Baratova, L. A. (1985) · European Journal of Biochemistry · doi:10.1111/j.1432-1033.1985.tb08704.x · Cited by 59
Lin28 and let-7: roles and regulation in liver diseases
McDaniel, K. M., Hall, C. M., Sato, K., Lairmore, T. C., Marzioni, M., Glaser, S. S., Meng, F., & Alpini, G. D. (2016) · American Journal of Physiology-Gastrointestinal and Liver Physiology · doi:10.1152/ajpgi.00080.2016 · Cited by 42
An assay for RNA oxidation induced abasic sites using the Aldehyde Reactive Probe
Tanaka, M., Song, H., Küpfer, P. A., Leumann, C. J., & Sonntag, W. E. (2010) · Free Radical Research · doi:10.3109/10715762.2010.535529 · Cited by 38
ChemInform Abstract: Structure and Function of Noncanonical Nucleobases
Carell, T., Brandmayr, C., Hienzsch, A., Mueller, M., Pearson, D., Reiter, V., Thoma, I., Thumbs, P., & Wagner, M. (2012) · ChemInform · doi:10.1002/chin.201247270 · Cited by 34 · cited 1×
“…ª 2019 The Autho This is an open access article under the CC BY license (http://creative date, >100 RNA modifications have been identified, which are spread throughout every class of RNA and are evolutionarily conserved throughout all kingdoms of life (Carell et al., 2012; Machnicka et al., 2013).”
BackgroundTranslational halt during elongation caused by G-quadruplex formed by mRNA
Endoh, T., Kawasaki, Y., & Sugimoto, N. (2013) · Methods · doi:10.1016/j.ymeth.2013.05.026 · Cited by 33 · cited 1×
“G-quadruplexes and other alternative structures involving non-Watson-Crick base pairing have been described in other classes of RNA, including mRNA (Bugaut and Balasubramanian, 2012); there they are proposed to induce ribosome stalling, thereby inhibiting translation (Endoh et al., 2013).”
BackgroundThe Profile and Dynamics of RNA Modifications in Animals
van Delft, P., Akay, A., Huber, S. M., Bueschl, C., Rudolph, K. L. M., Domenico, T. D., Schuhmacher, R., Miska, E. A., & Balasubramanian, S. (2017) · ChemBioChem · doi:10.1002/cbic.201700093 · Cited by 30
Self-citationGuanine Modification of Inhibitory Oligonucleotides Potentiates Their Suppressive Function
Römmler, F., Jurk, M., Uhlmann, E., Hammel, M., Waldhuber, A., Pfeiffer, L., Wagner, H., Vollmer, J., & Miethke, T. (2013) · The Journal of Immunology · doi:10.4049/jimmunol.1300706 · Cited by 24
Cited by
Sorted by citations
Role of RNA modifications in cancer
Barbieri, I., & Kouzarides, T. (2020) · Nature reviews. Cancer · doi:10.1038/s41568-020-0253-2 · Cited by 1,350
Self-citationThe regulation and functions of DNA and RNA G-quadruplexes
Varshney, D., Spiegel, J., Zyner, K. G., Tannahill, D., & Balasubramanian, S. (2020) · Nature Reviews Molecular Cell Biology · doi:10.1038/s41580-020-0236-x · Cited by 1,292
Self-citationThe epitranscriptome beyond m6A
Wiener, D., & Schwartz, S. (2020) · Nature Reviews Genetics · doi:10.1038/s41576-020-00295-8 · Cited by 733
The roles of DNA, RNA and histone methylation in ageing and cancer
Michalak, E. M., Burr, M. L., Bannister, A. J., & Dawson, M. A. (2019) · Nature Reviews Molecular Cell Biology · doi:10.1038/s41580-019-0143-1 · Cited by 549
Self-citationSmall and long non-coding RNAs: Past, present, and future
Chen, L., & Kim, V. N. (2024) · Cell · doi:10.1016/j.cell.2024.10.024 · Cited by 461
Metadata
- Authors
- Pandolfini, L., Barbieri, I., Bannister, A. J., Hendrick, A., Andrews, B., Webster, N., Murat, P., Mach, P., Brandi, R., Robson, S. C., Migliori, V., Alendar, A., d’Onofrio, M., Balasubramanian, S., & Kouzarides, T.
- Affiliations
- University of Cambridge (GB)
- European Brain Research Institute (IT)
- Istituto di Farmacologia Traslazionale (IT)
- Corresponding author
- Kouzarides, Tony
- ORCID
- Venue
- Molecular Cell
- Publisher
- Elsevier BV
- Published
- 2019-06
- Volume
- 74
- Issue
- 6
- Pages
- 1278-1290.e9
- ISSN
- 1097-2765 (ISSN-L)
- PMC
- PMC6591002
- OpenAlex
- W2941132662
- Cited by
- 491
- References
- 66
- Citations by year
- 2026: 32 · 2025: 68 · 2024: 76 · 2023: 95 · 2022: 101 · 2021: 68 · 2020: 37 · 2019: 14
- FWCI
- 18.36
- Type
- journal article
- Language
- en
- Open access
- hybrid
- doi.org
- Licence
- Locations
- Molecular Cell (publishedVersion, cc-by)
- Europe PMC (PubMed Central) (publishedVersion, cc-by)
- PubMed Central (publishedVersion, cc-by)
- PubMed (publishedVersion)
- IRIS Research product catalog (Sapienza University of Rome) (submittedVersion)
- Institutional Research Information System University of Turin (University of Turin) (submittedVersion)
- Apollo (University of Cambridge) (submittedVersion, cc-by-nc-nd)
- Apollo
- Funders
- European Research Council (268569)
- Cancer Research UK (RG72100)
- Horizon 2020 (732678)
- Wellcome Trust (WT203144, C6946/A24843)
- Kay Kendall Leukaemia Fund (337778, RG86786, RG88664)
- Topics
- Life Sciences › Biochemistry, Genetics and Molecular Biology › Molecular Biology › RNA modifications and cancer
- Life Sciences › Biochemistry, Genetics and Molecular Biology › Molecular Biology › RNA regulation and disease
- Life Sciences › Biochemistry, Genetics and Molecular Biology › Cancer Research › MicroRNA in disease regulation
- Keywords
- METTL1, let-7 microRNA, 7-methylguanosine, RNA methylation, microRNA biogenesis, cell migration, RNA modification
- MeSH terms
- A549 Cells, Base Sequence, Biological Assay, Cell Movement, Guanosine, Humans, Methylation, Methyltransferases, Nucleic Acid Conformation, RNA Processing, Post-Transcriptional, Caco-2 Cells, MicroRNAs, Cell Proliferation, HEK293 Cells
About these checks
Registry, retraction, Cites and statistics results are computed, not judged, with one exception: a printed reference that no index lists is read once by a model before it counts as a citation error. Claims are extracted by a model and kept only when their quote appears verbatim in the text; each cited source is then checked, with a model’s help, for whether it says what the claim relies on. Those verdicts can be wrong — read the claim’s quote and the cited source before relying on one.
Statistics and arithmetic are recomputed, not judged.
Confidence bands are shown only for fields calibrated on our annotated test set. None is calibrated yet, so no band is shown.
What counts as a claim ›How we measure confidence ›How we check this ›
Are you an author, or do you see a problem with this page? Request a review
