

The DOI matches its Crossref record; 73 of the 73 references it cites were found in a registry or an index.
Muscle insulin sensitivity and glucose metabolism are controlled by the intrinsic muscle clock
Open accessAbstract
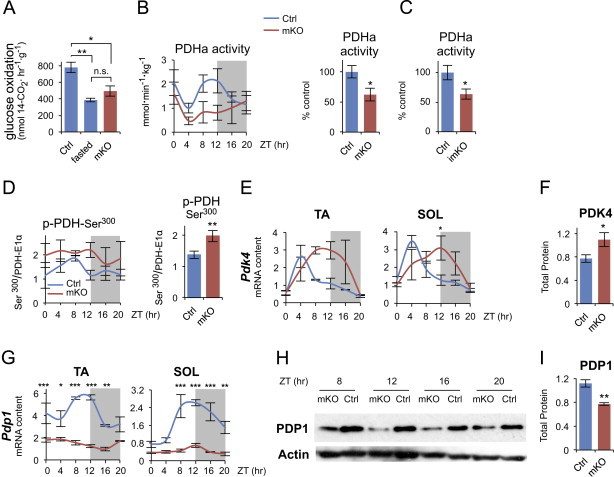
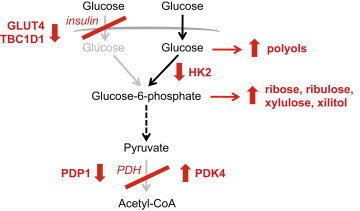
Circadian rhythms control metabolism and energy homeostasis, but the role of the skeletal muscle clock has never been explored. We generated conditional and inducible mouse lines with muscle-specific ablation of the core clock gene Bmal1. Skeletal muscles from these mice showed impaired insulin-stimulated glucose uptake with reduced protein levels of GLUT4, the insulin-dependent glucose transporter, and TBC1D1, a Rab-GTPase involved in GLUT4 translocation. Pyruvate dehydrogenase (PDH) activity was also reduced due to altered expression of circadian genes Pdk4 and Pdp1, coding for PDH kinase and phosphatase, respectively. PDH inhibition leads to reduced glucose oxidation and diversion of glycolytic intermediates to alternative metabolic pathways, as revealed by metabolome analysis. The impaired glucose metabolism induced by muscle-specific Bmal1 knockout suggests that a major physiological role of the muscle clock is to prepare for the transition from the rest/fasting phase to the active/feeding phase, when glucose becomes the predominant fuel for skeletal muscle.
Overview
The claims and statistics of this paper haven’t been checked yet.
Run the check — free, no account needed. It reads the open-access text and checks the sources it cites.
Integrity signals
Registry
Cites
Statistics
Figures
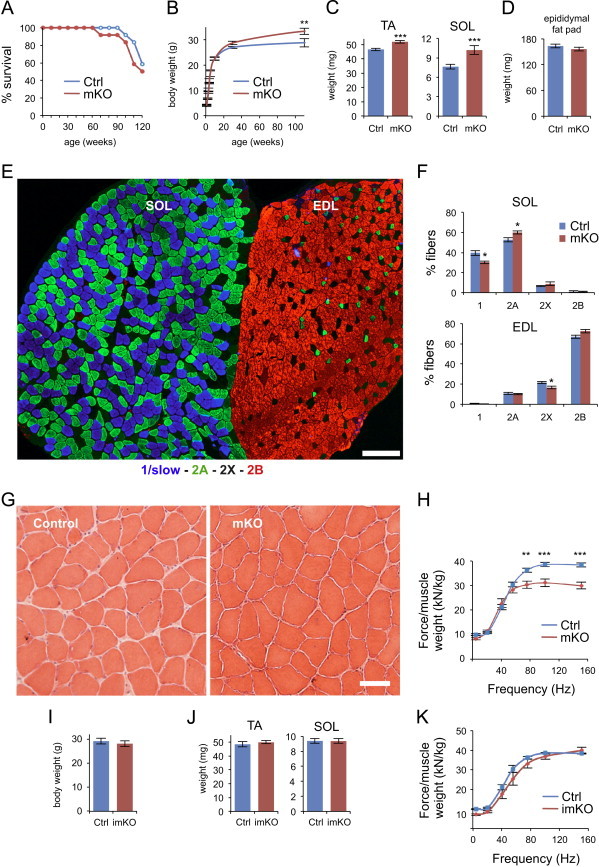
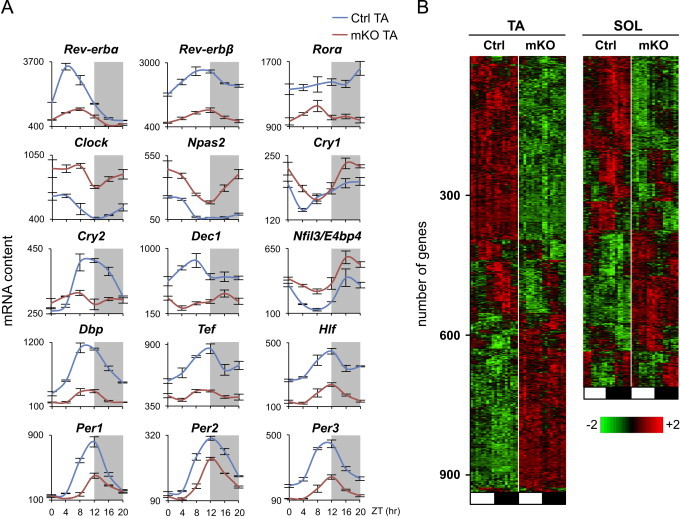
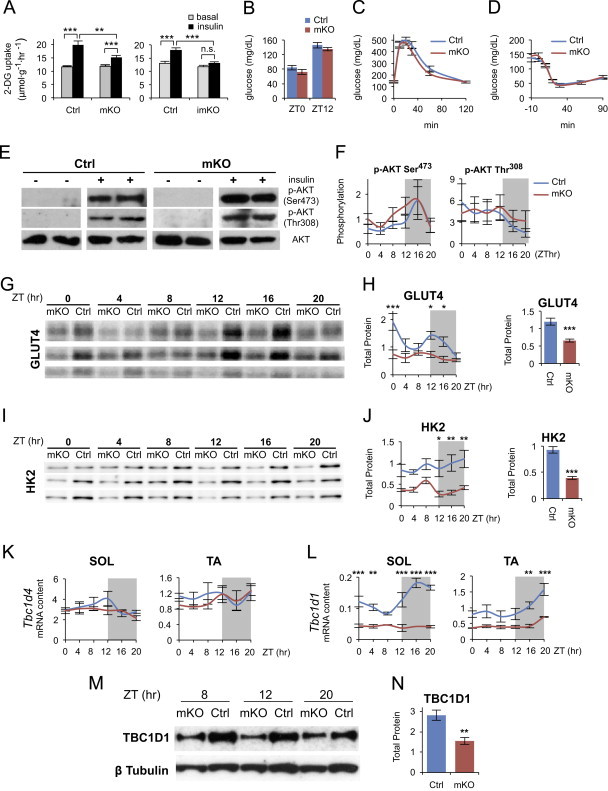
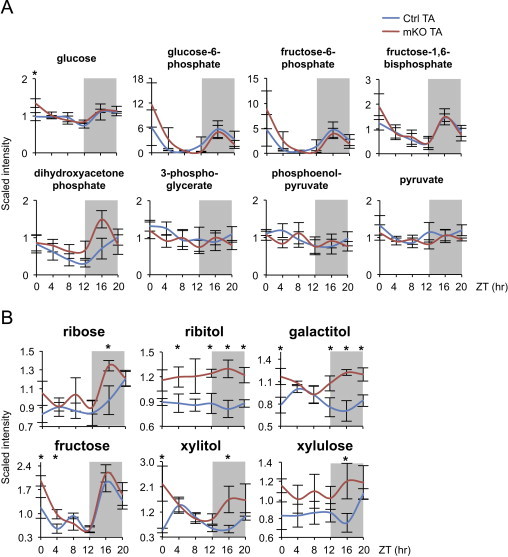
Verification
Claims the paper makes
The claims and statistics of this paper haven’t been checked yet.
Run the check — free, no account needed. It reads the open-access text and checks the sources it cites.
Claims other papers make about this one
Each is checked against this paper’s own text: does it say what the citing paper says it does?
In the citing paper
“Disruption of the muscle clock has also been shown to have significant impact on glucose intolerance and insulin resistance with very small changes in fiber types (Dyar et al., 2014; Schroder et al., 2015; Harfmann et al., 2016).”
From Myosteatosis in the Context of Skeletal Muscle Function Deficit: An Interdisciplinary Workshop at the National Institute on Aging (2020) · cites this paper as Dyar et al., 2014
In the citing paper
“In addition, prolonged loss of Bmal1 function was also associated with increased fibrosis within the muscle.”
From Myosteatosis in the Context of Skeletal Muscle Function Deficit: An Interdisciplinary Workshop at the National Institute on Aging (2020) · cites this paper as Dyar et al., 2014
In the citing paper
“These animals showed reduced protein levels of GLUT4 and an impaired insulin-stimulated glucose uptake in their muscles.”
From Circadian control of glucose metabolism (2014) · cites this paper as [153]
In the citing paper
“For example, the hepatic clock regulates fasting glycemic control and glucose clearance (8), the pancreatic clock regulates insulin secretion and its response to glucose (9-11), the adipose clock regulates lipid storage and mobilization (12,13), and the skeletal muscle clock regulates glucose uptake and metabolism (14).”
From Circadian rhythms, metabolism, and chrononutrition in rodents and humans (2016) · cites this paper as [14]
Self-check
Percentages, sums and reported differences re-computed from the paper’s own numbers.
The self-check needs the paper’s full text.
Citations
Cites
Subramanian, A., Tamayo, P., Mootha, V. K., Mukherjee, S., Ebert, B. L., Gillette, M. A., Paulovich, A., Pomeroy, S. L., Golub, T. R., Lander, E. S., et al. (2005) · Proceedings of the National Academy of Sciences · doi:10.1073/pnas.0506580102 · Cited by 53,625 · cited 5×
“jsp) [27] and gene sets from the KEGG database.”
BackgroundMethodInfluentialExploration, normalization, and summaries of high density oligonucleotide array probe level data
Irizarry, R. A. (2003) · Biostatistics · doi:10.1093/biostatistics/4.2.249 · Cited by 10,603 · cited 2×
“Expression values were generated from fluorescence signals using the robust multi-array average procedure (RMA) [23].”
MethodObesity and Metabolic Syndrome in Circadian Clock Mutant Mice
Turek, F. W., Joshu, C., Kohsaka, A., Lin, E., Ivanova, G., McDearmon, E., Laposky, A., Losee-Olson, S., Easton, A., Jensen, D. R., et al. (2005) · Science · doi:10.1126/science.1108750 · Cited by 2,485 · cited 1×
“Global inactivation of different clock genes leads to altered glucose metabolism: Clock mutant mice display hyperglycemia, obesity and metabolic syndrome [9]; Per1/Per2 double knockout mice and Cry1/Cr2 double knockout mice exhibit glucose”
BackgroundDibner, C., Schibler, U., & Albrecht, U. (2010) · Annual Review of Physiology · doi:10.1146/annurev-physiol-021909-135821 · Cited by 2,421 · cited 2×
“In addition to the core clock genes, all tissues contain a large number of oscillating genes, most of which are tissue-specific and regulated either directly by the core oscillator or by extrinsic circadian signals [7].”
BackgroundEvolving gene/transcript definitions significantly alter the interpretation of GeneChip data
Dai, M. (2005) · Nucleic Acids Research · doi:10.1093/nar/gni179 · Cited by 1,807 · cited 1×
“Speci fi cally, intensity levels have been background adjusted, normalized using quantile normalization, and log 2 expression values calculated using median polish summarization and Entrez custom chip de fi nition fi les for mouse arrays (version 14.1.0) [24].”
MethodInfluentialDeFronzo, R. A., Jacot, E., Jequier, E., Maeder, E., Wahren, J., & Felber, J. P. (1981) · Diabetes · doi:10.2337/diab.30.12.1000 · Cited by 1,770 · cited 1×
“Skeletal muscle is a major site of insulin-stimulated glucose disposal [56] and muscle insulin resistance has been considered to be one of the earliest factors in the pathogenesis of the metabolic syndrome [57].”
BackgroundOccupational and Environmental Medicine
Rosenstock, L., Rest, K. M., BENSON, J. A., Cannella, J. M., Cohen, J. J., Cullen, M. R., Davidoff, F. F., Landrigan, P. J., Reynolds, R. C., Clever, L. H., et al. (1991) · New England Journal of Medicine · doi:10.1056/nejm199109263251305 · Cited by 1,627
Mop3 is an essential component of the master circadian pacemaker in mammals.
Bunger, M. K., Wilsbacher, L. D., Moran, S. M., Clendenin, C., Radcliffe, L. A., Hogenesch, J. B., Simon, M. C., Takahashi, J. S., & Bradfield, C. A. (2000) · Cell · doi:10.1016/s0092-8674(00)00205-1 · Cited by 1,621 · cited 3×
“Global Bmal1 knockout causes not only loss of circadian rhythm of locomotor activity but also reduced total activity levels [42] and rescue experiments in which BMAL1 was constitutively expressed in skeletal muscle of Bmal1 null mice showed that musclespecific rescue restored activity levels, though not circadian rhyt…”
BackgroundDisruption of the clock components CLOCK and BMAL1 leads to hypoinsulinaemia and diabetes
Marcheva, B., Ramsey, K. M., Buhr, E. D., Kobayashi, Y., Su, H., Ko, C. H., Ivanova, G., Omura, C., Mo, S., Vitaterna, M. H., et al. (2010) · Nature · doi:10.1038/nature09253 · Cited by 1,525 · cited 1×
“Selective knockout of Bmal1 in the liver causes hypoglycemia [10], while ablation of the same gene in the endocrine pancreas leads to fasting hyperglycemia and severe glucose intolerance [15].”
BackgroundLipid-induced insulin resistance: unravelling the mechanism
Samuel, V. T., Petersen, K. F., & Shulman, G. I. (2010) · The Lancet · doi:10.1016/s0140-6736(10)60408-4 · Cited by 1,189 · cited 1×
“What is the cause of the altered response to insulin in muscles from Bmal1 mKO mice? The canonical insulin signaling pathway is apparently not responsible for this change, since AKT phosphorylation, which is reduced in obesity and diabetes [60], was unchanged, and was similarly increased by insulin in muscles from con…”
Background
Cited by
Sorted by citations
Circadian clocks and insulin resistance
Stenvers, D. J., Scheer, F. A. J. L., Schrauwen, P., la Fleur, S. E., & Kalsbeek, A. (2019) · Nature Reviews Endocrinology · doi:10.1038/s41574-018-0122-1 · Cited by 733
Circadian Rhythm and Sleep Disruption: Causes, Metabolic Consequences, and Countermeasures
Potter, G. D., Skene, D. J., Arendt, J., Cade, J. E., Grant, P. J., & Hardie, L. J. (2016) · Endocrine Reviews · doi:10.1210/er.2016-1083 · Cited by 781
Crosstalk between metabolism and circadian clocks
Reinke, H., & Asher, G. (2019) · Nature Reviews Molecular Cell Biology · doi:10.1038/s41580-018-0096-9 · Cited by 598
Meal timing regulates the human circadian system
Wehrens, S. M. T., Christou, S., Isherwood, C., Middleton, B., Gibbs, M. A., Archer, S. N., Skene, D. J., & Johnston, J. D. (2017) · Current Biology · doi:10.1016/j.cub.2017.04.059 · Cited by 596
Widespread seasonal gene expression reveals annual differences in human immunity and physiology
Dopico, X. C., Evangelou, M., Ferreira, R. C., Guo, H., Pekalski, M. L., Smyth, D. J., Cooper, N., Burren, O. S., Fulford, A. J., Hennig, B. J., et al. (2015) · Nature Communications · doi:10.1038/ncomms8000 · Cited by 472
Metadata
- Authors
- Dyar, K. A., Ciciliot, S., Wright, L. E., Biensø, R. S., Tagliazucchi, G. M., Patel, V. R., Forcato, M., Paz, M. I. P., Gudiksen, A., Solagna, F., Albiero, M., Moretti, I., Eckel-Mahan, K. L., Baldi, P., Sassone-Corsi, P., Rizzuto, R., Bicciato, S., Pilegaard, H., Blaauw, B., & Schiaffino, S.
- Affiliations
- Veneto Institute of Molecular Medicine (IT)
- University of Padua (IT)
- University of Copenhagen (DK)
- University of Modena and Reggio Emilia (IT)
- University of California, Irvine (US)
- Corresponding author
- Dyar, Kenneth A.
- Schiaffino, Stefano
- ORCID
- Venue
- Molecular Metabolism
- Publisher
- Elsevier BV
- Published
- 2014-02
- Volume
- 3
- Issue
- 1
- Pages
- 29-41
- ISSN
- 2212-8778 (ISSN-L)
- PMC
- PMC3929910
- OpenAlex
- W1964634897
- Cited by
- 454
- References
- 73
- Citations by year
- 2026: 34 · 2025: 37 · 2024: 40 · 2023: 46 · 2022: 42 · 2021: 33 · 2020: 53 · 2019: 34 · 2018: 36 · 2017: 28 · 2016: 42 · 2015: 19 · 2014: 9
- FWCI
- 12.78
- Type
- journal article
- Language
- en
- Update notices
- erratum (2014-12-01)
- Open access
- gold
- doi.org
- Licence
- Locations
- Molecular Metabolism (publishedVersion, cc-by-nc-sa)
- Europe PMC (PubMed Central) (publishedVersion, cc-by-nc-sa)
- PubMed Central (publishedVersion, cc-by-nc-sa)
- PubMed (publishedVersion)
- Research at the University of Copenhagen (University of Copenhagen) (publishedVersion, other-oa)
- eScholarship (California Digital Library) (submittedVersion)
- eScholarship (California Digital Library) (submittedVersion, cc-by-nc-sa)
- IRIS UNIMORE (University of Modena and Reggio Emilia) (submittedVersion, cc-by-nc-sa)
- Padua Research Archive (University of Padova) (submittedVersion)
- Funders
- European Commission (223576, 294777)
- Italian Space Agency (ASI, project OSMA)
- Italian Ministries of Health (Ricerca Finalizzata) and of Education, University and Research (PRIN, FIRB), NIA (2P01AG025532-06A1)
- Cariparo Foundation (Padua)
- Italian Association for Cancer Research (AIRC) and Telethon–Italy (GPP1005A, GGP11082)
- Topics
- Life Sciences › Neuroscience › Endocrine and Autonomic Systems › Circadian rhythm and melatonin
- Life Sciences › Biochemistry, Genetics and Molecular Biology › Molecular Biology › Metabolism, Diabetes, and Cancer
- Health Sciences › Medicine › Physiology (medical) › Adipose Tissue and Metabolism
- Keywords
- circadian rhythm, Bmal1, insulin sensitivity, glucose uptake, GLUT4, TBC1D1, pyruvate dehydrogenase, PDK4, PDP1, glucose oxidation, glycolysis, metabolome, conditional knockout mice
About these checks
Registry, retraction, Cites and statistics results are computed, not judged, with one exception: a printed reference that no index lists is read once by a model before it counts as a citation error. Claims are extracted by a model and kept only when their quote appears verbatim in the text; each cited source is then checked, with a model’s help, for whether it says what the claim relies on. Those verdicts can be wrong — read the claim’s quote and the cited source before relying on one.
Statistics and arithmetic are recomputed, not judged.
Confidence bands are shown only for fields calibrated on our annotated test set. None is calibrated yet, so no band is shown.
What counts as a claim ›How we measure confidence ›How we check this ›
Are you an author, or do you see a problem with this page? Request a review
