Cited by 58

The DOI matches its Crossref record; 9 of the 9 references it cites were found in a registry or an index.

Cholesterol 25-hydroxylase (CH25H) as a promoter of adipose tissue inflammation in obesity and diabetes

Russo, Lucia, Muir, Lindsey, Geletka, Lynn, Delproposto, Jennifer, Baker, Nicki, Flesher, Carmen, O'Rourke, Robert, Lumeng, Carey N.·2020·Molecular Metabolism

Overview

The claims and statistics of this paper haven’t been checked yet.

Run the check — free, no account needed. It reads the open-access text and checks the sources it cites.

A few free checks a day · papers already verified open instantly · results are public

Integrity signals

Registry

Crossref · 10.1016/j.molmet.2020.100983

Cites

9 of 9 references verified0 citation errors · 0 not checkable

Statistics

Figures

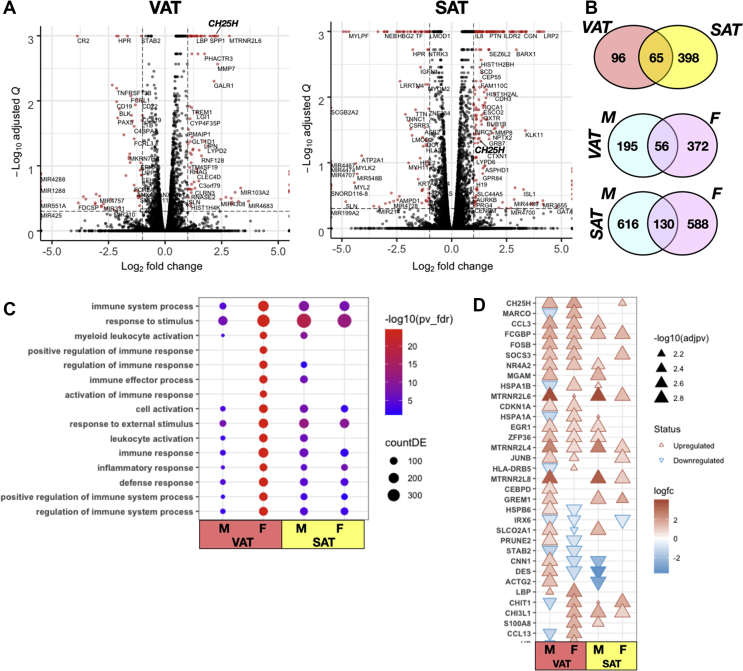
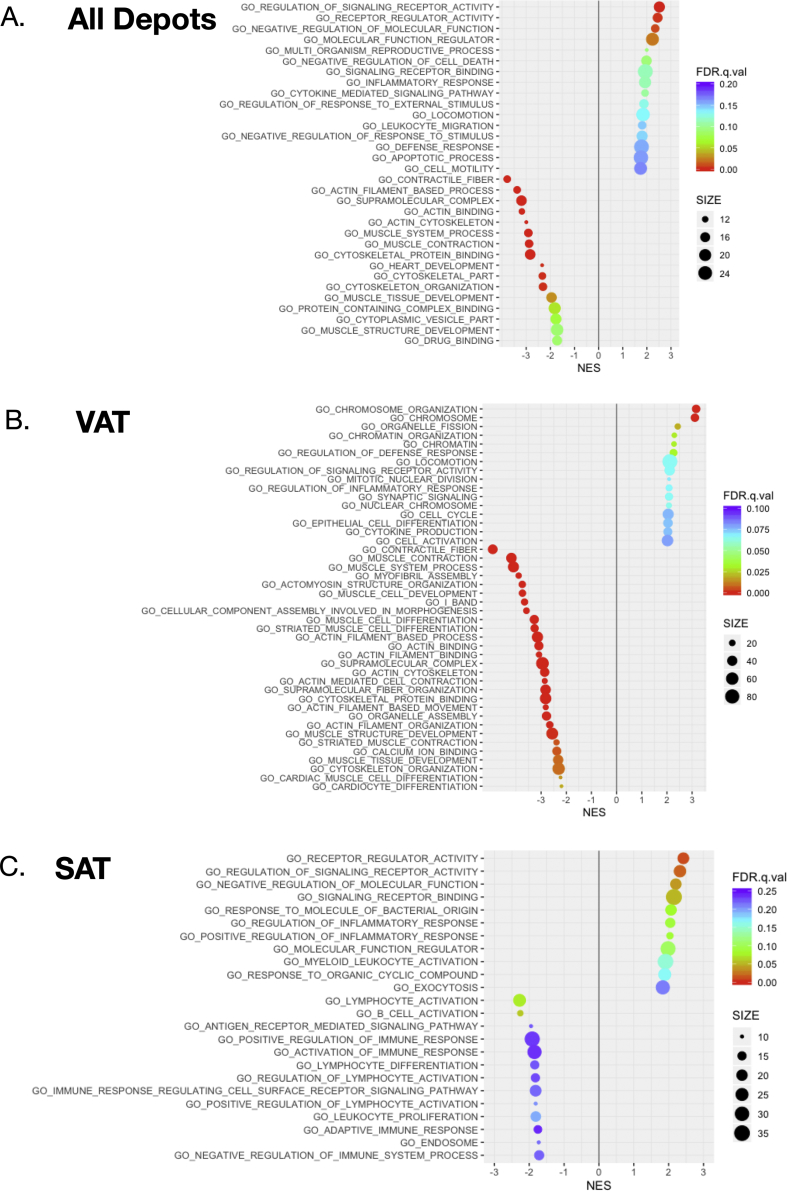
Figure 1 Data from mRNA sequencing analysis in human visceral omental and subcutaneous adipose tissue of obese and diabetic subjects. A) Volcano plot of differentially expressed genes (DEGs) in VAT and SAT from human obese and diabetic male and female subjects (N = 5/group/sex). Subject demographics is provided in Table 1. The data of all genes are plotted as log2 fold change versus the –log10 of the adjusted p-value. Thresholds are shown as dashed lines. Genes selected as significantly different are highlighted as red dots. Note the prominent position of the CH25H gene, which was chosen for further analysis. B) The Venn diagrams show the numbers of DEGs in common or specific between the VAT and SAT (upper) and distributed between males and females (lower). C) Gene Ontology (GO) and Enriched Kyoto Encyclopedia of Genes and Genomes (KEGG) pathway analyses of the most significantly enriched biological processes (adjusted p-value <0.05, Benjamini-Hochberg) linked to the DEGs in VAT and SAT distributed between male and female subjects. Significant terms are associated with activation of immune system responses. The complete list of analyses of DEGs distributed by depot and sex is provided in ESM Table 1. D) Heat-map showing the log2 fold change in expression of the DEGs involved in biological processes and KEGG pathways associated with immune system activation. Note the upregulation of the CH25H gene in VAT.
Figure 1 Data from mRNA sequencing analysis in human visceral omental and subcutaneous adipose tissue of obese and diabetic subjects. A) Volcano plot of differentially expressed genes (DEGs) in VAT and SAT from human obese and diabetic male and female subjects (N = 5/group/sex). Subject demographics is provided in Table 1. The data of all genes are plotted as log2 fold change versus the –log10 of the adjusted p-value. Thresholds are shown as dashed lines. Genes selected as significantly different are highlighted as red dots. Note the prominent position of the CH25H gene, which was chosen for further analysis. B) The Venn diagrams show the numbers of DEGs in common or specific between the VAT and SAT (upper) and distributed between males and females (lower). C) Gene Ontology (GO) and Enriched Kyoto Encyclopedia of Genes and Genomes (KEGG) pathway analyses of the most significantly enriched biological processes (adjusted p-value <0.05, Benjamini-Hochberg) linked to the DEGs in VAT and SAT distributed between male and female subjects. Significant terms are associated with activation of immune system responses. The complete list of analyses of DEGs distributed by depot and sex is provided in ESM Table 1. D) Heat-map showing the log2 fold change in expression of the DEGs involved in biological processes and KEGG pathways associated with immune system activation. Note the upregulation of the CH25H gene in VAT.CC BY-NC-ND · PubMed Central
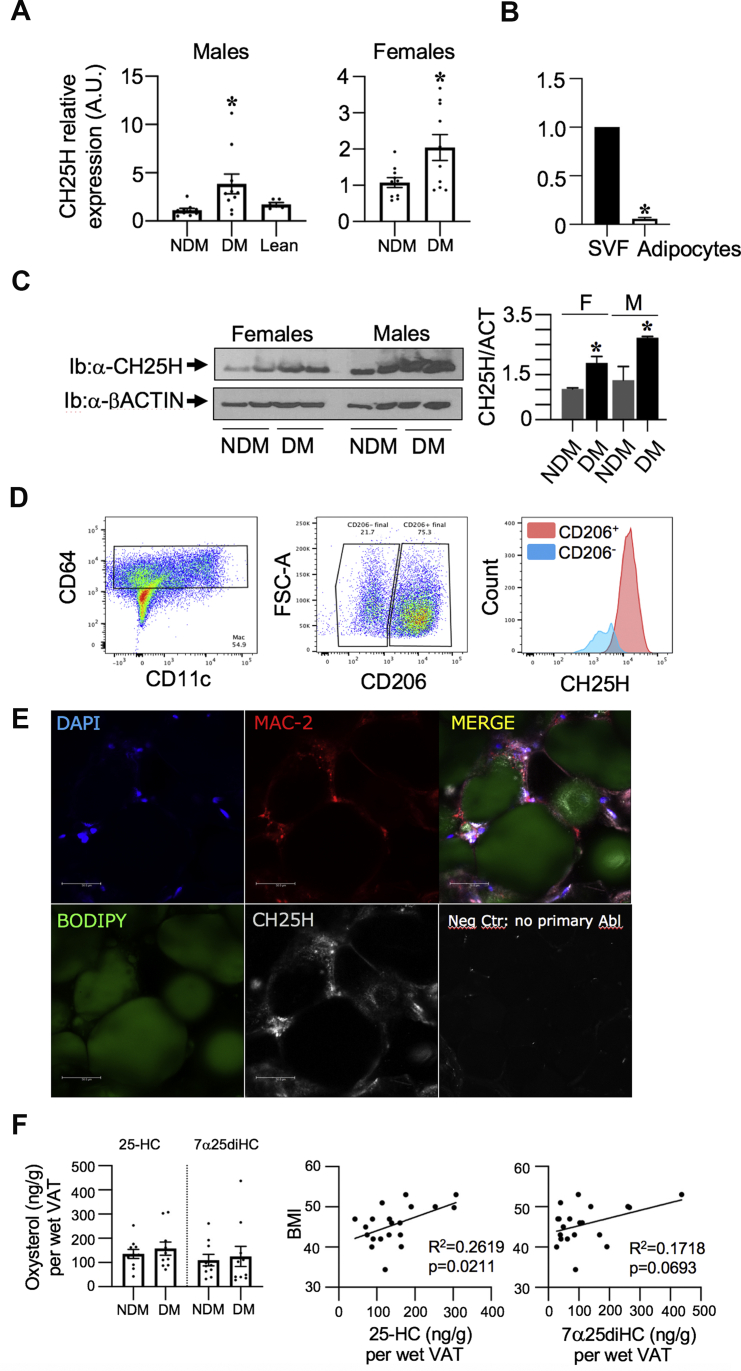
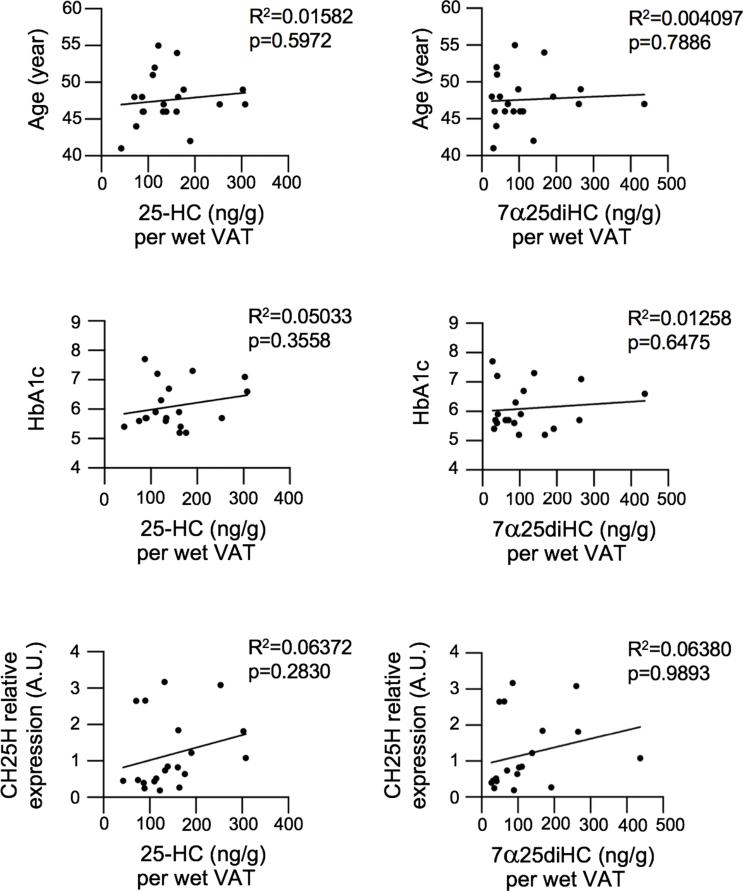
Figure 2 CH25H mRNA upregulation in human visceral omental adipose tissue of obese diabetic subjects and detection in ATMs. A) mRNA analysis of CH25H relative to PPIA in visceral omental adipose tissue (VAT) lysates from obese non-diabetic (NDM), obese diabetic (DM) and lean male subjects (N = 10 in duplicate and N = 6 lean in duplicate). Same assay in female subjects. B) The next to the upper graph shows CH25H expression in mature adipocytes and stromal vascular fraction (SVF) from omental fat. C) Western blot analysis of visceral omental adipose tissue lysates was performed to assess CH25H protein level (Ib: α-CH25H). The same gel was used to immunoblot with β-actin for normalization. Quantification of CH25H to Actin was measured by densitometry shown on the right. D) Flow cytometry blots show CD206+ cells out of CD64+CD11c+ ATMs and CH25H co-staining with CD206+ cells. E.) Confocal microscopy in visceral omental adipose tissue sections of a representative obese diabetic male subject. Staining with DAPI/nuclei (bleu), BODIPY/adipocytes (green), MAC-2/macrophages (red), Ch25h (grey) onto 20X field. Negative control was stained without primary antibody against CH25H but only with a fluorophore-conjugated secondary antibody. Values are expressed as mean ± SEM. ∗P ≤ 0.05 Significance compares to obese NDM. F) Levels of 25-HC and 7α25diHC in visceral omental adipose tissue from NDM and DM male subjects (N = 10). G.) Correlational studies relative to age, BMI and HbA1c. Subject demographics in ESM Table 3.
Figure 2 CH25H mRNA upregulation in human visceral omental adipose tissue of obese diabetic subjects and detection in ATMs. A) mRNA analysis of CH25H relative to PPIA in visceral omental adipose tissue (VAT) lysates from obese non-diabetic (NDM), obese diabetic (DM) and lean male subjects (N = 10 in duplicate and N = 6 lean in duplicate). Same assay in female subjects. B) The next to the upper graph shows CH25H expression in mature adipocytes and stromal vascular fraction (SVF) from omental fat. C) Western blot analysis of visceral omental adipose tissue lysates was performed to assess CH25H protein level (Ib: α-CH25H). The same gel was used to immunoblot with β-actin for normalization. Quantification of CH25H to Actin was measured by densitometry shown on the right. D) Flow cytometry blots show CD206+ cells out of CD64+CD11c+ ATMs and CH25H co-staining with CD206+ cells. E.) Confocal microscopy in visceral omental adipose tissue sections of a representative obese diabetic male subject. Staining with DAPI/nuclei (bleu), BODIPY/adipocytes (green), MAC-2/macrophages (red), Ch25h (grey) onto 20X field. Negative control was stained without primary antibody against CH25H but only with a fluorophore-conjugated secondary antibody. Values are expressed as mean ± SEM. ∗P ≤ 0.05 Significance compares to obese NDM. F) Levels of 25-HC and 7α25diHC in visceral omental adipose tissue from NDM and DM male subjects (N = 10). G.) Correlational studies relative to age, BMI and HbA1c. Subject demographics in ESM Table 3.CC BY-NC-ND · PubMed Central
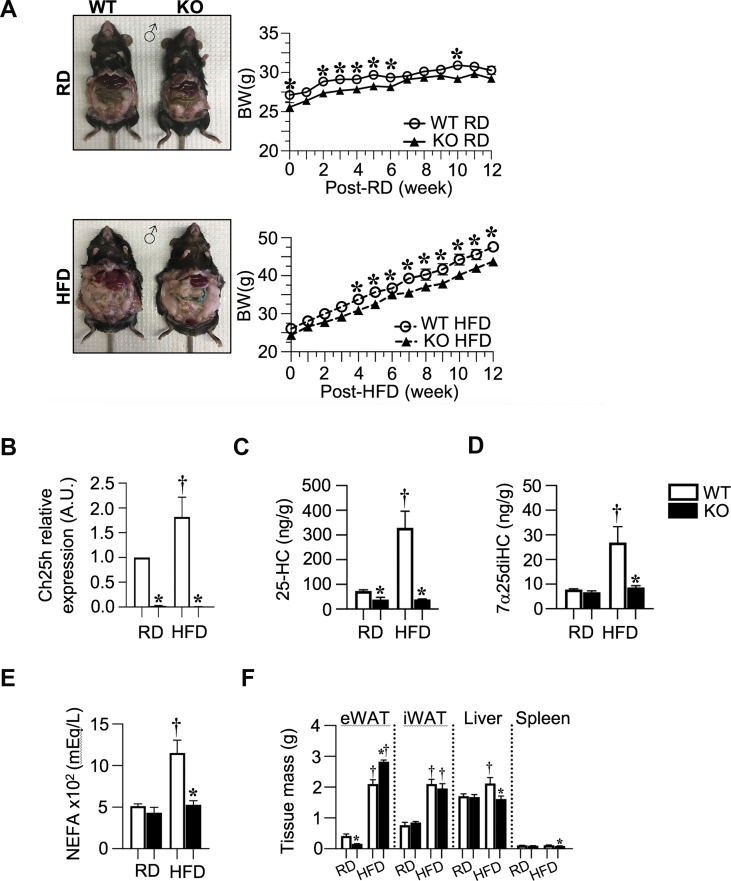
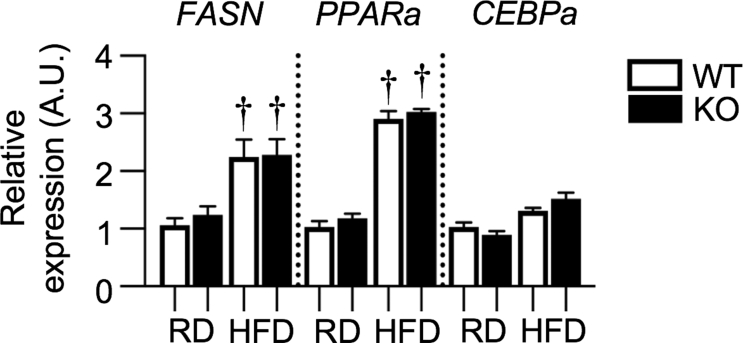
Figure 3 DIO-Ch25h knock-out mice are protected from BW gain and display increased adipose tissue mass. HFD induces Ch25h mRNA expression and 25-Hydroxycholesterol increase in mouse eWAT.A) Representative mice and BW curve in five-month-old Ch25h WT and KO mice fed a RD and HFD for 12 weeks starting at 9 weeks of age (N = 8/10 mice were used per each genotype and diet). B-D) The effect of high-fat diet was studied on the expression of Ch25h mRNA and the level of its produced oxysterol (25-HC) in epididymal white adipose tissue (eWAT) from RD and HFD fed Ch25h WT and KO (C57Bl/6j) male mice. QRT-PCR was conducted in duplicates (N = 5/group) and Ch25h expression was normalized to Arbp1. LC-MS/MS was conducted onto eWAT homogenates. 25-Hydroxycholesterol and 7α25dihydroxycholesterol were normalized by protein content of each homogenate and per total pad mass (N = 4/group). E) NEFA levels at fasting (o/n). F.) Tissue mass (g). Values are expressed as mean ± SEM. ∗P ≤ 0.05 Ch25h WT versus KO; †P ≤ 0.05 RD versus HFD/per each genotype.
Figure 3 DIO-Ch25h knock-out mice are protected from BW gain and display increased adipose tissue mass. HFD induces Ch25h mRNA expression and 25-Hydroxycholesterol increase in mouse eWAT.A) Representative mice and BW curve in five-month-old Ch25h WT and KO mice fed a RD and HFD for 12 weeks starting at 9 weeks of age (N = 8/10 mice were used per each genotype and diet). B-D) The effect of high-fat diet was studied on the expression of Ch25h mRNA and the level of its produced oxysterol (25-HC) in epididymal white adipose tissue (eWAT) from RD and HFD fed Ch25h WT and KO (C57Bl/6j) male mice. QRT-PCR was conducted in duplicates (N = 5/group) and Ch25h expression was normalized to Arbp1. LC-MS/MS was conducted onto eWAT homogenates. 25-Hydroxycholesterol and 7α25dihydroxycholesterol were normalized by protein content of each homogenate and per total pad mass (N = 4/group). E) NEFA levels at fasting (o/n). F.) Tissue mass (g). Values are expressed as mean ± SEM. ∗P ≤ 0.05 Ch25h WT versus KO; †P ≤ 0.05 RD versus HFD/per each genotype.CC BY-NC-ND · PubMed Central
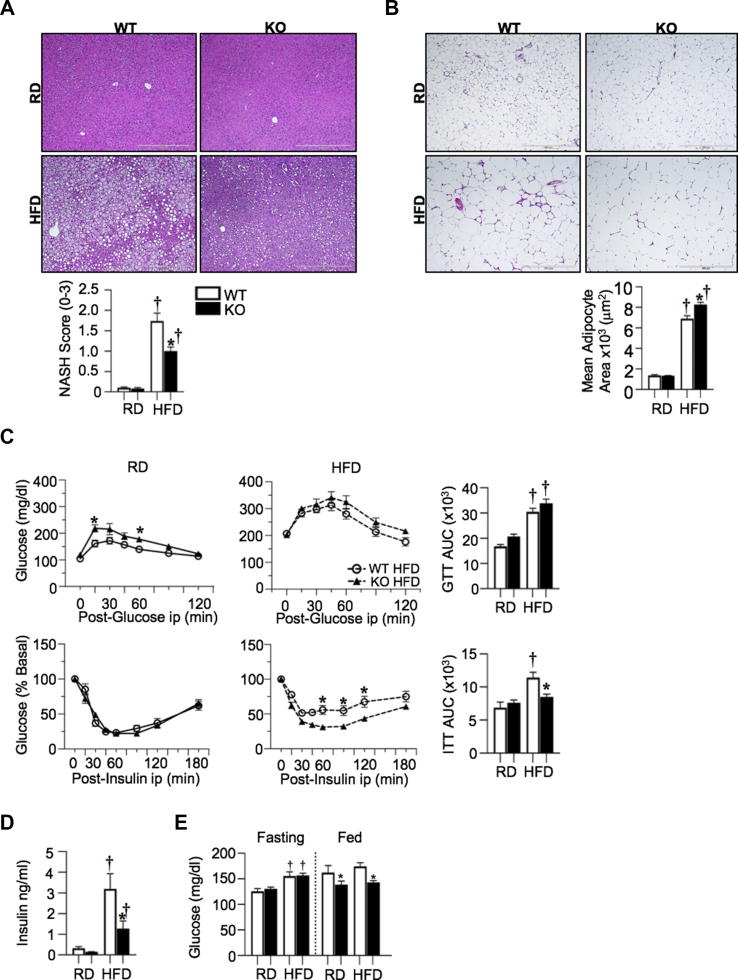
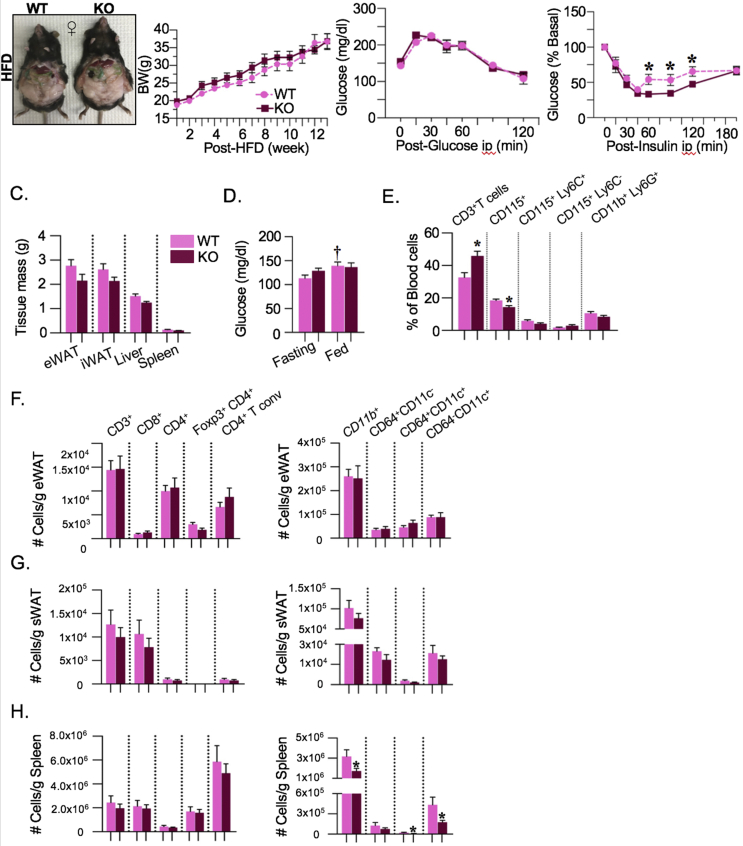
Figure 4 HFD-fed Ch25h knock-out mice display improved insulin action. DIO-Ch25h knock-out mice display less steatosis and increased adipose tissue expandability accompanied by less inflammatory gene expression. A) H&E stain in liver and NASH-score (N = 3/group). B) H&E stain in epididymal white adipose (N = 5/group). Images were collected onto a 10X field. Average adipocyte size was evaluated in the same samples. C) In vivo test for glucose clearance and insulin action post glucose and insulin ip injection (N = 8/10/group). AUC graphs are reported. D) Insulin levels at fasting (o/n). E) Glucose levels at fasting (6h) and fed state. Values are expressed as mean ± SEM. ∗P ≤ 0.05 Ch25h WT versus KO; †P ≤ 0.05 RD versus HFD/per each genotype.
Figure 4 HFD-fed Ch25h knock-out mice display improved insulin action. DIO-Ch25h knock-out mice display less steatosis and increased adipose tissue expandability accompanied by less inflammatory gene expression. A) H&E stain in liver and NASH-score (N = 3/group). B) H&E stain in epididymal white adipose (N = 5/group). Images were collected onto a 10X field. Average adipocyte size was evaluated in the same samples. C) In vivo test for glucose clearance and insulin action post glucose and insulin ip injection (N = 8/10/group). AUC graphs are reported. D) Insulin levels at fasting (o/n). E) Glucose levels at fasting (6h) and fed state. Values are expressed as mean ± SEM. ∗P ≤ 0.05 Ch25h WT versus KO; †P ≤ 0.05 RD versus HFD/per each genotype.CC BY-NC-ND · PubMed Central
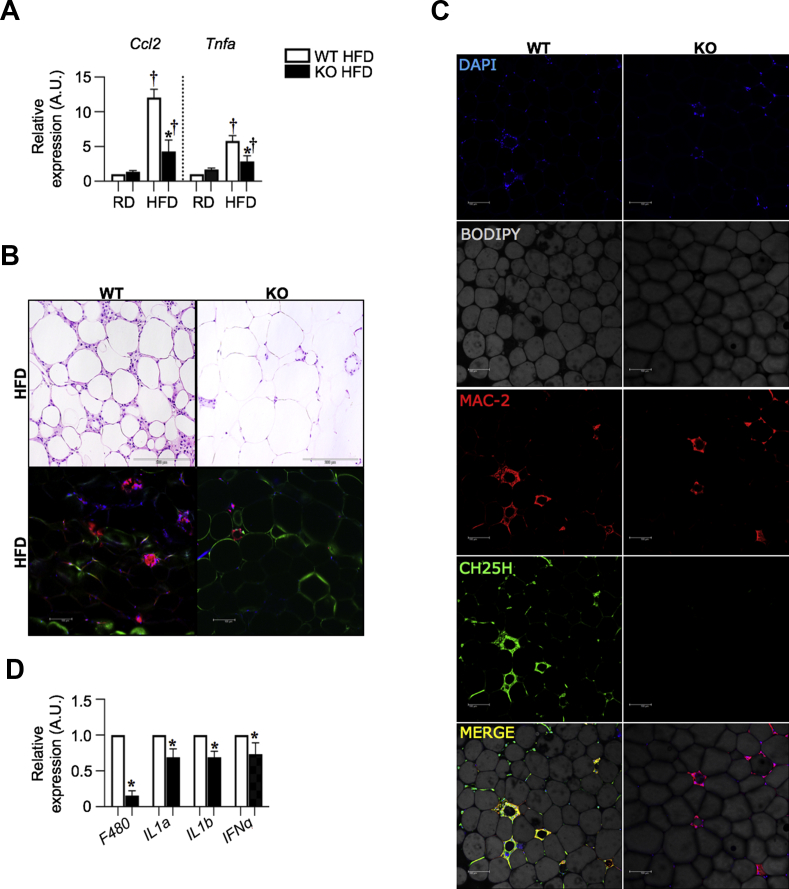
Figure 5 HFD-fed Ch25h knock-out mice display less ATM accumulation and inflammation in epididymal adipose tissue. A) QRT-PCR for mRNA expression of Mcp1 and Tnfα genes in eWAT. Tissue were harvested at fed state. mRNA was analyzed in duplicate and normalized to Arpb (N = 5/group). B) H&E stain and confocal microscopy in epididymal white adipose tissue sections of representative Ch25h WT and KO male mice fed HFD showing less CLS formation in KOs onto 20X field (N = 3/group). Staining with MAC-2/macrophages (red); DAPI/nuclei (bleu); Caveolin/adipocytes (green) onto 20X field (N = 3/group). C) Confocal microscopy in epididymal white adipose tissue sections of Ch25h WT and Ch25h KO male mice fed HFD (N = 3/group). Staining with DAPI/nuclei (bleu), BODIPY/adipocytes (grey), MAC-2/macrophages (red), Ch25h (green) onto a 20X field. D) Effect of Ch25h ablation on the mRNA expression of inflammatory genes in eWAT upon HFD. Tissue were harvested at fed state. mRNA was analyzed in duplicate and normalized to Arpb (N = 5/group). Values are expressed as mean ± SEM.∗P ≤ 0.05 Ch25h WT versus KO.
Figure 5 HFD-fed Ch25h knock-out mice display less ATM accumulation and inflammation in epididymal adipose tissue. A) QRT-PCR for mRNA expression of Mcp1 and Tnfα genes in eWAT. Tissue were harvested at fed state. mRNA was analyzed in duplicate and normalized to Arpb (N = 5/group). B) H&E stain and confocal microscopy in epididymal white adipose tissue sections of representative Ch25h WT and KO male mice fed HFD showing less CLS formation in KOs onto 20X field (N = 3/group). Staining with MAC-2/macrophages (red); DAPI/nuclei (bleu); Caveolin/adipocytes (green) onto 20X field (N = 3/group). C) Confocal microscopy in epididymal white adipose tissue sections of Ch25h WT and Ch25h KO male mice fed HFD (N = 3/group). Staining with DAPI/nuclei (bleu), BODIPY/adipocytes (grey), MAC-2/macrophages (red), Ch25h (green) onto a 20X field. D) Effect of Ch25h ablation on the mRNA expression of inflammatory genes in eWAT upon HFD. Tissue were harvested at fed state. mRNA was analyzed in duplicate and normalized to Arpb (N = 5/group). Values are expressed as mean ± SEM.∗P ≤ 0.05 Ch25h WT versus KO.CC BY-NC-ND · PubMed Central
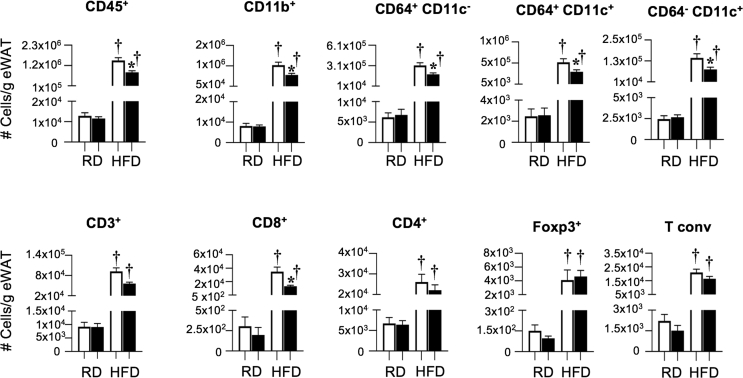
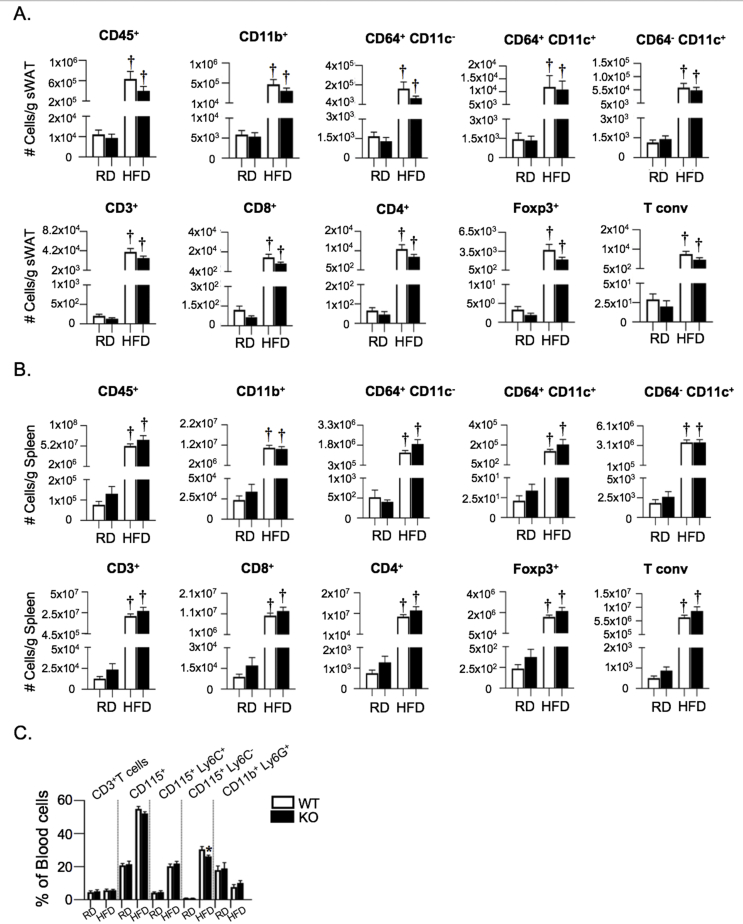
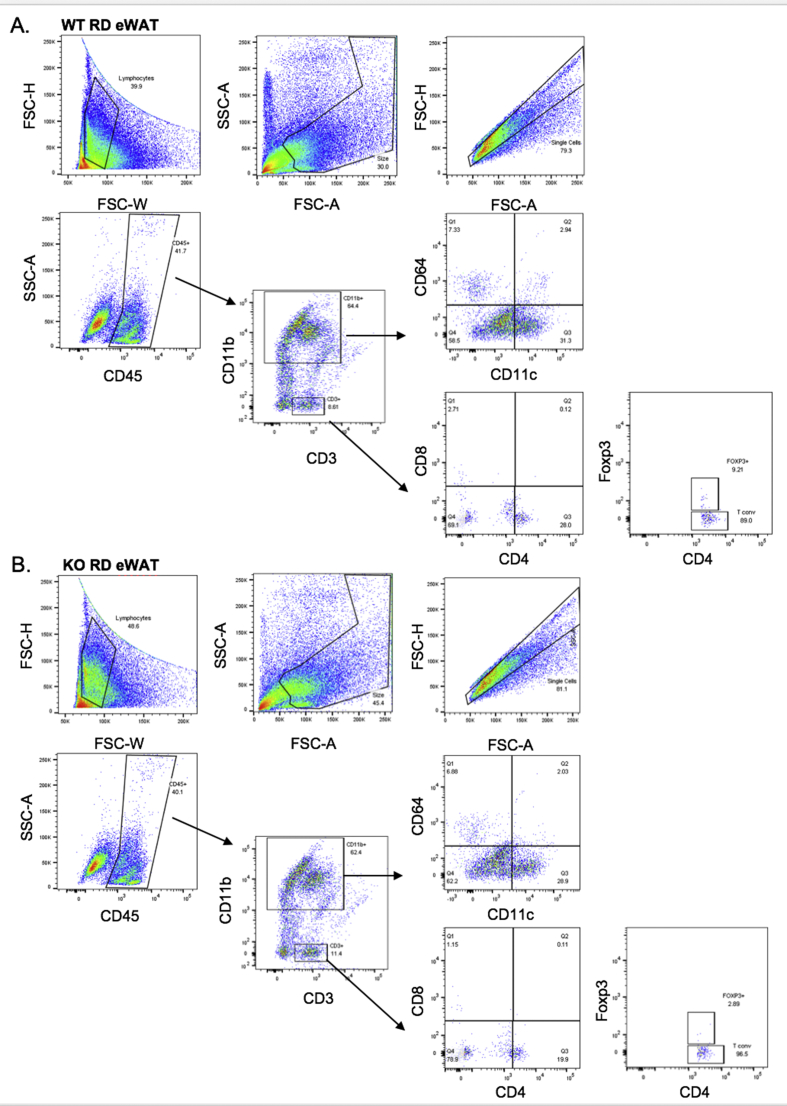
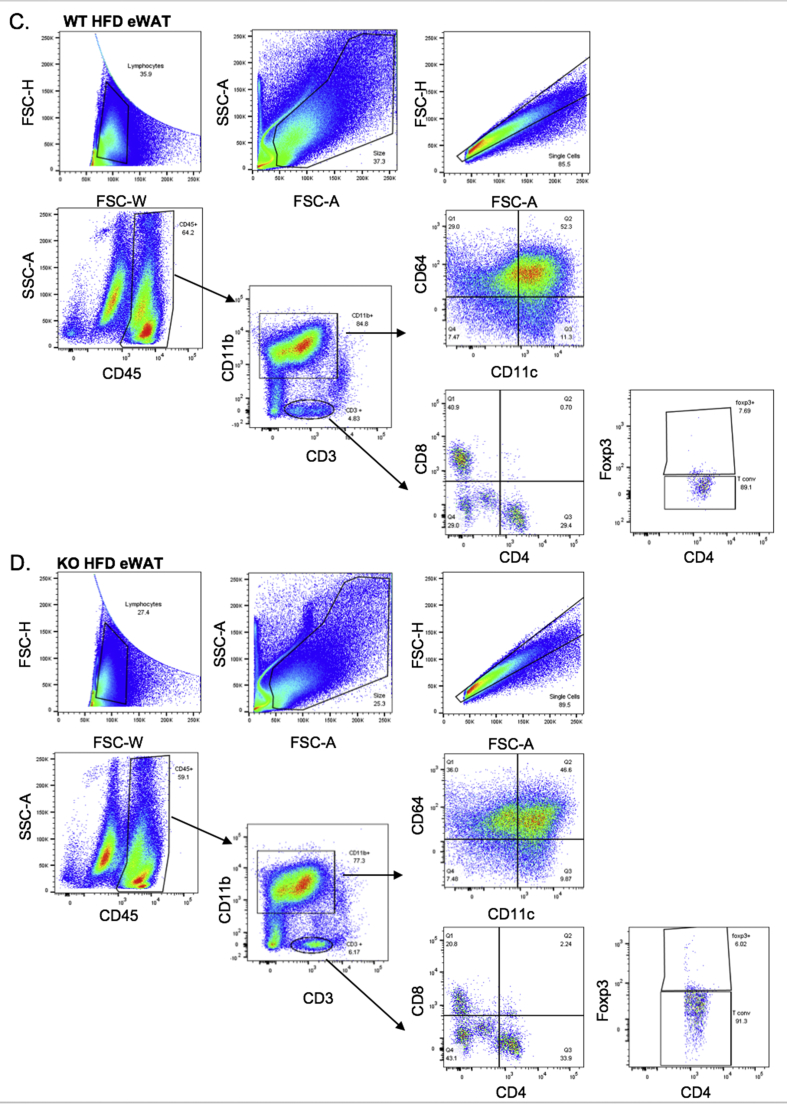
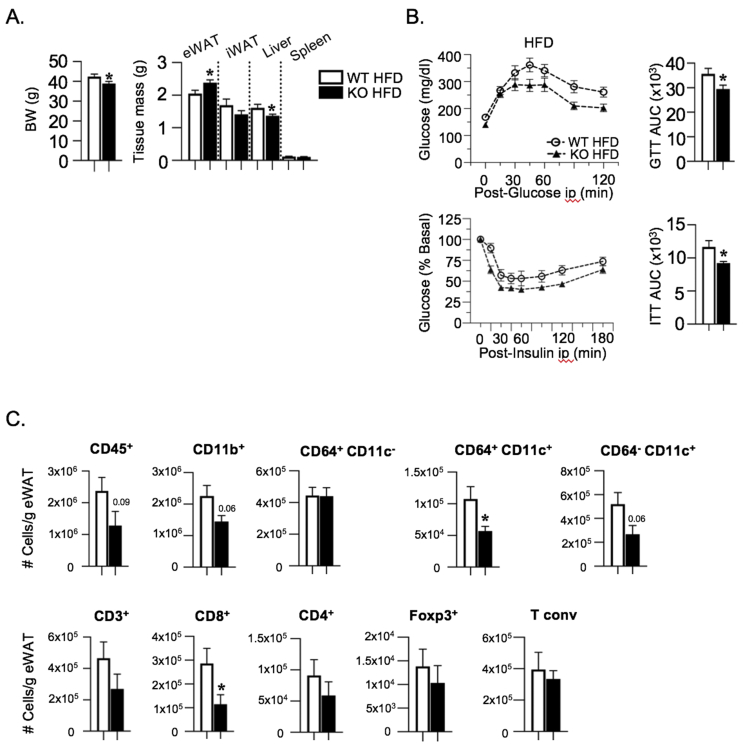
Figure 6 Immunologic profiling in Ch25h knock-out mice displays decreased pro-inflammatory ATMs and CD8+ T cells in eWAT. Stromal vascular fraction (SVF) from epididymal white adipose tissue of obese Ch25h WT and KO male mice was analyzed by FACS (N = 8–10/group). FACS plot data of ATM populations and CD4+, CD8+ T cells are shown. Cell number was normalized to total tissue mass.
Figure 6 Immunologic profiling in Ch25h knock-out mice displays decreased pro-inflammatory ATMs and CD8+ T cells in eWAT. Stromal vascular fraction (SVF) from epididymal white adipose tissue of obese Ch25h WT and KO male mice was analyzed by FACS (N = 8–10/group). FACS plot data of ATM populations and CD4+, CD8+ T cells are shown. Cell number was normalized to total tissue mass.CC BY-NC-ND · PubMed Central
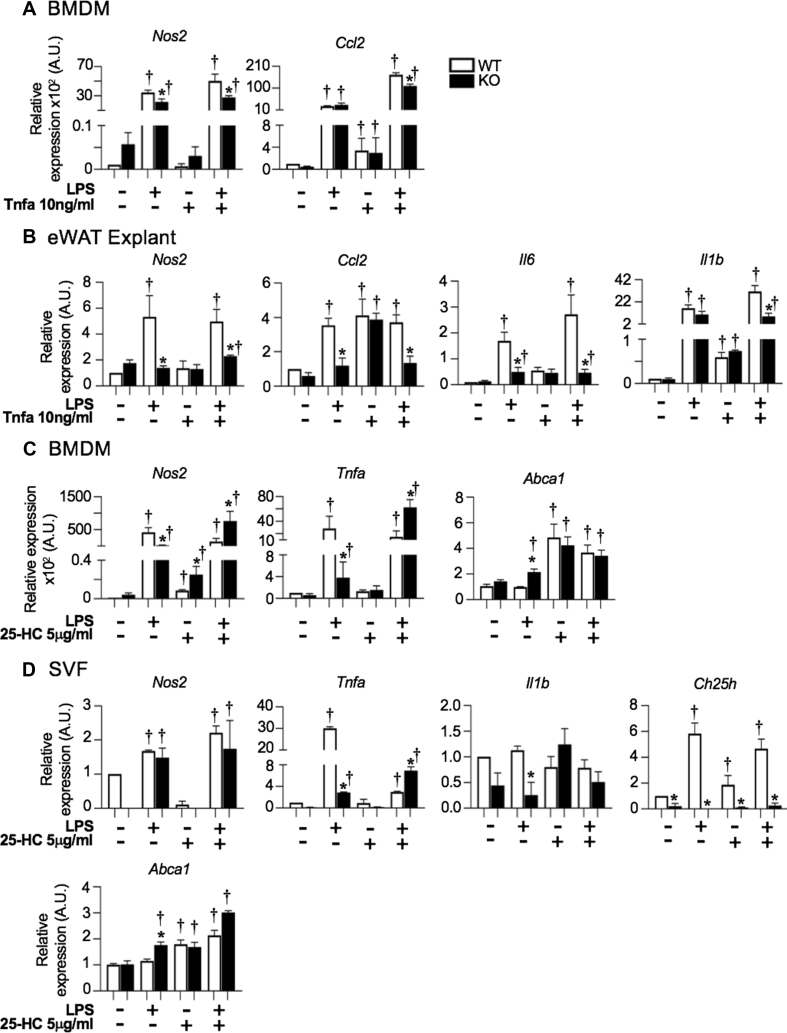
Figure 7 Effect of LPS-Tnfα and 25-HC on the mRNA levels of inflammatory genes in BMDMs, eWAT explants and SVF cells from Ch25h wild-types and knock-outs. Effect of LPS and Tnfα on the mRNA expression of inflammatory genes in A) BMDMs. and B) eWAT explants. Effect of 25-Hydroxycholesterol on the mRNA expression of inflammatory genes in C) BMDMs, D) eWAT-derived SVF cells. BMDMs, SVF of eWAT were obtained from 4-month-old RD fed Ch25h WT and KO male mice. Cells and tissues were treated with either vehicle alone (Veh) or with lipopolysaccharide (LPS 100 ng/ml for 8 h) or with tumor necrosis factor alpha (Tnfα 10 ng/ml for 8 h) alone or in combination (n = 3 wells/genotype/treatment). In the other experiment, 25-Hydroxycholesterol (25-HC 5 μg/ml for 8 h) was added with/without LPS in replacement of Tnfα. mRNA was analyzed in duplicate and normalized to Arpb. Values are expressed as mean ± SEM. †P < 0.05 treatment versus Veh; ∗P ≤ 0.05 Ch25h WT versus KO.
Figure 7 Effect of LPS-Tnfα and 25-HC on the mRNA levels of inflammatory genes in BMDMs, eWAT explants and SVF cells from Ch25h wild-types and knock-outs. Effect of LPS and Tnfα on the mRNA expression of inflammatory genes in A) BMDMs. and B) eWAT explants. Effect of 25-Hydroxycholesterol on the mRNA expression of inflammatory genes in C) BMDMs, D) eWAT-derived SVF cells. BMDMs, SVF of eWAT were obtained from 4-month-old RD fed Ch25h WT and KO male mice. Cells and tissues were treated with either vehicle alone (Veh) or with lipopolysaccharide (LPS 100 ng/ml for 8 h) or with tumor necrosis factor alpha (Tnfα 10 ng/ml for 8 h) alone or in combination (n = 3 wells/genotype/treatment). In the other experiment, 25-Hydroxycholesterol (25-HC 5 μg/ml for 8 h) was added with/without LPS in replacement of Tnfα. mRNA was analyzed in duplicate and normalized to Arpb. Values are expressed as mean ± SEM. †P < 0.05 treatment versus Veh; ∗P ≤ 0.05 Ch25h WT versus KO.CC BY-NC-ND · PubMed Central
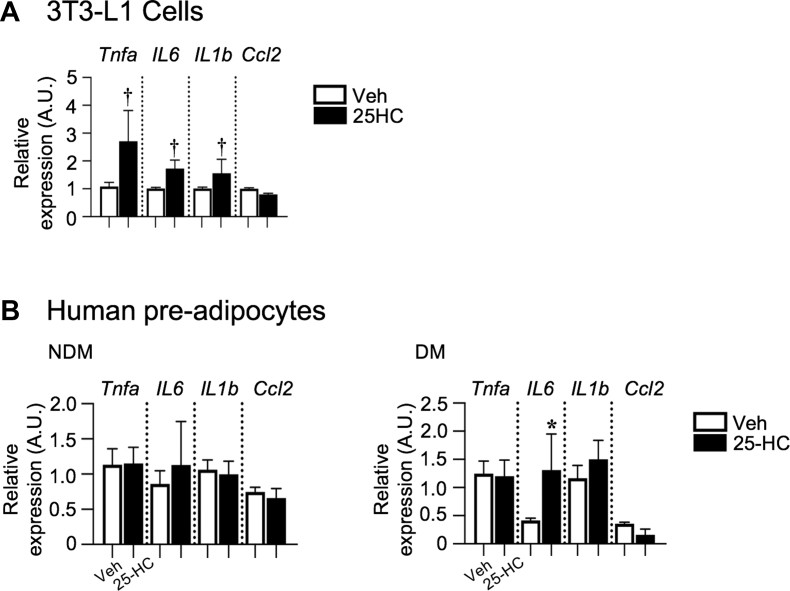
Figure 8 Effect of 25-HC on the mRNA levels of inflammatory genes in murine and human pre-adipocytes. A) 3T3-L1 cells and B) human pre-adipocytes from VAT of NDM and DM subjects. Not differentiated cells were treated with either vehicle alone (Veh) or with 25-Hydroxycholesterol (25-HC 5 μg/ml for 8 h). mRNA was analyzed in duplicate and normalized to PPIA. Values are expressed as mean ± SEM. ∗P < 0.05 treatment versus Veh.
Figure 8 Effect of 25-HC on the mRNA levels of inflammatory genes in murine and human pre-adipocytes. A) 3T3-L1 cells and B) human pre-adipocytes from VAT of NDM and DM subjects. Not differentiated cells were treated with either vehicle alone (Veh) or with 25-Hydroxycholesterol (25-HC 5 μg/ml for 8 h). mRNA was analyzed in duplicate and normalized to PPIA. Values are expressed as mean ± SEM. ∗P < 0.05 treatment versus Veh.CC BY-NC-ND · PubMed Central
ESM Fig 1
ESM Fig 1 CC BY-NC-ND · PubMed Central
ESM Fig 2 2
ESM Fig 2 2CC BY-NC-ND · PubMed Central
ESM Fig 3 3
ESM Fig 3 3CC BY-NC-ND · PubMed Central
ESM Fig 4A-B 4
ESM Fig 4A-B 4CC BY-NC-ND · PubMed Central
ESM Fig 4C-D 5
ESM Fig 4C-D 5CC BY-NC-ND · PubMed Central
ESM Fig 5 6
ESM Fig 5 6CC BY-NC-ND · PubMed Central
ESM Fig 6 7
ESM Fig 6 7CC BY-NC-ND · PubMed Central
ESM Fig 7 8
ESM Fig 7 8CC BY-NC-ND · PubMed Central

Verification

Claims the paper makes

The claims and statistics of this paper haven’t been checked yet.

Run the check — free, no account needed. It reads the open-access text and checks the sources it cites.

A few free checks a day · papers already verified open instantly · results are public

Claims other papers make about this one

Each is checked against this paper’s own text: does it say what the citing paper says it does?

Self-check

Percentages, sums and reported differences re-computed from the paper’s own numbers.

The self-check needs the paper’s full text.

Citations

Cites

Show all 9 references

Research works printed but not linked: 43

  1. Maffetone, 2016, Overfat and underfat: new terms and definitions long overdue, Front Public Health, 4, 279
  2. Bluher, 2014, Metabolically healthy obesity from childhood to adulthood - does weight status alone matter?, Metabolism, 63, 1084, 10.1016/j.metabol.2014.06.009 · DOI
  3. Kim, 2016, Dynamic cross talk between metabolic organs in obesity and metabolic diseases, Experimental & Molecular Medicine, 48, 10.1038/emm.2015.119 · DOI
  4. Kratz, 2014, Metabolic dysfunction drives a mechanistically distinct proinflammatory phenotype in adipose tissue macrophages, Cell Metabolism, 20, 614, 10.1016/j.cmet.2014.08.010 · DOI
  5. Xu, 2013, Obesity activates a program of lysosomal-dependent lipid metabolism in adipose tissue macrophages independently of classic activation, Cell Metabolism, 18, 816, 10.1016/j.cmet.2013.11.001 · DOI · Paper page
  6. Pecht, 2016, Circulating blood monocyte subclasses and lipid-laden adipose tissue macrophages in human obesity, PloS One, 11, 10.1371/journal.pone.0159350 · DOI
  7. Makki, 2013, Adipose tissue in obesity-related inflammation and insulin resistance: cells, cytokines, and chemokines, ISRN Inflammation, 2013, 139239, 10.1155/2013/139239 · DOI · Paper page
  8. Bertola, 2012, Identification of adipose tissue dendritic cells correlated with obesity-associated insulin-resistance and inducing Th17 responses in mice and patients, Diabetes, 61, 2238, 10.2337/db11-1274 · DOI
  9. Cho, 2014, An MHC II-dependent activation loop between adipose tissue macrophages and CD4+ T cells controls obesity-induced inflammation, Cell Reports, 9, 605, 10.1016/j.celrep.2014.09.004 · DOI
  10. Russo, 2018, Properties and functions of adipose tissue macrophages in obesity, Immunology, 10.1111/imm.13002 · DOI
  11. Li, 2017, KLF4 regulation of Ch25h and LXR mitigates atherosclerosis susceptibility, Circulation
  12. Dankel, 2010, Switch from stress response to homeobox transcription factors in adipose tissue after profound fat loss, PloS One, 5, 10.1371/journal.pone.0011033 · DOI
  13. Diczfalusy, 2009, Marked upregulation of cholesterol 25-hydroxylase expression by lipopolysaccharide, The Journal of Lipid Research, 50, 2258, 10.1194/jlr.M900107-JLR200 · DOI · Paper page
  14. Gold, 2014, 25-Hydroxycholesterol acts as an amplifier of inflammatory signaling, Proceedings of the National Academy of Sciences of the United States of America, 111, 10666, 10.1073/pnas.1404271111 · DOI · Paper page
  15. Liu, 2013, Interferon-inducible cholesterol-25-hydroxylase broadly inhibits viral entry by production of 25-hydroxycholesterol, Immunity, 38, 92, 10.1016/j.immuni.2012.11.005 · DOI · Paper page
  16. Song, 2017, Cholesterol 25-hydroxylase is an interferon-inducible factor that protects against porcine reproductive and respiratory syndrome virus infection, Veterinary Microbiology, 210, 153, 10.1016/j.vetmic.2017.09.011 · DOI
  17. Liu, 2018, 25-Hydroxycholesterol activates the expression of cholesterol 25-hydroxylase in an LXR-dependent mechanism, The Journal of Lipid Research, 59, 439, 10.1194/jlr.M080440 · DOI
  18. Li, 2017, 25-Hydroxycholesterol protects host against zika virus infection and its associated microcephaly in a mouse model, Immunity, 46, 446, 10.1016/j.immuni.2017.02.012 · DOI
  19. Noebauer, 2017, Hepatic cholesterol-25-hydroxylase overexpression improves systemic insulin sensitivity in mice, Journal of Diabetes Research, 2017, 4108768, 10.1155/2017/4108768 · DOI
  20. Tuong, 2013, Disruption of Roralpha1 and cholesterol 25-hydroxylase expression attenuates phagocytosis in male Roralphasg/sg mice, Endocrinology, 154, 140, 10.1210/en.2012-1889 · DOI · Paper page
  21. Tuong, 2016, RORalpha and 25-hydroxycholesterol crosstalk regulates lipid droplet homeostasis in macrophages, PloS One, 11, 10.1371/journal.pone.0147179 · DOI
  22. Choi, 2019, The CH25H-CYP7B1-RORalpha axis of cholesterol metabolism regulates osteoarthritis, Nature, 566, 254, 10.1038/s41586-019-0920-1 · DOI
  23. Cho, 2016, Adipose tissue dendritic cells are independent contributors to obesity-induced inflammation and insulin resistance, The Journal of Immunology, 197, 3650, 10.4049/jimmunol.1600820 · DOI
  24. Zamarron, 2017, Macrophage proliferation sustains adipose tissue inflammation in formerly obese mice, Diabetes, 66, 392, 10.2337/db16-0500 · DOI
  25. Martinez-Santibanez, 2014, Imaging white adipose tissue with confocal microscopy, Methods in Enzymology, 537, 17, 10.1016/B978-0-12-411619-1.00002-1 · DOI · Paper page
  26. Muir, 2016, Adipose tissue fibrosis, hypertrophy, and hyperplasia: correlations with diabetes in human obesity, Obesity, 24, 597, 10.1002/oby.21377 · DOI · Paper page
  27. Cho, 2014, Flow cytometry analyses of adipose tissue macrophages, Methods in Enzymology, 537, 297, 10.1016/B978-0-12-411619-1.00016-1 · DOI
  28. Muir, 2018, Frontline Science: rapid adipose tissue expansion triggers unique proliferation and lipid accumulation profiles in adipose tissue macrophages, Journal of Leukocyte Biology, 103, 615, 10.1002/JLB.3HI1017-422R · DOI
  29. Russo, 2016, Role for hepatic CEACAM1 in regulating fatty acid metabolism along the adipocyte-hepatocyte axis, The Journal of Lipid Research, 57, 2163, 10.1194/jlr.M072066 · DOI
  30. Janowski, 1996, An oxysterol signalling pathway mediated by the nuclear receptor LXR alpha, Nature, 383, 728, 10.1038/383728a0 · DOI · Paper page
  31. Park, 2010, Cholesterol 25-hydroxylase production by dendritic cells and macrophages is regulated by type I interferons, Journal of Leukocyte Biology, 88, 1081, 10.1189/jlb.0610318 · DOI
  32. Wentworth, 2010, Pro-inflammatory CD11c+CD206+ adipose tissue macrophages are associated with insulin resistance in human obesity, Diabetes, 59, 1648, 10.2337/db09-0287 · DOI
  33. Guillemot-Legris, 2016, Obesity is associated with changes in oxysterol metabolism and levels in mice liver, hypothalamus, adipose tissue and plasma, Scientific Reports, 6, 19694, 10.1038/srep19694 · DOI
  34. Wyss, 2019, The EBI2-oxysterol axis promotes the development of intestinal lymphoid structures and colitis, Mucosal Immunology, 12, 733, 10.1038/s41385-019-0140-x · DOI
  35. Adams, 2004, Cholesterol and 25-hydroxycholesterol inhibit activation of SREBPs by different mechanisms, both involving SCAP and Insigs, Journal of Biological Chemistry, 279, 52772, 10.1074/jbc.M410302200 · DOI
  36. Dong, 2012, Dual functions of Insig proteins in cholesterol homeostasis, Lipids in Health and Disease, 11, 173, 10.1186/1476-511X-11-173 · DOI
  37. Ecker, 2010, Induction of fatty acid synthesis is a key requirement for phagocytic differentiation of human monocytes, Proceedings of the National Academy of Sciences of the United States of America, 107, 7817, 10.1073/pnas.0912059107 · DOI
  38. Prunet, 2006, Multiplexed flow cytometric analyses of pro- and anti-inflammatory cytokines in the culture media of oxysterol-treated human monocytic cells and in the sera of atherosclerotic patients, Cytometry, Part A, 69, 359, 10.1002/cyto.a.20272 · DOI
  39. Koarai, 2012, 25-Hydroxycholesterol enhances cytokine release and Toll-like receptor 3 response in airway epithelial cells, Respiratory Research, 13, 63, 10.1186/1465-9921-13-63 · DOI
  40. Rosklint, 2002, Oxysterols induce interleukin-1beta production in human macrophages, European Journal of Clinical Investigation, 32, 35, 10.1046/j.1365-2362.2002.00931.x · DOI · Paper page
  41. Englund, 2001, 25-hydroxycholesterol induces lipopolysaccharide-tolerance and decreases a lipopolysaccharide-induced TNF-alpha secretion in macrophages, Atherosclerosis, 158, 61, 10.1016/S0021-9150(01)00407-5 · DOI
  42. Wiesner, 2010, Low doses of lipopolysaccharide and minimally oxidized low-density lipoprotein cooperatively activate macrophages via nuclear factor kappa B and activator protein-1: possible mechanism for acceleration of atherosclerosis by subclinical endotoxemia, Circulation Research, 107, 56, 10.1161/CIRCRESAHA.110.218420 · DOI
  43. Choi, 2012, Spleen tyrosine kinase regulates AP-1 dependent transcriptional response to minimally oxidized LDL, PloS One, 7, 10.1371/journal.pone.0032378 · DOI

Cited by

Sorted by citations

Metadata

Authors
Russo, L., Muir, L., Geletka, L., Delproposto, J., Baker, N., Flesher, C., O'Rourke, R., & Lumeng, C. N.
Venue
Molecular Metabolism
Publisher
Elsevier BV
Published
2020-09
Volume
39
Pages
100983
ISSN
2212-8778
Cited by
58
References
9
Language
en
Funders
National Institutes of Health

About these checks

Registry, retraction, Cites and statistics results are computed, not judged, with one exception: a printed reference that no index lists is read once by a model before it counts as a citation error. Claims are extracted by a model and kept only when their quote appears verbatim in the text; each cited source is then checked, with a model’s help, for whether it says what the claim relies on. Those verdicts can be wrong — read the claim’s quote and the cited source before relying on one.

Statistics and arithmetic are recomputed, not judged.

Confidence bands are shown only for fields calibrated on our annotated test set. None is calibrated yet, so no band is shown.

What counts as a claim ›How we measure confidence ›How we check this ›

Are you an author, or do you see a problem with this page? Request a review