

The DOI matches its Crossref record; 55 of the 56 references it cites were found in a registry or an index.
CD36 promotes de novo lipogenesis in hepatocytes through INSIG2-dependent SREBP1 processing
Open accessAbstract
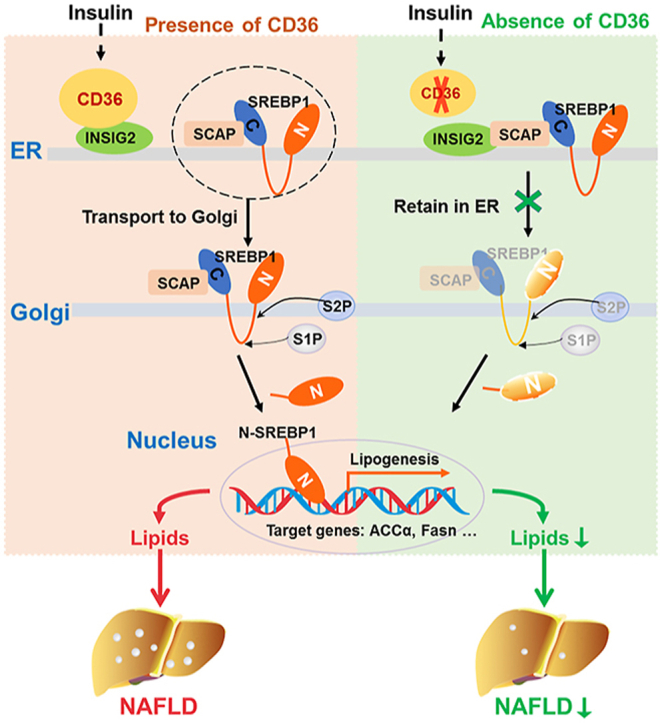
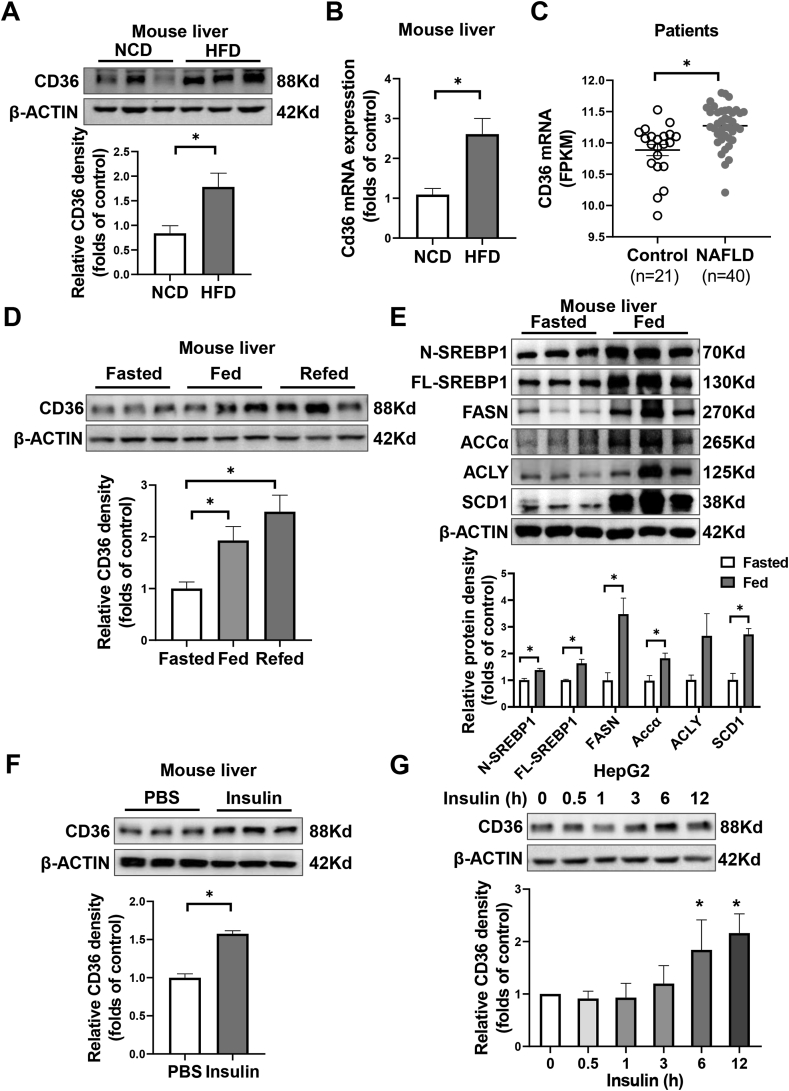
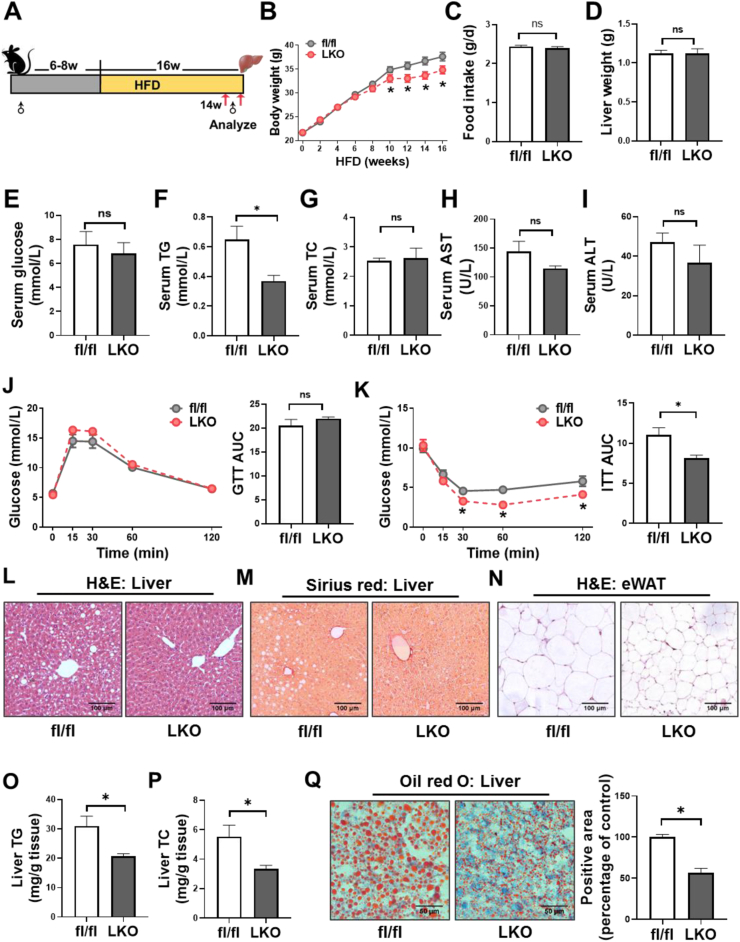
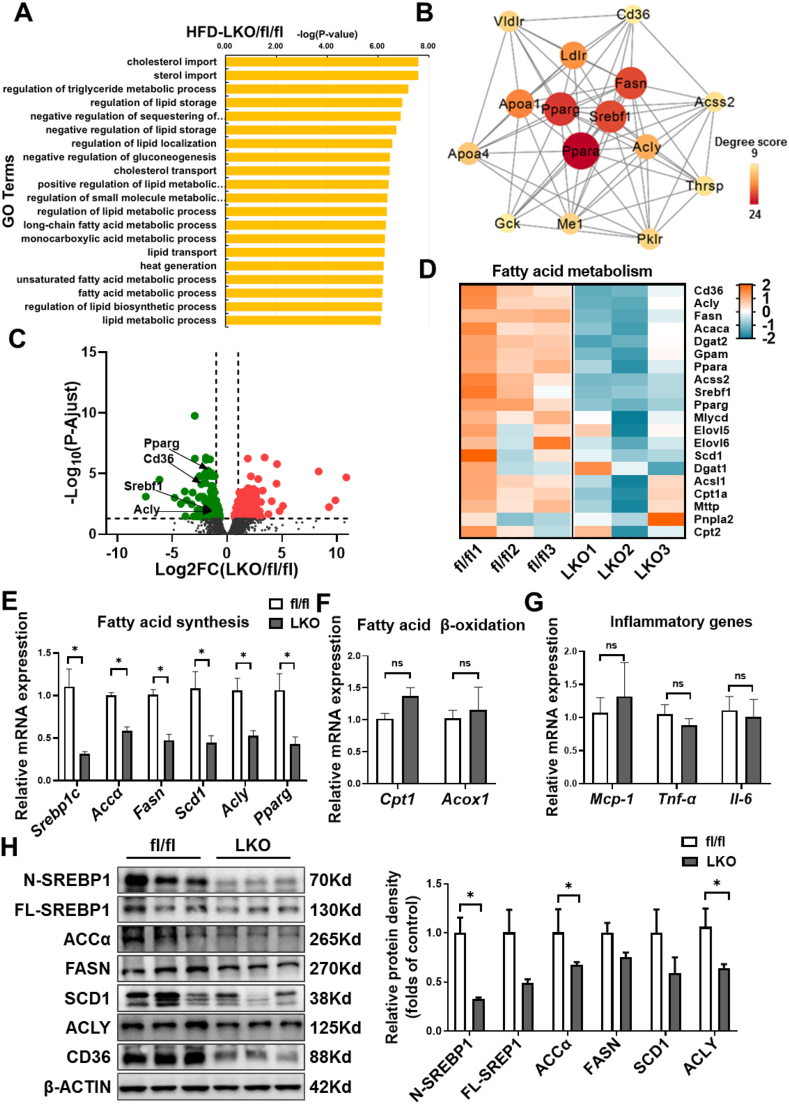
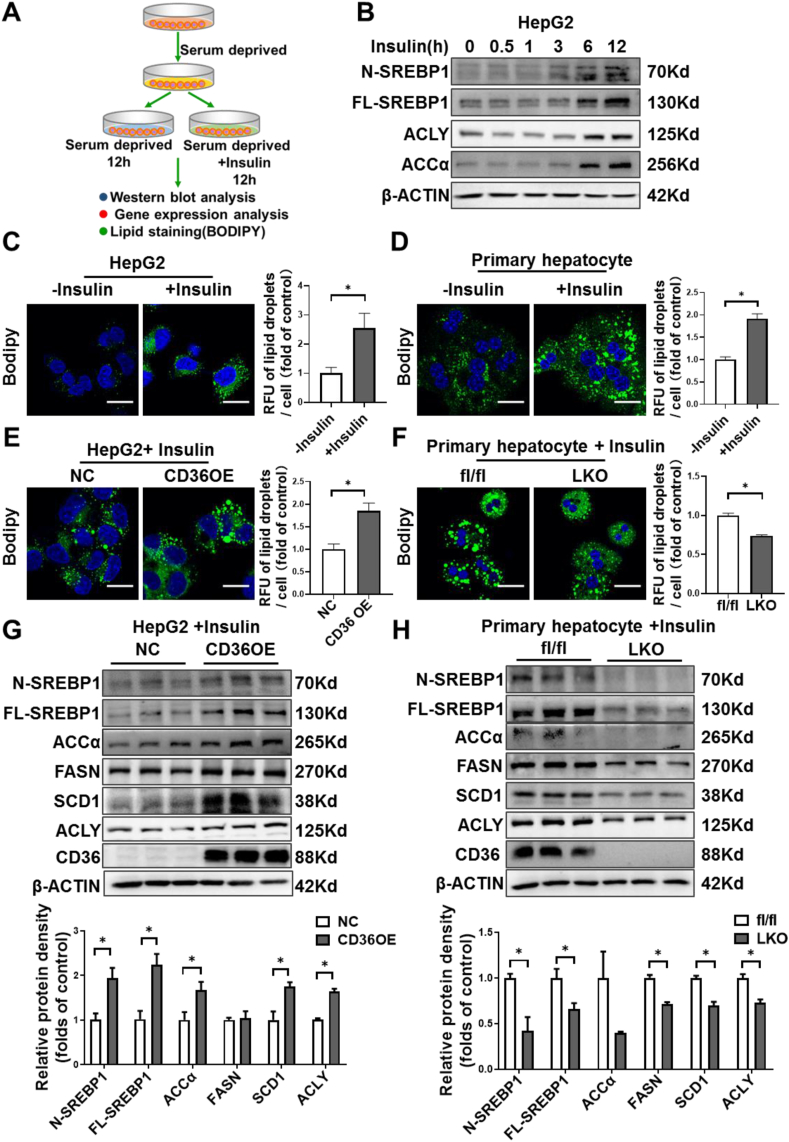
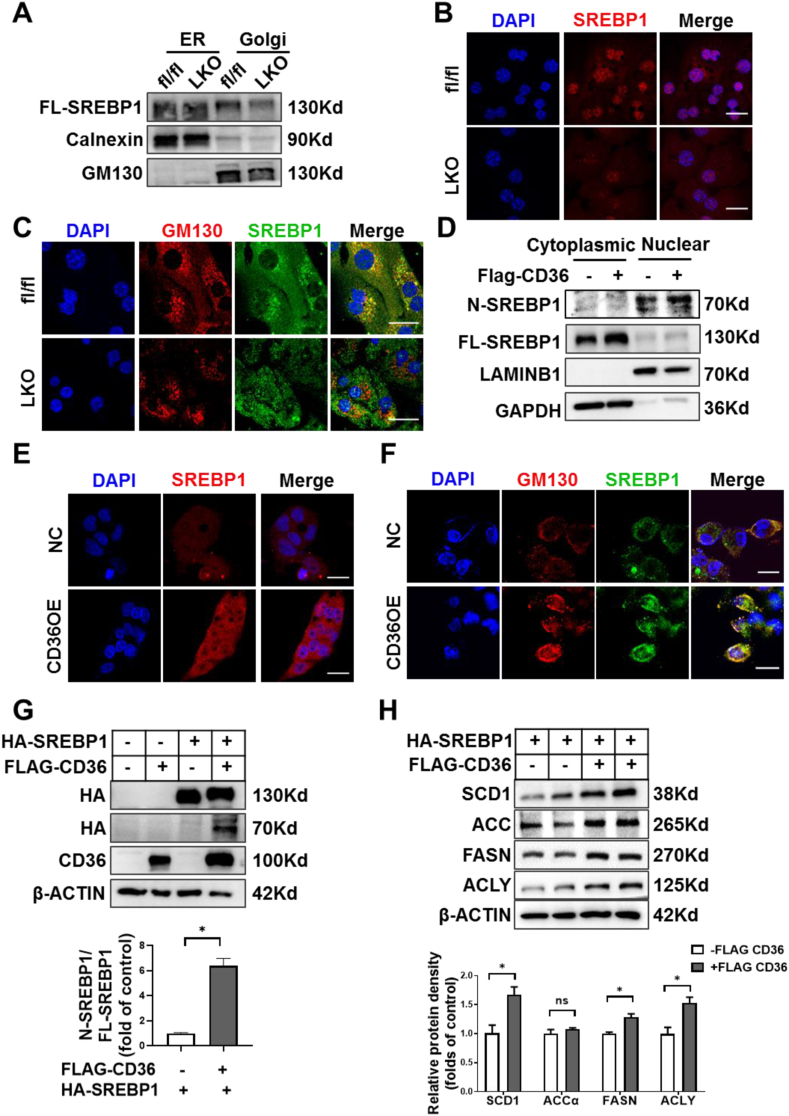
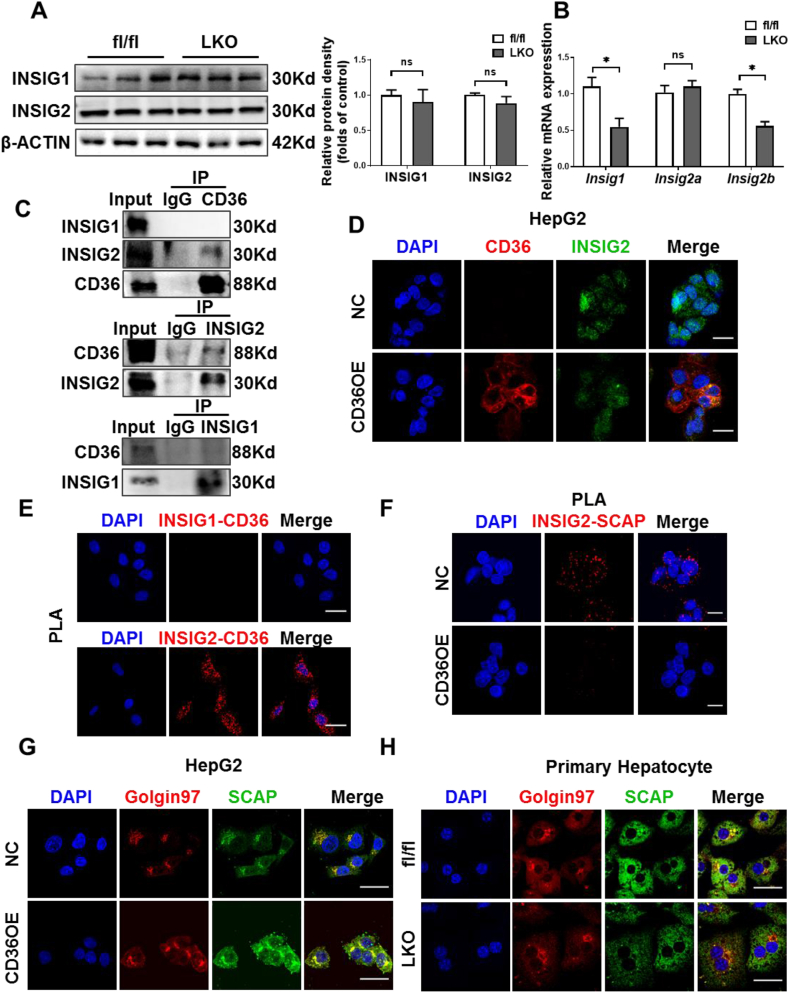
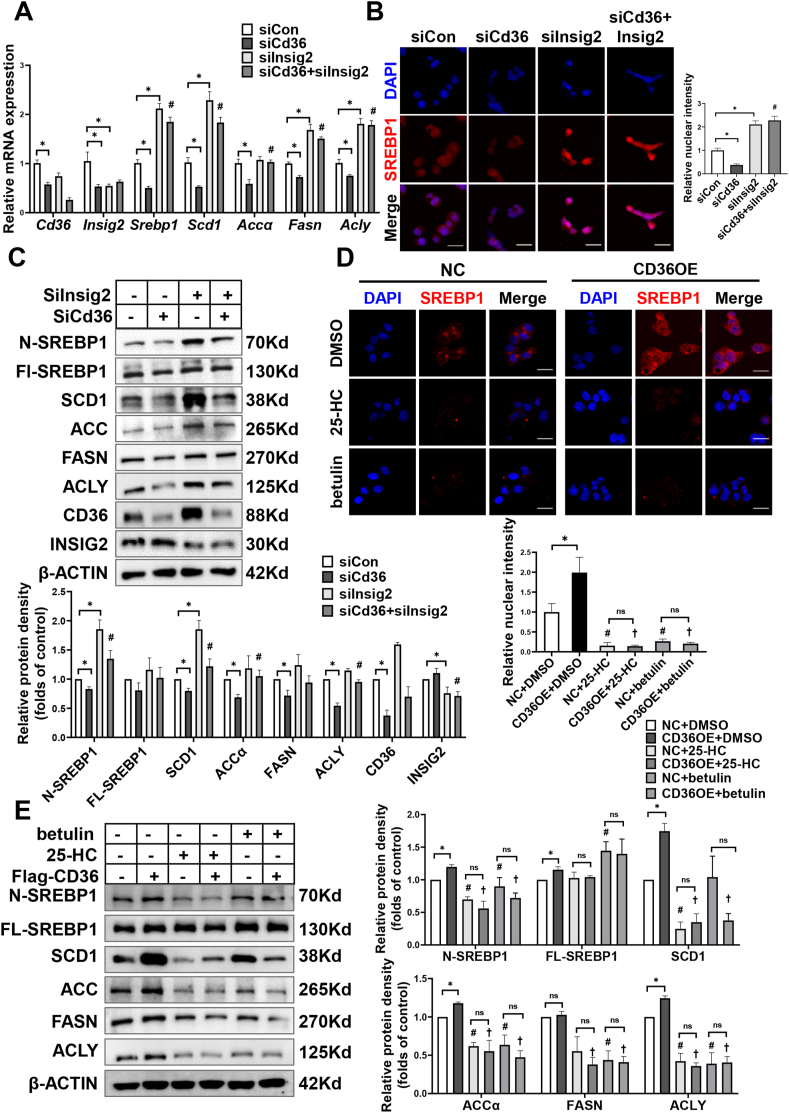
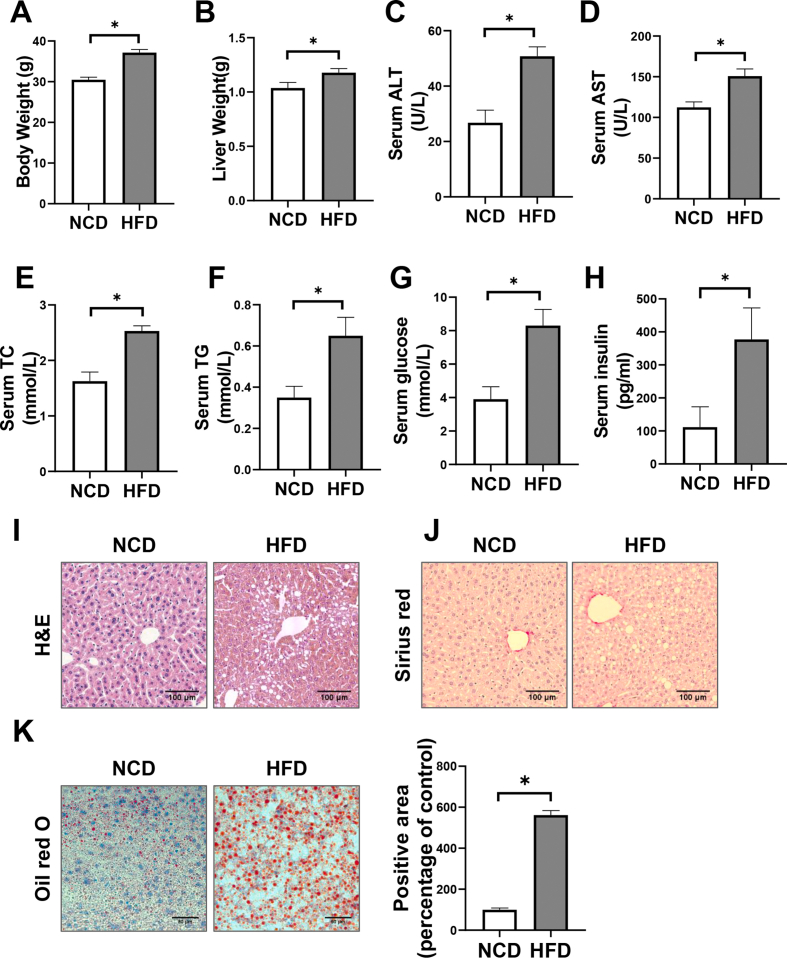
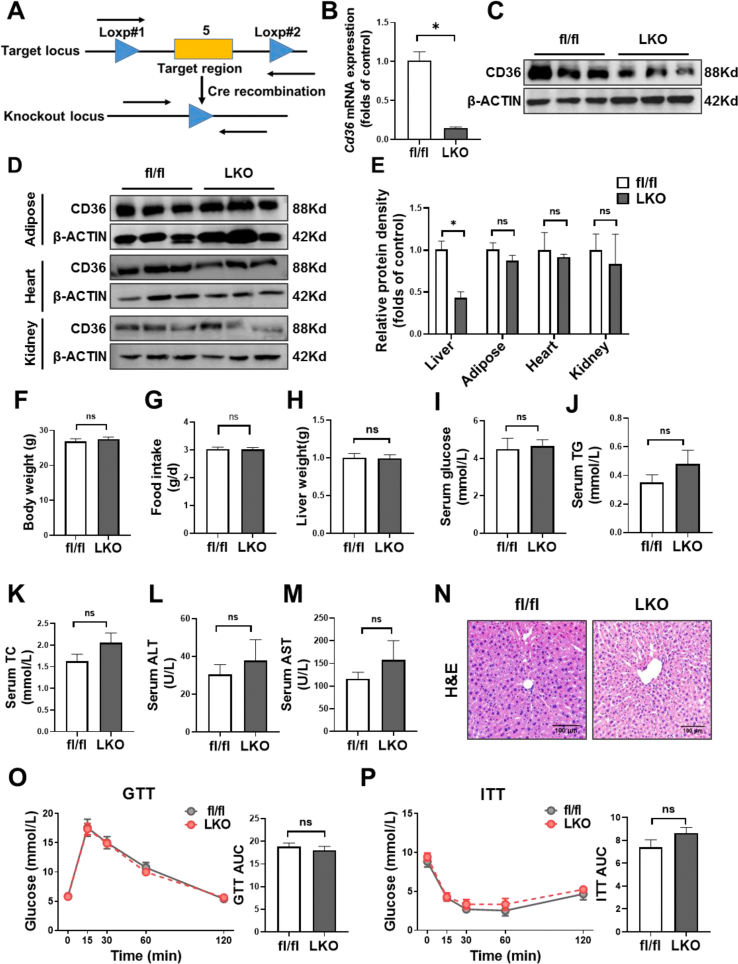
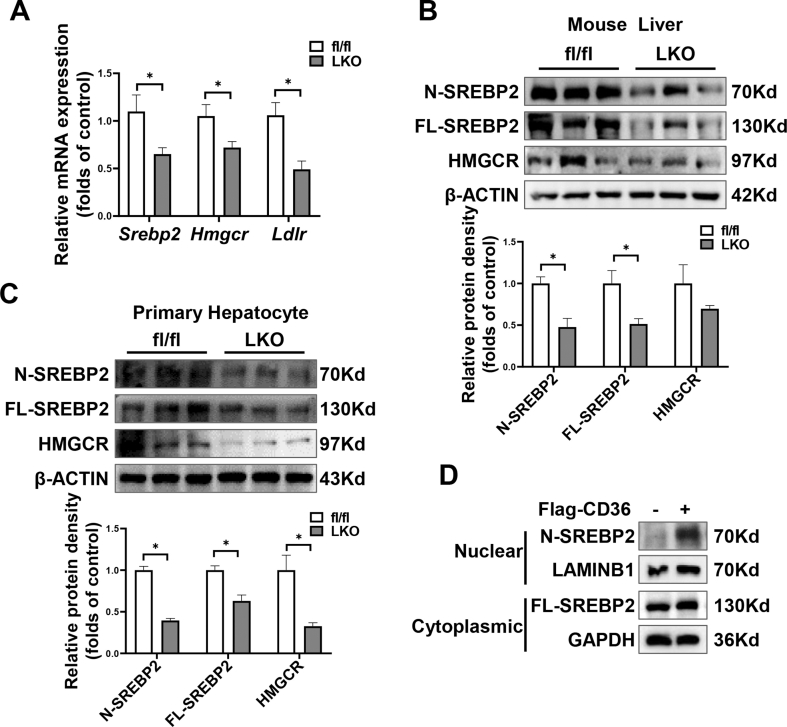
OBJECTIVE: Enhanced de novo lipogenesis (DNL) in hepatocytes is a major contributor to nonalcoholic fatty liver disease (NAFLD). Fatty acid translocase (FAT/CD36) is involved in the pathogenesis of NAFLD through facilitating free fatty acids uptake. Here, we explored the effects of CD36 on DNL and elucidated the underlying mechanisms. METHODS: We generated hepatocyte-specific CD36 knockout (CD36LKO) mice to study in vivo effects of CD36 on DNL under high-fat diet (HFD). Lipid deposition and DNL were analyzed in primary hepatocytes isolated from CD36LKO mice or HepG2 cells with CD36 overexpression. RNA sequence, co-immunoprecipitation, and proximity ligation assay were carried out to determine its role in regulating DNL. RESULTS: Hepatic CD36 expression was upregulated in NAFLD mice and patients, and CD36LKO mice exhibited attenuated HFD-induced hepatic steatosis and insulin resistance. We identified hepatocyte CD36 as a key regulator for DNL in the liver. Sterol regulatory element-binding protein 1 (SREBP1) and its downstream lipogenic enzymes such as FASN, ACCα, and ACLY were significantly downregulated in the liver of HFD-fed CD36LKO mice, whereas overexpression CD36 stimulated insulin-mediated DNL and lipid droplet formation in vitro. Mechanistically, CD36 was activated by insulin and formed a complex with insulin-induced gene-2 (INSIG2) that disrupts the interaction between SREBP cleavage-activating protein (SCAP) and INSIG2, thereby leading to the translocation of SREBP1 from ER to Golgi for processing. Furthermore, treatment with 25-hydroxycholesterol or betulin molecules shown to enhance SCAP-INSIG interaction, reversed the effects of CD36 on SREBP1 cleavage. CONCLUSIONS: Our findings identify a previously unsuspected role of CD36 in the regulation of hepatic lipogenic program through mediating SREBP1 processing by INSIG2, providing additional evidence for targeting CD36 in NAFLD.
Overview
The claims and statistics of this paper haven’t been checked yet.
Run the check — free, no account needed. It reads the open-access text and checks the sources it cites.
Integrity signals
Registry
Cites
Statistics
Figures
Verification
Claims the paper makes
The claims and statistics of this paper haven’t been checked yet.
Run the check — free, no account needed. It reads the open-access text and checks the sources it cites.
Claims other papers make about this one
Each is checked against this paper’s own text: does it say what the citing paper says it does?
The source backs part of the claim, not all of it — or backs it for a different population, condition or comparison.
In the citing paper
“which may influence metabolic dysfunction associated steatotic liver disease (MASLD)48”
From Spatial transcriptomics of healthy and fibrotic human liver at single-cell resolution (2025) · cites this paper as [48]
Experimental — accuracy not yet measured
Self-check
Percentages, sums and reported differences re-computed from the paper’s own numbers.
The self-check needs the paper’s full text.
Citations
Cites
Mechanisms of NAFLD development and therapeutic strategies
Friedman, S. L., Neuschwander-Tetri, B. A., Rinella, M., & Sanyal, A. J. (2018) · Nature Medicine · doi:10.1038/s41591-018-0104-9 · Cited by 4,354
Donnelly, K. L., Smith, C. I., Schwarzenberg, S. J., Jessurun, J., Boldt, M. D., & Parks, E. J. (2005) · Journal of Clinical Investigation · doi:10.1172/jci23621 · Cited by 3,604
Mechanisms and disease consequences of nonalcoholic fatty liver disease
Loomba, R., Friedman, S. L., & Shulman, G. I. (2021) · Cell · doi:10.1016/j.cell.2021.04.015 · Cited by 2,002
Protein Sensors for Membrane Sterols
Goldstein, J. L., DeBose-Boyd, R. A., & Brown, M. S. (2006) · Cell · doi:10.1016/j.cell.2005.12.022 · Cited by 1,517
SREBP-regulated lipid metabolism: convergent physiology - divergent pathophysiology
Shimano, H., & Sato, R. (2017) · Nature Reviews Endocrinology · doi:10.1038/nrendo.2017.91 · Cited by 1,174
Lambert, J. E., Ramos–Roman, M. A., Browning, J. D., & Parks, E. J. (2014) · Gastroenterology · doi:10.1053/j.gastro.2013.11.049 · Cited by 1,069 · cited 1×
“Human isotope-labeling studies demonstrated a threefold increase of DNL contributed to hepatic TG accumulation in patients with NAFLD than those without [5].”
BackgroundGlatz, J. F. C., Luiken, J. J. F. P., & Bonen, A. (2010) · Physiological Reviews · doi:10.1152/physrev.00003.2009 · Cited by 776
A Null Mutation in Murine CD36 Reveals an Important Role in Fatty Acid and Lipoprotein Metabolism
Febbraio, M., Abumrad, N. A., Hajjar, D. P., Sharma, K., Cheng, W., Pearce, S. F. A., & Silverstein, R. L. (1999) · Journal of Biological Chemistry · doi:10.1074/jbc.274.27.19055 · Cited by 769
Role of Dietary Fructose and Hepatic De Novo Lipogenesis in Fatty Liver Disease
Softic, S., Cohen, D. E., & Kahn, C. R. (2016) · Digestive Diseases and Sciences · doi:10.1007/s10620-016-4054-0 · Cited by 709
Hyperlipidemic Effects of Dietary Saturated Fats Mediated through PGC-1β Coactivation of SREBP
Lin, J. D., Yang, R., Tarr, P. T., Wu, P., Handschin, C., Li, S., Yang, W., Pei, L., Uldry, M., Tontonoz, P., et al. (2005) · Cell · doi:10.1016/j.cell.2004.11.043 · Cited by 626
Research works printed but not linked: 1
- Zhang, 2020, The CC genotype of insulin-induced gene 2 rs7566605 is a protective factor of hypercholesteremia susceptible to mild cognitive impairment, especially to the executive function of patients with type 2 diabetes mellitus, BioMed Research International, 2020
Cited by
Sorted by citations
CD36-mediated metabolic crosstalk between tumor cells and macrophages affects liver metastasis
Yang, P., Qin, H., Li, Y., Xiao, A., Zheng, E., Zeng, H., Su, C., Luo, X., Lu, Q., Liao, M., et al. (2022) · Nature Communications · doi:10.1038/s41467-022-33349-y · Cited by 346
Self-citationChen, Y., Du, X., Kuppa, A., Feitosa, M. F., Bielak, L. F., O’Connell, J. R., Musani, S. K., Guo, X., Kahali, B., Chen, V. L., et al. (2023) · Nature Genetics · doi:10.1038/s41588-023-01497-6 · Cited by 215
Self-citationCD36 favours fat sensing and transport to govern lipid metabolism
Li, Y., Huang, X., Yang, G., Xu, K., Yin, Y., Brecchia, G., & Yin, J. (2022) · Progress in Lipid Research · doi:10.1016/j.plipres.2022.101193 · Cited by 151
Self-citationSpatial transcriptomics of healthy and fibrotic human liver at single-cell resolution
Watson, B. R., Paul, B., Rahman, R. U., Amir-Zilberstein, L., Segerstolpe, Å., Epstein, E. T., Murphy, S., Geistlinger, L., Lee, T., Shih, A., et al. (2025) · Nature Communications · doi:10.1038/s41467-024-55325-4 · Cited by 123
The implications of FASN in immune cell biology and related diseases
Xiao, Y., Yang, Y., Xiong, H., & Dong, G. (2024) · Cell Death and Disease · doi:10.1038/s41419-024-06463-6 · Cited by 94
Rao, G., Peng, X., Li, X., An, K., He, H., Fu, X., Li, S., & An, Z. (2023) · Frontiers in Medicine · doi:10.3389/fmed.2023.1294267 · Cited by 93
Excessive Gluconeogenesis Causes the Hepatic Insulin Resistance Paradox and Its Sequelae
Onyango, A. N. (2022) · Heliyon · doi:10.1016/j.heliyon.2022.e12294 · Cited by 80
ZDHHC20 mediated S-palmitoylation of fatty acid synthase (FASN) promotes hepatocarcinogenesis
Mo, Y., Han, Y., Chen, Y., Chun-ling, F., Li, Q., Liu, Z., Xiao, M., & Xu, B. (2024) · Molecular Cancer · doi:10.1186/s12943-024-02195-5 · Cited by 84
Self-citationMejía-Guzmán, J. E., Belmont-Hernández, R. A., Chávez-Tapia, N. C., Uribe, M., & Nuño‐Lámbarri, N. (2025) · International Journal of Molecular Sciences · doi:10.3390/ijms26072959 · Cited by 82
Zhu, C., Huai, Q., Zhang, X., Dai, H., Li, X., & Wang, H. (2022) · International Journal of Biological Sciences · doi:10.7150/ijbs.78525 · Cited by 59
Wang, Y., Li, Z., He, J., & Zhao, Y. (2024) · Nutrients · doi:10.3390/nu16081102 · Cited by 59
Efficacy and underlying mechanisms of berberine against lipid metabolic diseases: a review
Cai, Y., Yang, Q., Yu, Y., Yang, F., Bai, R., & Fan, X. (2023) · Frontiers in Pharmacology · doi:10.3389/fphar.2023.1283784 · Cited by 48
Hwang, J., Lee, S., Okada, J., Liu, L. P., Pessin, J. E., Chua, S. C., Schwartz, G. J., & Jo, Y. (2025) · Nature Communications · doi:10.1038/s41467-025-56328-5 · Cited by 51
Biological Mechanisms and Related Natural Inhibitors of CD36 in Nonalcoholic Fatty Liver
Feng, Y., Sun, W., Sun, F., Yin, G., Liang, P., Chen, S., Liu, X., Jiang, T., & Zhang, F. (2022) · Drug Design Development and Therapy · doi:10.2147/dddt.s386982 · Cited by 41
Feng, X., Zhang, R., Yang, Z., Zhang, K., & Xing, J. (2024) · Journal of Clinical and Translational Hepatology · doi:10.14218/jcth.2024.00019 · Cited by 45
Aranda‐Rivera, A. K., Cruz‐Gregorio, A., Aparicio‐Trejo, O. E., Tapia, E., Sánchez‐Lozada, L. G., García‐Arroyo, F. E., Amador‐Martínez, I., Orozco‐Ibarra, M., Fernández‐Valverde, F., & Pedraza‐Chaverrí, J. (2022) · Antioxidants · doi:10.3390/antiox11101854 · Cited by 39
Betaine Alleviates High-Fat Diet-Induced Disruptionof Hepatic Lipid and Iron Homeostasis in Mice
Li, Y., Jiang, W., Feng, Y. M., Wu, L., Jia, Y., & Zhao, R. (2022) · International Journal of Molecular Sciences · doi:10.3390/ijms23116263 · Cited by 39
Self-citationBacci, M., Lorito, N., Smiriglia, A., Subbiani, A., Bonechi, F., Comito, G., Morriset, L., Botty, R. E., Benelli, M., López-Velazco, J. I., et al. (2024) · Science Translational Medicine · doi:10.1126/scitranslmed.adf9874 · Cited by 39
Pathogenesis of Alcohol-Associated Fatty Liver: Lessons From Transgenic Mice
Ferdouse, A., & Clugston, R. D. (2022) · Frontiers in Physiology · doi:10.3389/fphys.2022.940974 · Cited by 33
Intercellular Mitochondrial Transfer: The Novel Therapeutic Mechanism for Diseases
Liu, H., Mao, H., Ouyang, X., Lu, R., & Li, L. (2024) · Traffic · doi:10.1111/tra.12951 · Cited by 34
Altered lipid metabolism as a predisposing factor for liver metastasis in MASLD
Kim, S. J., & Hyun, J. (2024) · Molecules and Cells · doi:10.1016/j.mocell.2024.100010 · Cited by 30
Current Therapeutical Approaches Targeting Lipid Metabolism in NAFLD
Vitulo, M., Gnodi, E., Rosini, G., Meneveri, R., Giovannoni, R., & Barisani, D. (2023) · International Journal of Molecular Sciences · doi:10.3390/ijms241612748 · Cited by 36
Mao, Q., Lin, B., Zhang, W., Zhang, Y., Zhang, Y., Cao, Q., & Xu, M. (2024) · Frontiers in Pharmacology · doi:10.3389/fphar.2024.1371574 · Cited by 29
Qin, H., Xiao, A., Lu, Q., Li, Y., Luo, X., Zheng, E., Tian, C., Liu, H., Zheng, X., Li, W., et al. (2024) · Journal of Advanced Research · doi:10.1016/j.jare.2024.10.006 · Cited by 29
Self-citationDeng, G.-H., Wu, C.-F., Li, Y.-J., Shi, H., Zhong, W., Hong, M., Li, J., Zhao, J.-M., Liu, C., Qin, M., et al. (2023) · Military Medical Research · doi:10.1186/s40779-023-00487-3 · Cited by 27
Self-citationThe remodeling roles of lipid metabolism in colorectal cancer cells and immune microenvironment
Zhong, J., GUO, J., ZHANG, X., FENG, S., Di, W., WANG, Y., & ZHU, H. (2022) · Oncology Research Featuring Preclinical and Clinical Cancer Therapeutics · doi:10.32604/or.2022.027900 · Cited by 26
Traditional Chinese medicine in the treatment of breast Cancer
Song, P., Liu, T., Zhang, Y., Shao, T., Li, R., Chen, A., Cao, L.-Q., Chen, Z., Guo, W., & Duan, D. (2025) · Molecular Cancer · doi:10.1186/s12943-025-02416-5 · Cited by 28
Bielawiec, P., Dziemitko, S., Konstantynowicz-Nowicka, K., Chabowski, A., Dzięcioł, J. B., & Harasim‐Symbor, E. (2023) · Scientific Reports · doi:10.1038/s41598-023-30872-w · Cited by 26
Guo, Y. X., Wei, Z., Zhang, Y., & Cao, J. (2024) · Animals · doi:10.3390/ani14020204 · Cited by 27
Xie, D., Jiang, Y., Wang, H., Zhu, L., Huang, S., Liu, S., Zhang, W., & Li, T. (2024) · Frontiers in Pharmacology · doi:10.3389/fphar.2024.1441105 · Cited by 23
Dong, L., Lou, W., Xu, C., & Wang, J. (2025) · Journal of Nanobiotechnology · doi:10.1186/s12951-025-03228-x · Cited by 25
Zhang, M., Ji, J., Lei, Y., Qin, F., Tao, Y., Li, N., Bian, J., Li, Z., Lai, M., & Qiu, Z. (2025) · Pharmacological Research · doi:10.1016/j.phrs.2025.107706 · Cited by 23
Zou, J., Qin, X., Tan, D., Shi, L., Liu, X., Wu, Y., & Yu, R. (2022) · Biomedicine & Pharmacotherapy · doi:10.1016/j.biopha.2022.114002 · Cited by 23
Zhou, J., Shi, Y., Yang, C., Lü, S., Zhao, L., Liu, X., Zhou, D., Luo, L., & Yin, Z. (2023) · The Journal of Nutritional Biochemistry · doi:10.1016/j.jnutbio.2023.109404 · Cited by 23
Self-citationObesity and Exercise: New Insights and Perspectives
James, N. M., & Stanford, K. I. (2025) · Endocrine Reviews · doi:10.1210/endrev/bnaf017 · Cited by 20
Dai, W., Hou, Q., & Ye, J. (2025) · Molecular Medicine · doi:10.1186/s10020-025-01304-4 · Cited by 20
van der Zande, H. J. P., Brombacher, E. C., Lambooij, J. M., Pelgrom, L. R., Zawistowska‐Deniziak, A., Patente, T. A., Heieis, G. A., Otto, F., Ozir‐Fazalalikhan, A., Yazdanbakhsh, M., et al. (2023) · JCI Insight · doi:10.1172/jci.insight.157948 · Cited by 17
Guha, S., Sesili, S., Mir, I. H., & Thirunavukkarasu, C. (2022) · Cell Biochemistry and Function · doi:10.1002/cbf.3763 · Cited by 18
Cao, Y., Fang, X., Sun, M., Zhang, Y., Shan, M., Lan, X., Zhu, D., & Luo, H. (2023) · Phytotherapy Research · doi:10.1002/ptr.7932 · Cited by 17
Natural compounds proposed for the management of non-alcoholic fatty liver disease
Merenda, T., Juszczak, F., Ferier, E., Duez, P., Patris, S., Declèves, A., & Nachtergael, A. (2024) · Natural Products and Bioprospecting · doi:10.1007/s13659-024-00445-z · Cited by 18
Bai, Y.-P., Zhang, T., Hu, Z.-Y., Zhang, Y., Wang, D.-G., Zhou, M.-Y., Zhang, Y., Zhang, F., & Kong, X. (2024) · Biochemical Pharmacology · doi:10.1016/j.bcp.2024.116240 · Cited by 18
Arellano-García, L., Milton‐Laskibar, I., Martínez, J. A., Arán‐González, M., & Portillo, M. P. (2024) · BioFactors · doi:10.1002/biof.2116 · Cited by 19
Divergent roles of RIPK3 and MLKL in high-fat diet–induced obesity and MAFLD in mice
Tye, H., Conos, S. A., Djajawi, T. M., Gottschalk, T. A., Abdoulkader, N., Kong, I. Y., Kammoun, H. L., Narayana, V. K., Kratina, T., Speir, M., et al. (2024) · Life Science Alliance · doi:10.26508/lsa.202302446 · Cited by 17
Zhao, G., Zhang, X., Meng, L., Dong, K., Shang, S., Jiang, T., Liu, Z., & Gao, H. (2024) · Oncogene · doi:10.1038/s41388-024-03161-7 · Cited by 16
Li, M., Jia, H., Zhang, L., Chen, P., Wang, S., Mao, Y., & Yang, Z. (2025) · Pharmacological Research · doi:10.1016/j.phrs.2025.107935 · Cited by 16
Liu, Y., Wang, Y., Zhou, J., Li, H., Liu, C., Zhong, B., Liu, J., Liu, L., Zhang, L., & Sun, L. (2025) · Frontiers in Cell and Developmental Biology · doi:10.3389/fcell.2025.1718799 · Cited by 15
García, N. A., Mellergaard, M., Salomón, C., Sepúlveda, P., Kristensen, P. K., & Handberg, A. (2025) · Obesity Reviews · doi:10.1111/obr.70039 · Cited by 19
Fu, Y., Wang, Z., & Qin, H. (2024) · Metabolites · doi:10.3390/metabo14040218 · Cited by 15
Self-citationLi, M., Liang, H., Zhang, J., Chen, J., Xu, S., Zhou, W., Ding, Q., Yang, Y., Zhang, Z., Yao, Y., et al. (2025) · Animal Microbiome · doi:10.1186/s42523-024-00372-x · Cited by 19
Xie, L., Ma, C., Li, X., et al. (2024) · Molecules · doi:10.3390/molecules29102345 · Cited by 14
Zhao, Q.-Q., Lu, S.-W., Guan, Y., Sun, Z.-W., Qiu, S., & Zhang, A.-H. (2026) · Lipids in Health and Disease · doi:10.1186/s12944-026-02867-9 · Cited by 15
Feng, Y., Luo, S., Fang, C., Ma, S., Fan, D., Chen, Y., Chen, Z., Zheng, X., Tang, Y., Duan, X., et al. (2024) · Journal of Lipid Research · doi:10.1016/j.jlr.2024.100595 · Cited by 16
Self-citationShen, C., Pan, Z., Xie, W., Zhao, J., Miao, D., Zhao, L., Liu, M., Zhong, Y., Zhong, C., Gonzalez, F. J., et al. (2024) · Metabolism · doi:10.1016/j.metabol.2024.156054 · Cited by 15
Self-citationCD36 regulates diurnal glucose metabolism and hepatic clock to maintain glucose homeostasis in mice
Chen, M., Zhang, Y., Zeng, S., Li, D., You, M., Zhang, M., Wang, Z., Wei, L., Chen, Y., & Ruan, X. Z. (2023) · iScience · doi:10.1016/j.isci.2023.106524 · Cited by 14
Self-citationLi, Y., Zhang, L., Jiao, J., Ding, Q., Li, Y., Zhao, Z., Luo, J., Chen, Y., Ruan, X. Z., & Zhao, L. (2023) · Biochimica et Biophysica Acta (BBA) - Molecular Basis of Disease · doi:10.1016/j.bbadis.2023.166800 · Cited by 16
Self-citationCottier, K. E., Bhalerao, D., Lewis, C., Gaffney, J., & Heyward, S. A. (2023) · Scientific Reports · doi:10.1038/s41598-023-42785-9 · Cited by 14
Wu, H., Ji, Z., Xie, W., Guo, H., Zheng, Y., Gao, W., & Yuan, B. (2024) · iScience · doi:10.1016/j.isci.2024.109850 · Cited by 13
Qiu, M., Yang, L., Jiang, Z., Chen, Y., Liu, Q., Wang, X., & Qu, W. (2024) · Environmental Pollution · doi:10.1016/j.envpol.2024.123971 · Cited by 12
Self-citationYang, L., Jiang, Z., Yang, L., Zheng, W., Chen, Y., Qu, F., Crabbe, M. J. C., Zhang, Y., Andersen, M. E., Zheng, Y., et al. (2024) · Environmental Science & Technology · doi:10.1021/acs.est.3c11009 · Cited by 12
Self-citationLiang, M., Xiao, X., Chen, M., Guo, Y., Han, W., Min, Y., Jiang, X., & Yu, W. (2024) · Journal of Ethnopharmacology · doi:10.1016/j.jep.2024.119030 · Cited by 12
Liu, Y., & Yin, W. (2025) · Hepatology Communications · doi:10.1097/hc9.0000000000000623 · Cited by 15
Chen, Y., Wu, Y., Zhang, Y., Ji, P., & Hua, J. (2025) · Journal of Gastroenterology and Hepatology · doi:10.1111/jgh.17033 · Cited by 15
Self-citationRivera‐Íñiguez, I., Panduro, A., Román, S., & González-Aldaco, K. (2022) · Annals of Hepatology · doi:10.1016/j.aohep.2022.100874 · Cited by 12
Devereux, C. J., Bayliss, J. A., Keenan, S. N., Montgomery, M. K., & Watt, M. J. (2023) · American Journal of Physiology-Endocrinology and Metabolism · doi:10.1152/ajpendo.00161.2022 · Cited by 12
Wu, Z., Luo, L., Kan, Y.-Q., et al. (2023) · Toxics · doi:10.3390/toxics11090736 · Cited by 12
Self-citationWang, F., Xu, S.-J., Ye, F., Zhang, B., & Sun, X. (2023) · Nutrients · doi:10.3390/nu15183914 · Cited by 13
Li, L., Lu, Z., Wang, Y., et al. (2023) · Poultry Science · doi:10.1016/j.psj.2023.103251 · Cited by 11
Singuru, G., Pulipaka, S., Shaikh, A., Andugulapati, S. B., Thennati, R., & Kotamraju, S. (2023) · International Immunopharmacology · doi:10.1016/j.intimp.2023.111070 · Cited by 11
Thilakarathna, W. P. D. W., & Rupasinghe, H. P. V. (2024) · Molecules · doi:10.3390/molecules29030709 · Cited by 11
Ravaut, G., Carneiro, A., & Mounier, C. (2024) · Frontiers in Nutrition · doi:10.3389/fnut.2024.1290540 · Cited by 12
CD36−SREBP1 Axis Mediates TSLP Production in Obesity-Exacerbated Atopic Dermatitis
Yu, J., Song, P., Bai, Y., et al. (2023) · Journal of Investigative Dermatology · doi:10.1016/j.jid.2023.04.024 · Cited by 10
Loss of NAT10 alleviates maternal high‐fat diet‐induced hepatic steatosis in male offspring of mice
Zhang, Q., Zhang, J., Shen, F., et al. (2024) · Obesity · doi:10.1002/oby.24041 · Cited by 10
Chemically synthesized osteocalcin alleviates NAFLD via the AMPK-FOXO1/BCL6-CD36 pathway
Zhang, M., Dong, K., Du, Q., Xu, J., Bai, X., Chen, L., & Yang, J. (2024) · Journal of Translational Medicine · doi:10.1186/s12967-024-05592-y · Cited by 11
Self-citationHan, J.-R., Liu, C., Chen, Z., Ruan, F., Xue, F., Ye, L., Yu, Y., Zuo, Z., & He, C. (2025) · Environment International · doi:10.1016/j.envint.2025.109780 · Cited by 11
Tian, F., Yi, J., Tang, Y., Chen, B., Long, H., Liu, Y.-F., Ouyang, Y., Zhang, W., Rong-mei, T., & Liu, B. (2023) · Food & Function · doi:10.1039/d2fo02774g · Cited by 9
Wang, Z., Ojogun, N., Liu, Y., Gan, L., Xiao, Z., Feng, J., Jiang, W., Chen, Y., Zou, B., Yu, C., et al. (2024) · eLife · doi:10.7554/elife.100731 · Cited by 17
Self-citationBisphenol S Induces Lipid Metabolism Disorders in HepG2 and SK-Hep-1 Cells via Oxidative Stress
Lin, K.-X., Wu, Z., Qin, M.-L., & Zeng, H. (2025) · Toxics · doi:10.3390/toxics13010044 · Cited by 9
Self-citationRelationship between Abnormal Lipid Metabolism and Gallstone Formation
Li, X., Yin, X., Xu, J., Geng, L., & Liu, Z. (2025) · Korean Journal of Gastroenterology · doi:10.4166/kjg.2024.135 · Cited by 10
Therapeutic strategies targeting SREBP transcription factors: an update to 2024
Wang, Y., Xiao, H., Lai, L., & Zheng, Z. (2025) · Acta Materia Medica · doi:10.15212/amm-2025-0001 · Cited by 11
Metabolic-immune microenvironment crosstalk mediating ICI resistance in MASH-HCC
Ju, Y., Xu, K., Chen, X., Wu, T., & Yuan, Y. (2025) · Trends in Endocrinology and Metabolism · doi:10.1016/j.tem.2025.06.008 · Cited by 11
Chen, B., Ma, Y.-Y., Miao-qing, Z., Zhang, R., Li, S., Wu, L.-Z., & Zhang, J. (2025) · Metabolism · doi:10.1016/j.metabol.2025.156487 · Cited by 9
Zhao, T., Zheng, H., Xu, J., Xu, Y.-C., Liu, L.-L., & Luo, Z. (2023) · Environmental Pollution · doi:10.1016/j.envpol.2023.122416 · Cited by 9
Gallstone and Gallbladder Disease: Biliary Tract and Cholangiopathies
Ceci, L., Han, Y., Krutsinger, K., Baiocchi, L., Wu, N., Kundu, D., Kyritsi, K., Zhou, T., Gaudio, E., Francis, H., et al. (2023) · Comprehensive physiology · doi:10.1002/cphy.c220028 · Cited by 17
Insulin-induced gene 2 protects against hepatic ischemia–reperfusion injury via metabolic remodeling
Wu, Y., Li, C., Khan, A. A., Chen, K., Su, R., Xu, S., Sun, Y., Gao, F., Wang, K., Wang, X., et al. (2023) · Journal of Translational Medicine · doi:10.1186/s12967-023-04564-y · Cited by 8
Swan, J., Szabó, Z., Peters, J., Kummu, O., Kemppi, A., Rahtu‐Korpela, L., Konzack, A., Hakkola, J., Pasternack, A. H., Ritvos, O., et al. (2024) · Biomedicine & Pharmacotherapy · doi:10.1016/j.biopha.2024.116683 · Cited by 9
Sonkar, R., Ma, H., & Waxman, D. J. (2024) · Toxicological Sciences · doi:10.1093/toxsci/kfae057 · Cited by 7
Gnocchi, D., Nikolić, D., Paparella, R. R., Sabbà, C., & Mazzocca, A. (2024) · Plant Foods for Human Nutrition · doi:10.1007/s11130-024-01188-5 · Cited by 8
Wu, Y., Li, C., Lu, D., Chen, K., Su, R., Xu, S., Gao, F., Lian, Z., Yang, F., Chen, J., et al. (2025) · Cell Death Discovery · doi:10.1038/s41420-025-02406-y · Cited by 7
Spatial genomics: Mapping the landscape of fibrosis
Velu, P. P., Abhari, R. E., & Henderson, N. C. (2025) · Science Translational Medicine · doi:10.1126/scitranslmed.adm6783 · Cited by 8
Wen, Y., Wang, Y., Zhuang, Y., Xu, G., Zhang, Y., Zhang, S., Xu, A., Chen, X., Li, K., Cai, W., et al. (2025) · Phytomedicine · doi:10.1016/j.phymed.2025.157167 · Cited by 7
EVA1A Regulates Hepatic Lipid Homeostasis by Modulating CD36 Expression and Its Palmitoylation
Yang, D., Li, L., Zang, K., Ma, W., Yang, Y., Sun, Y., Zhang, B., Gong, Z., Mei, Y., Du, Q., et al. (2025) · Research · doi:10.34133/research.1001 · Cited by 8
Klag, K. A., Bell, R. S., Jia, X., Seguin, A., Maschek, J. A., Bronner, M. P., Cox, J. E., Round, J. L., & Ward, D. M. (2024) · Nutrients · doi:10.3390/nu16121804 · Cited by 9
La, X., Zhang, Z., Liang, J., Li, H., Pang, Y., He, X., Kang, Y., Wu, C., & Li, Z. (2024) · Journal of the Science of Food and Agriculture · doi:10.1002/jsfa.13923 · Cited by 7
Wang, Z., Ojogun, N., Liu, Y., Gan, L., Xiao, Z., Feng, J., Jiang, W., Chen, Y., Zou, B., Yu, C., et al. (2025) · eLife · doi:10.7554/elife.100731.3 · Cited by 7
Self-citationNOD1 activation in 3T3-L1 adipocytes confers lipid accumulation in HepG2 cells
Gulzar, F., Ahmad, S., Singh, S., Kumar, P., Sharma, A., & Tamrakar, A. K. (2023) · Life Sciences · doi:10.1016/j.lfs.2023.121400 · Cited by 7
Weiner, J., Dommel, S., Gebhardt, C., Hanschkow, M., Popkova, Y., Krause, K., Klöting, N., Blüher, M., Schiller, J., & Heiker, J. T. (2023) · Frontiers in Nutrition · doi:10.3389/fnut.2023.1275160 · Cited by 7
Landgraf, A., Okada, J., Horton, M., Liu, L. P., Solomon, S., Qiu, Y., Kurland, I. J., Sidoli, S., Pessin, J. E., & Shinoda, K. (2025) · bioRxiv (Cold Spring Harbor Laboratory) · doi:10.1101/2025.04.15.649020 · Cited by 7
Verhoeven, A., Gatzios, A., Rodrigues, R. M., Sanz-Serrano, J., Kock, J. D., Vinken, M., & Vanhaecke, T. (2025) · Toxicology · doi:10.1016/j.tox.2025.154263 · Cited by 6
Ji, K., Chen, Y., Song, Q., et al. (2025) · Organic Letters · doi:10.1021/acs.orglett.5c03471 · Cited by 6
Self-citationKang, C., Xiao, Q., Wang, X., Guo, W., Zhang, H., Yuan, L., Zhao, Z., & Hao, W. (2024) · Food and Chemical Toxicology · doi:10.1016/j.fct.2024.114790 · Cited by 6
Metadata
- Authors
- Zeng, H., Qin, H., Liao, M., Zheng, E., Luo, X., Xiao, A., Li, Y., Chen, L., Wei, L., Zhao, L., Ruan, X. Z., Yang, P., & Chen, Y.
- Affiliations
- Second Affiliated Hospital of Chongqing Medical University (CN)
- The Royal Free Hospital (GB)
- Corresponding author
- Yang, Ping
- Chen, Yaxi
- Venue
- Molecular Metabolism
- Publisher
- Elsevier BV
- Published
- 2022-03
- Volume
- 57
- Pages
- 101428
- ISSN
- 2212-8778 (ISSN-L)
- PMC
- PMC8810570
- OpenAlex
- W4200530196
- Semantic Scholar
- 9eab22cddc8a889e5bc861e52f4c9cca8b021238
- Cited by
- 211
- References
- 56
- Citations by year
- 2026: 35 · 2025: 68 · 2024: 61 · 2023: 35 · 2022: 12
- FWCI
- 19.45
- Type
- journal article
- Language
- en
- Open access
- gold
- doi.org
- Licence
- Locations
- Molecular Metabolism (publishedVersion, cc-by-nc-nd)
- PubMed Central (publishedVersion, cc-by-nc-nd)
- PubMed (publishedVersion)
- DOAJ (DOAJ: Directory of Open Access Journals) (submittedVersion, cc-by-sa)
- Funders
- National Natural Science Foundation of China (20190120, 2018YFC1312700, 81873569, 32030054, cstc2020jcyj, D20028)
- Chongqing Medical University (D20028)
- Chongqing Research Program of Basic Research and Frontier Technology (cstc2020jcyj-msxmX0205)
- Higher Education Discipline Innovation Project (D20028)
- Topics
- Health Sciences › Medicine › Hepatology › Liver Disease Diagnosis and Treatment
- Life Sciences › Biochemistry, Genetics and Molecular Biology › Cancer Research › Cancer, Lipids, and Metabolism
- Life Sciences › Biochemistry, Genetics and Molecular Biology › Biochemistry › Lipid metabolism and biosynthesis
- Keywords
- CD36, de novo lipogenesis, hepatocytes, non-alcoholic fatty liver disease, INSIG2, SREBP1, SCAP, insulin signaling, hepatic steatosis, insulin resistance, lipid droplet formation, 25-hydroxycholesterol, betulin, free fatty acid uptake, high-fat diet
- MeSH terms
- Animals, Humans, Membrane Proteins, CD36 Antigens, Hepatocytes, Intracellular Signaling Peptides and Proteins, Lipogenesis, Mice, Sterol Regulatory Element Binding Protein 1, Non-alcoholic Fatty Liver Disease
About these checks
Registry, retraction, Cites and statistics results are computed, not judged, with one exception: a printed reference that no index lists is read once by a model before it counts as a citation error. Claims are extracted by a model and kept only when their quote appears verbatim in the text; each cited source is then checked, with a model’s help, for whether it says what the claim relies on. Those verdicts can be wrong — read the claim’s quote and the cited source before relying on one.
Statistics and arithmetic are recomputed, not judged.
Confidence bands are shown only for fields calibrated on our annotated test set. None is calibrated yet, so no band is shown.
What counts as a claim ›How we measure confidence ›How we check this ›
Are you an author, or do you see a problem with this page? Request a review
