

The DOI matches its Crossref record; 62 of the 65 references it cites were found in a registry or an index.
Using OPMs to measure neural activity in standing, mobile participants
Open accessPublished version of a preprint
Abstract
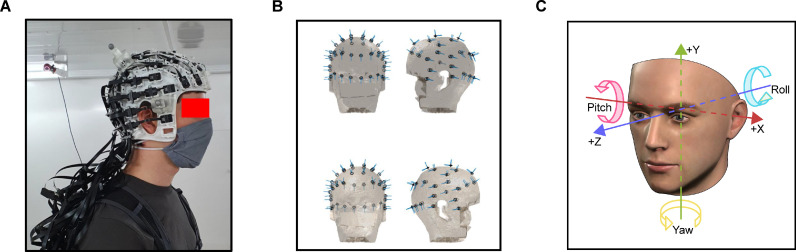
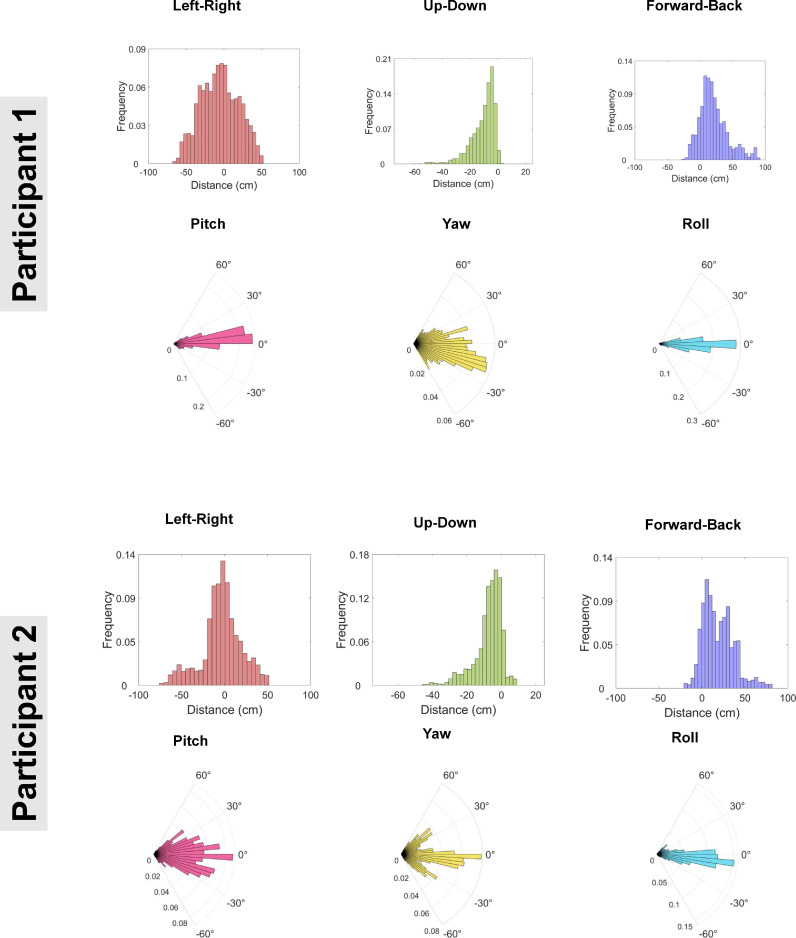
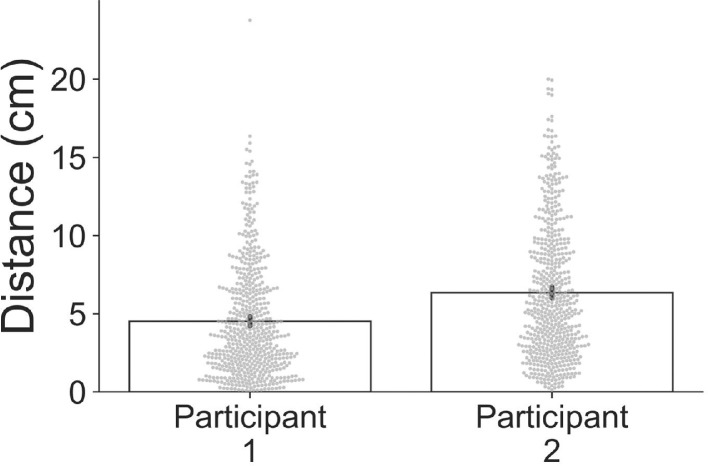
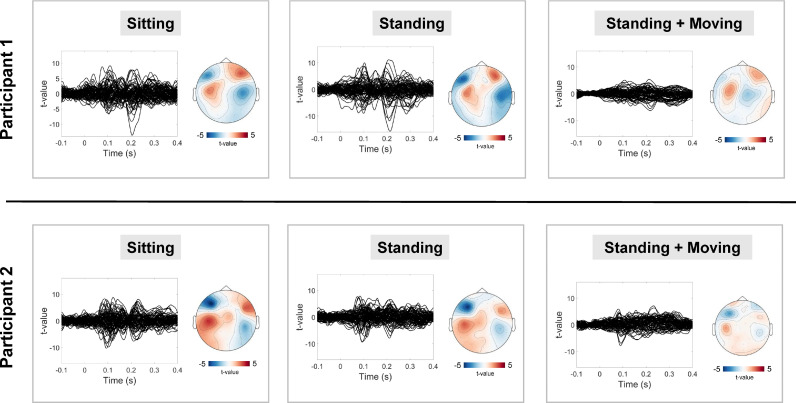
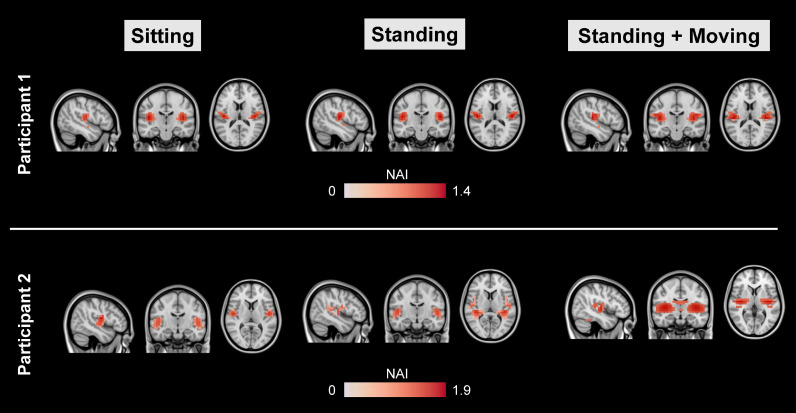
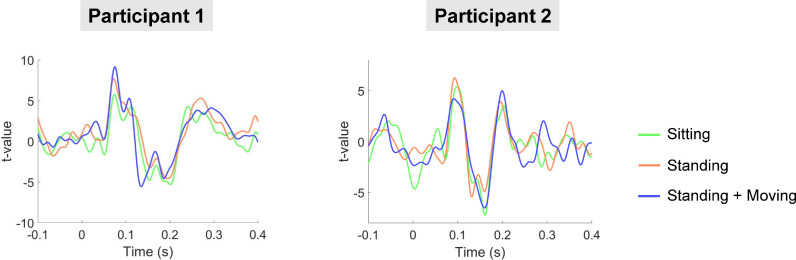
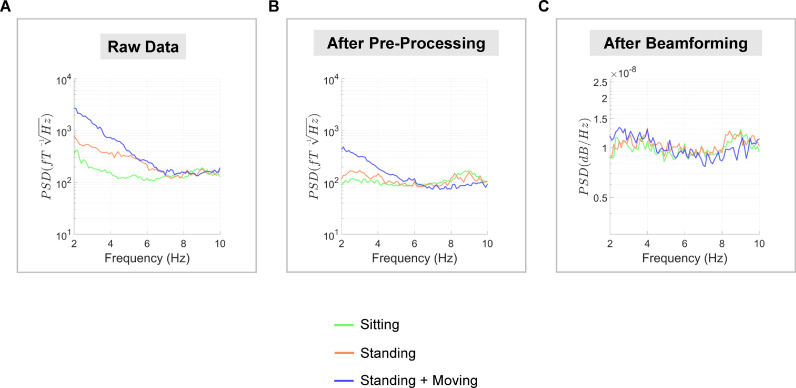
Optically pumped magnetometer-based magnetoencephalography (OP-MEG) can be used to measure neuromagnetic fields while participants move in a magnetically shielded room. Head movements in previous OP-MEG studies have been up to 20 cm translation and ∼30° rotation in a sitting position. While this represents a step-change over stationary MEG systems, naturalistic head movement is likely to exceed these limits, particularly when participants are standing up. In this proof-of-concept study, we sought to push the movement limits of OP-MEG even further. Using a 90 channel (45-sensor) whole-head OP-MEG system and concurrent motion capture, we recorded auditory evoked fields while participants were: (i) sitting still, (ii) standing up and still, and (iii) standing up and making large natural head movements continuously throughout the recording - maximum translation 120 cm, maximum rotation 198°. Following pre-processing, movement artefacts were substantially reduced but not eliminated. However, upon utilisation of a beamformer, the M100 event-related field localised to primary auditory regions. Furthermore, the event-related fields from auditory cortex were remarkably consistent across the three conditions. These results suggest that a wide range of movement is possible with current OP-MEG systems. This in turn underscores the exciting potential of OP-MEG for recording neural activity during naturalistic paradigms that involve movement (e.g. navigation), and for scanning populations who are difficult to study with stationary MEG (e.g. young children).
Overview
The claims and statistics of this paper haven’t been checked yet.
Run the check — free, no account needed. It reads the open-access text and checks the sources it cites.
Integrity signals
Registry
Cites
Statistics
Figures
Verification
Claims the paper makes
The claims and statistics of this paper haven’t been checked yet.
Run the check — free, no account needed. It reads the open-access text and checks the sources it cites.
Claims other papers make about this one
Each is checked against this paper’s own text: does it say what the citing paper says it does?
The cited source says what the claim attributes to it.
In the citing paper
“In addition, the lightweight nature of OPMs has enabled the development of wearable systems which allow participants to move during recordings [24,28,29,30]”
From Naturalistic Hyperscanning with Wearable Magnetoencephalography (2023) · cites this paper as [30]
Self-check
Percentages, sums and reported differences re-computed from the paper’s own numbers.
The self-check needs the paper’s full text.
Citations
Cites
Oostenveld, R., Fries, P., Maris, E., & Schoffelen, J.-M. (2011) · Computational Intelligence and Neuroscience · doi:10.1155/2011/156869 · Cited by 10,323
Nonparametric statistical testing of EEG- and MEG-data
Maris, E., & Oostenveld, R. (2007) · Journal of Neuroscience Methods · doi:10.1016/j.jneumeth.2007.03.024 · Cited by 8,496
Nonparametric permutation tests for functional neuroimaging: A primer with examples
Nichols, T. E., & Holmes, A. P. (2002) · Human Brain Mapping · doi:10.1002/hbm.1058 · Cited by 6,256
A multi-modal parcellation of human cerebral cortex
Glasser, M. F., Coalson, T. S., Robinson, E. C., Hacker, C. D., Harwell, J., Yacoub, E., Ugurbil, K., Andersson, J., Beckmann, C. F., Jenkinson, M., et al. (2016) · Nature · doi:10.1038/nature18933 · Cited by 5,111
Van Veen, B. D., Van Drongelen, W., Yuchtman, M., & Suzuki, A. (1997) · IEEE Transactions on Biomedical Engineering · doi:10.1109/10.623056 · Cited by 2,561
Generating stimuli for neuroscience using PsychoPy
Peirce, J. W. (2008) · Frontiers in Neuroinformatics · doi:10.3389/neuro.11.010.2008 · Cited by 1,664
Moving magnetoencephalography towards real-world applications with a wearable system
Boto, E., Holmes, N., Leggett, J., Roberts, G., Shah, V., Meyer, S. S., Muñoz, L. D., Mullinger, K. J., Tierney, T. M., Bestmann, S., et al. (2018) · Nature · doi:10.1038/nature26147 · Cited by 1,377
Self-citationMagnetoencephalography for Brain Electrophysiology and Imaging
Baillet, S. (2017) · Nature Neuroscience · doi:10.1038/nn.4504 · Cited by 992
Unveiling the Biometric Potential of Finger-Based ECG Signals
Lourenço, A., Silva, H., & Fred, A. L. N. (2011) · Computational Intelligence and Neuroscience · doi:10.1155/2011/720971 · Cited by 771
Good practice for conducting and reporting MEG research
Groß, J., Baillet, S., Barnes, G. R., Henson, R. N., Hillebrand, A., Jensen, O. B., Jerbi, K., Vladimir Litvak, A., Maeß, B., Oostenveld, R., et al. (2012) · NeuroImage · doi:10.1016/j.neuroimage.2012.10.001 · Cited by 750
Self-citationEEG and MEG Data Analysis in SPM8
Vladimir Litvak, A., Mattout, J., Kiebel, S. J., Phillips, C. L. M., Henson, R. N., Kilner, J. M., Barnes, G. R., Oostenveld, R., Jean Daunizeau, A., Flandin, G., et al. (2011) · Computational Intelligence and Neuroscience · doi:10.1155/2011/852961 · Cited by 586
Self-citationBoto, E., Meyer, S. S., Shah, V., Alem, O., Knappe, S., Kruger, P., Fromhold, T. M., Lim, M., Glover, P. M., Morris, P. G., et al. (2017) · NeuroImage · doi:10.1016/j.neuroimage.2017.01.034 · Cited by 471
Self-citationThe functional anatomy of the MMN: a DCM study of the roving paradigm
Garrido, M. I., Friston, K. J., Kiebel, S. J., Stephan, K. E., Baldeweg, T., & Kilner, J. M. (2008) · NeuroImage · doi:10.1016/j.neuroimage.2008.05.018 · Cited by 458
Macgregor, C. J., Thomas, C. D., Roy, D. B., Beaumont, M., Bell, J. R., BRERETON, T. M., Bridle, J. R., Dytham, C., Fox, R., Gotthard, K., et al. (2019) · Nature Communications · doi:10.1038/s41467-019-12479-w · Cited by 425
Optically pumped magnetometers: from quantum origins to multi-channel magnetoencephalography
Tierney, T. M., Holmes, N., Mellor, S., López, J. D., Roberts, G., Hill, R. M., Boto, E., Leggett, J., Shah, V., Brookes, M. J., et al. (2019) · NeuroImage · doi:10.1016/j.neuroimage.2019.05.063 · Cited by 400
Self-citationTaulu, S., & Hari, R. (2008) · Human Brain Mapping · doi:10.1002/hbm.20627 · Cited by 357
Measuring MEG Closer to the Brain: Performance of on-Scalp Sensor Arrays
Iivanainen, J., Stenroos, M., & Parkkonen, L. (2017) · NeuroImage · doi:10.1016/j.neuroimage.2016.12.048 · Cited by 296
Beamformer Analysis of MEG Data
Hillebrand, A., & Barnes, G. R. (2005) · International review of neurobiology · doi:10.1016/s0074-7742(05)68006-3 · Cited by 286
Self-citationMulti-Channel Whole-Head OPM-MEG: Helmet Design and a Comparison with a Conventional System
Hill, R. M., Boto, E., Rea, M., Holmes, N., Leggett, J., Coles, L. A., Papastavrou, M., Everton, S. K., Hunt, B. A. E., Sims, D., et al. (2020) · NeuroImage · doi:10.1016/j.neuroimage.2020.116995 · Cited by 285
On-scalp MEG system utilizing an actively shielded array of optically-pumped magnetometers
Iivanainen, J., Zetter, R., Grön, M., Hakkarainen, K., & Parkkonen, L. (2019) · NeuroImage · doi:10.1016/j.neuroimage.2019.03.022 · Cited by 269
Holmes, N., Leggett, J., Boto, E., Roberts, G., Hill, R. M., Tierney, T. M., Shah, V., Barnes, G. R., Brookes, M. J., & Bowtell, R. (2018) · NeuroImage · doi:10.1016/j.neuroimage.2018.07.028 · Cited by 250
Self-citationFilters: When, Why, and How (Not) to Use Them
Alain De Cheveigné, A., & Nelken, I. (2019) · Neuron · doi:10.1016/j.neuron.2019.02.039 · Cited by 245
Optimising experimental design for MEG beamformer imaging
Brookes, M. J., Vrba, J., Robinson, S. E., Stevenson, C. M., Peters, A. M., Barnes, G. R., Hillebrand, A., & Morris, P. G. (2007) · NeuroImage · doi:10.1016/j.neuroimage.2007.09.050 · Cited by 231
Self-citationOn the Potential of a New Generation of Magnetometers for MEG: A Beamformer Simulation Study
Boto, E., Bowtell, R., Krüger, P., Fromhold, T. M., Morris, P. G., Meyer, S. S., Barnes, G. R., & Brookes, M. J. (2016) · PLOS ONE · doi:10.1371/journal.pone.0157655 · Cited by 194
Self-citationA 20-channel magnetoencephalography system based on optically pumped magnetometers
Borna, A., Carter, T. R., Goldberg, J. D., Colombo, A. P., Jau, Y.-Y., Berry, C., McKay, J., Stephen, J., Weisend, M., & Schwindt, P. D. D. (2017) · Physics in Medicine and Biology · doi:10.1088/1361-6560/aa93d1 · Cited by 189
γ-Band Abnormalities as Markers of Autism Spectrum Disorders
Rojas, D. C., & Wilson, L. B. (2014) · Biomarkers in Medicine · doi:10.2217/bmm.14.15 · Cited by 185
A tool for functional brain imaging with lifespan compliance
Hill, R. M., Boto, E., Holmes, N., Hartley, C., Seedat, Z. A., Leggett, J., Roberts, G., Shah, V., Tierney, T. M., Woolrich, M. W., et al. (2019) · Nature Communications · doi:10.1038/s41467-019-12486-x · Cited by 180
Self-citationFully integrated, standalone zero field optically pumped magnetometer for biomagnetism
Shah, V., Osborne, J., Orton, J., & Alem, O. (2018) · doi:10.1117/12.2299197 · Cited by 173
Auditory Magnetic Mismatch Field Latency: A Biomarker for Language Impairment in Autism
Roberts, T. P. L., Cannon, K. M., Tavabi, K., Blaskey, L. G., Khan, S. Y., Monroe, J. F., Qasmieh, S., Levy, S. E., & Edgar, J. C. (2011) · Biological Psychiatry · doi:10.1016/j.biopsych.2011.01.015 · Cited by 171
Holmes, N., Tierney, T. M., Leggett, J., Boto, E., Mellor, S., Roberts, G., Hill, R. M., Shah, V., Barnes, G. R., Brookes, M. J., et al. (2019) · Scientific Reports · doi:10.1038/s41598-019-50697-w · Cited by 163
Self-citationBeamformer reconstruction of correlated sources using a modified source model
Brookes, M. J., Stevenson, C. M., Barnes, G. R., Hillebrand, A., Simpson, M. I. G., Francis, S., & Morris, P. G. (2006) · NeuroImage · doi:10.1016/j.neuroimage.2006.11.012 · Cited by 162
Self-citationTheoretical advantages of a triaxial optically pumped magnetometer magnetoencephalography system
Brookes, M. J., Boto, E., Rea, M., Shah, V., Osborne, J., Holmes, N., Hill, R. M., Leggett, J., Rhodes, N., & Bowtell, R. W. (2021) · NeuroImage · doi:10.1016/j.neuroimage.2021.118025 · Cited by 158
Non-Invasive Functional-Brain-Imaging with an OPM-based Magnetoencephalography System
Borna, A., Carter, T. R., Colombo, A. P., Jau, Y.-Y., McKay, J., Weisend, M., Taulu, S., Stephen, J. M., & Schwindt, P. D. D. (2020) · PLOS ONE · doi:10.1371/journal.pone.0227684 · Cited by 158
Reducing power line noise in EEG and MEG data via spectrum interpolation
Leske, S. L., & Dalal, S. S. (2019) · NeuroImage · doi:10.1016/j.neuroimage.2019.01.026 · Cited by 150
Sekihara, K., Nagarajan, S. S., Poeppel, D., & Marantz, A. (2002) · IEEE Transactions on Biomedical Engineering · doi:10.1109/tbme.2002.805485 · Cited by 145
Vladimir Litvak, A., Eusébio, A., Jha, A., Oostenveld, R., Barnes, G. R., Penny, W. D., Zrinzo, L. U., Hariz, M. I., Limousin, P. D., Friston, K. J., et al. (2010) · NeuroImage · doi:10.1016/j.neuroimage.2009.12.115 · Cited by 133
Self-citationMeasuring functional connectivity with wearable MEG
Boto, E., Hill, R. M., Rea, M., Holmes, N., Seedat, Z. A., Leggett, J., Shah, V., Osborne, J., Bowtell, R. W., & Brookes, M. J. (2021) · NeuroImage · doi:10.1016/j.neuroimage.2021.117815 · Cited by 130
Towards OPM-MEG in a Virtual Reality Environment
Roberts, G., Holmes, N., Alexander, N., Boto, E., Leggett, J., Hill, R. M., Shah, V., Rea, M., Vaughan, R., Maguire, E. A., et al. (2019) · NeuroImage · doi:10.1016/j.neuroimage.2019.06.010 · Cited by 128
Self-citationFrequency-specific directed interactions in the human brain network for language
Schoffelen, J.-M., Hultén, A., Lam, N., Marquand, A. F., Uddén, J., & Hagoort, P. (2017) · Proceedings of the National Academy of Sciences · doi:10.1073/pnas.1703155114 · Cited by 128
Tierney, T. M., Alexander, N., Mellor, S., Holmes, N., Seymour, R. A., O’Neill, G. C., Maguire, E. A., & Barnes, G. R. (2021) · NeuroImage · doi:10.1016/j.neuroimage.2021.118484 · Cited by 119
Self-citationSekihara, K., Nagarajan, S. S., Poeppel, D., Marantz, A., & Miyashita, Y. (2002) · Human Brain Mapping · doi:10.1002/hbm.10019 · Cited by 111
Potential of on‐scalp MEG: Robust detection of human visual gamma‐band responses
Iivanainen, J., Zetter, R., & Parkkonen, L. T. (2019) · Human Brain Mapping · doi:10.1002/hbm.24795 · Cited by 98
Reduced auditory steady state responses in autism spectrum disorder
Seymour, R. A., Rippon, G., Gooding-Williams, G., Sowman, P. F., & Kessler, K. (2020) · Molecular Autism · doi:10.1186/s13229-020-00357-y · Cited by 93
Self-citationMobile Brain/Body Imaging (MoBI) of Physical Interaction with Dynamically Moving Objects
Jungnickel, E., & Gramann, K. (2016) · Frontiers in Human Neuroscience · doi:10.3389/fnhum.2016.00306 · Cited by 88
Virtual Reality Applications for Neurological Disease: A Review
Schiza, E. C., Matsangidou, M., Neokleous, K., & Pattichis, C. S. (2019) · Frontiers in Robotics and AI · doi:10.3389/frobt.2019.00100 · Cited by 88
Mouth magnetoencephalography: A unique perspective on the human hippocampus
Tierney, T. M., Levy, A. D., Barry, D. N., Meyer, S. S., Shigihara, Y., Everatt, M., Mellor, S., López, J. D., Bestmann, S., Holmes, N., et al. (2020) · NeuroImage · doi:10.1016/j.neuroimage.2020.117443 · Cited by 87
Self-citationNardelli, N. V., Perry, A. R., Krzyzewski, S., & Knappe, S. A. (2020) · EPJ Quantum Technology · doi:10.1140/epjqt/s40507-020-00086-4 · Cited by 85
Flexible head-casts for high spatial precision MEG
Meyer, S. S., Bonaiuto, J., Lim, M., Rossiter, H., Waters, S., Bradbury, D., Bestmann, S., Brookes, M., Callaghan, M. F., Weiskopf, N., et al. (2017) · Journal of Neuroscience Methods · doi:10.1016/j.jneumeth.2016.11.009 · Cited by 77
Self-citationImaging the human hippocampus with optically-pumped magnetoencephalography
Barry, D. N., Tierney, T. M., Holmes, N., Boto, E., Roberts, G., Leggett, J., Bowtell, R. W., Brookes, M. J., Barnes, G. R., & Maguire, E. A. (2019) · NeuroImage · doi:10.1016/j.neuroimage.2019.116192 · Cited by 76
Self-citationOptically pumped magnetoencephalography in epilepsy
Vivekananda, U., Mellor, S., Tierney, T. M., Holmes, N., Boto, E., Leggett, J., Roberts, G., Hill, R. M., Vladimir Litvak, A., Brookes, M. J., et al. (2020) · Annals of Clinical and Translational Neurology · doi:10.1002/acn3.50995 · Cited by 75
Self-citationKessler, K., Seymour, R. A., & Rippon, G. (2016) · Neuroscience & Biobehavioral Reviews · doi:10.1016/j.neubiorev.2016.10.002 · Cited by 69
Self-citationTierney, T. M., Holmes, N., Meyer, S. S., Boto, E., Roberts, G., Leggett, J., Buck, S., Duque‐Muñoz, L., Vladimir Litvak, A., Bestmann, S., et al. (2018) · NeuroImage · doi:10.1016/j.neuroimage.2018.07.035 · Cited by 66
Self-citationFourcault, W., Romain, R., Gal, G. L., Bertrand, F., Josselin, V., Prado, M. L., Labyt, É., & Palacios-Laloy, A. (2021) · Optics Express · doi:10.1364/oe.420031 · Cited by 66
Minimizing magnetic fields for precision experiments
Altarev, I., Fierlinger, P., Lins, T., Marino, M. G., Nießen, B., Petzoldt, G., Reisner, M., Stuiber, S., Sturm, M., Taggart Singh, J., et al. (2015) · Journal of Applied Physics · doi:10.1063/1.4922671 · Cited by 66
Popov, T. G., Oostenveld, R., & Schoffelen, J. (2018) · Frontiers in Neuroscience · doi:10.3389/fnins.2018.00711 · Cited by 62
Artifact and head movement compensation in MEG.
Medvedovsky, M., Taulu, S., Bikmullina, R., & Paetau, R. (2007) · PubMed · Cited by 58
Magnetic Field Mapping and Correction for Moving OP-MEG
Mellor, S., Tierney, T. M., O’Neill, G. C., Alexander, N., Seymour, R. A., Holmes, N., López, J. D., Hill, R. M., Boto, E., Rea, M., et al. (2021) · IEEE Transactions on Biomedical Engineering · doi:10.1109/tbme.2021.3100770 · Cited by 56
Self-citationICA-based artifact correction improves spatial localization of adaptive spatial filters in MEG
Fatima, Z., Quraan, M. A., Kovacevic, N., & McIntosh, A. R. (2013) · NeuroImage · doi:10.1016/j.neuroimage.2013.04.033 · Cited by 36
Adjamian, P., Worthen, S. F., Hillebrand, A., Furlong, P. L., Chizh, B. A., Hobson, A. R., Aziz, Q., & Barnes, G. R. (2008) · Journal of Neuroscience Methods · doi:10.1016/j.jneumeth.2008.12.006 · Cited by 36
Self-citationVettori, S., der Donck, S. V., Nys, J., Moors, P., Wesemael, T. V., Steyaert, J. G., Rossion, B., Dzhelyova, M. P., & Boets, B. (2020) · Molecular Autism · doi:10.1186/s13229-020-00396-5 · Cited by 29
Kowalczyk, A., Bezsudnova, Y., Jensen, O. B., & Barontini, G. (2020) · NeuroImage · doi:10.1016/j.neuroimage.2020.117497 · Cited by 24
Magnetic Field Mapping and Correction for Moving OP-MEGPreprint
Mellor, S., Tierney, T. M., O’Neill, G. C., Alexander, N., Seymour, R. A., Holmes, N., López, J. D., Hill, R. M., Boto, E., Rea, M., et al. (2021) · bioRxiv (Cold Spring Harbor Laboratory) · doi:10.1101/2021.05.25.444975 · Cited by 13
Self-citation
Research works printed but not linked: 1
- Hari, 1990, The neuromagnetic method in the study of the human auditory cortex, Adv. Audiol., 6, 222
Cited by
Sorted by citations
Brookes, M. J., Leggett, J., Rea, M., Hill, R. M., Holmes, N., Boto, E., & Bowtell, R. W. (2022) · Trends in Neurosciences · doi:10.1016/j.tins.2022.05.008 · Cited by 438
Boto, E., Shah, V., Hill, R. M., Rhodes, N., Osborne, J., Doyle, C., Holmes, N., Rea, M., Leggett, J., Bowtell, R. W., et al. (2022) · NeuroImage · doi:10.1016/j.neuroimage.2022.119027 · Cited by 195
Interference suppression techniques for OPM-based MEG: Opportunities and challenges
Seymour, R. A., Alexander, N., Mellor, S., O’Neill, G. C., Tierney, T. M., Barnes, G. R., & Maguire, E. A. (2021) · NeuroImage · doi:10.1016/j.neuroimage.2021.118834 · Cited by 131
Self-citationA 90-Channel Triaxial Magnetoencephalography System Using Optically Pumped Magnetometers
Rea, M., Boto, E., Holmes, N., Hill, R., Osborne, J., Rhodes, N., Leggett, J., Rier, L., Bowtell, R., Shah, V., et al. (2022) · Annals of the New York Academy of Sciences · doi:10.1111/nyas.14890 · Cited by 102
Holmes, N., Rea, M., Hill, R. M., Leggett, J., Edwards, L. J., Hobson, P. J., Boto, E., Tierney, T. M., Rier, L., Rivero, G. R., et al. (2023) · NeuroImage · doi:10.1016/j.neuroimage.2023.120157 · Cited by 89
Self-citation
Metadata
- Authors
- Seymour, R. A., Alexander, N., Mellor, S., O'Neill, G. C., Tierney, T. M., Barnes, G. R., & Maguire, E. A.
- Affiliations
- Wellcome Centre for Human Neuroimaging (GB)
- Corresponding author
- Seymour, Robert A.
- Maguire, Eleanor A.
- ORCID
- Venue
- NeuroImage
- Publisher
- Elsevier BV
- Published
- 2021-12
- Volume
- 244
- Pages
- 118604
- ISSN
- 1053-8119 (ISSN-L)
- PMC
- PMC8591613
- OpenAlex
- W3200893299
- Cited by
- 102
- References
- 65
- Citations by year
- 2026: 16 · 2025: 27 · 2024: 19 · 2023: 19 · 2022: 18 · 2021: 3
- FWCI
- 6.44
- Type
- journal article
- Language
- en
- Open access
- gold
- doi.org
- Licence
- Locations
- NeuroImage (publishedVersion, cc-by)
- PubMed Central (publishedVersion, cc-by)
- PubMed (publishedVersion)
- DOAJ (DOAJ: Directory of Open Access Journals) (submittedVersion, cc-by-sa)
- Funders
- Wellcome Trust
- University of Nottingham
- Topics
- Physical Sciences › Physics and Astronomy › Atomic and Molecular Physics, and Optics › Atomic and Subatomic Physics Research
- Health Sciences › Medicine › Radiology, Nuclear Medicine and Imaging › Advanced MRI Techniques and Applications
- Life Sciences › Neuroscience › Cognitive Neuroscience › EEG and Brain-Computer Interfaces
- Keywords
- optically pumped magnetometers, magnetoencephalography, head movement, standing up, motion artifacts, auditory evoked magnetic fields, M100, primary auditory cortex, beamforming, motion capture, naturalistic paradigm
- MeSH terms
- Proof of Concept Study, Standing Position, Adult, Auditory Cortex, Evoked Potentials, Auditory, Head, Humans, Male, Rotation, Magnetoencephalography, Artifacts, Head Movements
About these checks
Registry, retraction, Cites and statistics results are computed, not judged, with one exception: a printed reference that no index lists is read once by a model before it counts as a citation error. Claims are extracted by a model and kept only when their quote appears verbatim in the text; each cited source is then checked, with a model’s help, for whether it says what the claim relies on. Those verdicts can be wrong — read the claim’s quote and the cited source before relying on one.
Statistics and arithmetic are recomputed, not judged.
Confidence bands are shown only for fields calibrated on our annotated test set. None is calibrated yet, so no band is shown.
What counts as a claim ›How we measure confidence ›How we check this ›
Are you an author, or do you see a problem with this page? Request a review
