Cited by 118

The DOI matches its Crossref record; 13 of the 13 references it cites were found in a registry or an index.

Communication from Learned to Innate Olfactory Processing Centers Is Required for Memory Retrieval in Drosophila

Dolan, Michael-John, Belliart-Guérin, Ghislain, Bates, Alexander Shakeel, Frechter, Shahar, Lampin-Saint-Amaux, Aurélie, Aso, Yoshinori, Roberts, Ruairí J.V., Schlegel, Philipp, Wong, Allan, Hammad, Adnan, Bock, Davi, Rubin, Gerald M., Preat, Thomas, Plaçais, Pierre-Yves, Jefferis, Gregory S.X.E.·2018·Neuron

Published version of a preprint

Overview

The claims and statistics of this paper haven’t been checked yet.

Run the check — free, no account needed. It reads the open-access text and checks the sources it cites.

A few free checks a day · papers already verified open instantly · results are public

Integrity signals

Registry

Crossref · 10.1016/j.neuron.2018.08.037

Cites

13 of 13 references verified0 citation errors · 0 not checkable

Statistics

Figures

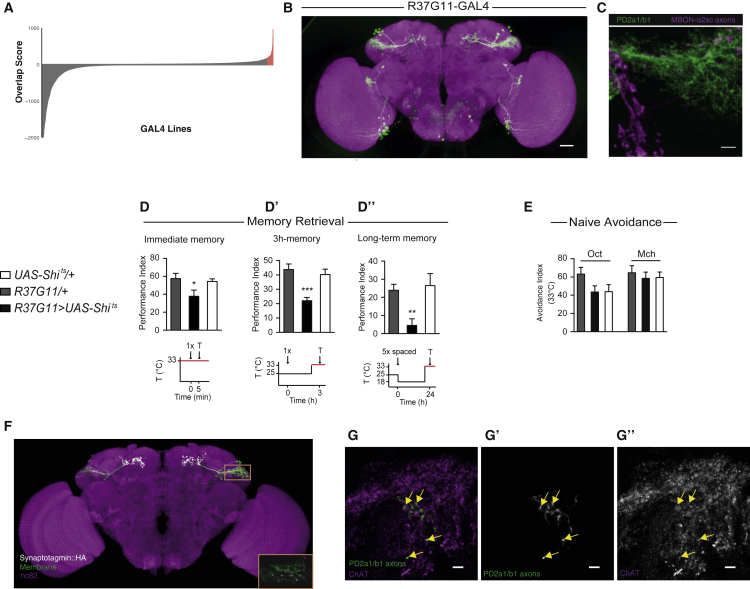
Figure 1 PD2a1 and PD2b1 Are Postsynaptic to MBON-ɑ2sc and Necessary for Memory Retrieval (A) Distribution of LH overlap scores for MBON-ɑ2sc axon mask versus 3,500 GAL4 lines. Scores > 97 percentile are labeled in red, y axis clipped <−2,000. (B) Sparsest GAL4 line labeling cell type PD2a1 and PD2b1, R37G11-GAL4 (image from https://www.janelia.org/gal4-gen1). Scale bar, 30 μm. (C) z-projection of double labeling. MBON axons are labeled in magenta, and PD2a1 and PD2b1 are labeled with membrane-bound GFP (in green). This LexA line contains both MBON-ɑ2sc (dorsal) and MBON-α′3ap (ventral). Scale bar, 5 μm. The image is representative of n = 4. (D–D”) Flies with R37G11-GAL4 driving Shits and genotypic controls were trained and tested with the illustrated protocols (restrictive temperature indicated in red). Silencing PD2a1 and PD2b1 neurons impaired immediate memory after single-cycle training (D; n = 12–13, F(2,36) = 3.79, p = 0.033), 3-hr memory after single-cycle training (D’; n = 9, F(2,26) = 12.07, p = 0.0002), and long-term memory after spaced training (D”; n = 9, F(2,26) = 6.28, p = 0.0064). (E) Flies expressing Shits driven by the 37G11-GAL4 driver showed normal olfactory avoidance to octanol (Oct) and methylcyclohexanol (Mch) compared with their controls at the restrictive temperature (Oct, n = 14, F(2,41) = 2.41, p = 0.10; Mch, n = 14, F(2,41) = 0.23, p = 0.79). Data are presented as mean ± SEM. (F) Confocal z-projection of PD2a1 and PD2b1 driving both membrane-bound GFP (green) and Synaptotagmin-HA (gray). PD2a1 and PD2b1 has been manually segmented. The orange rectangle represents the inset. Inset: a single slice of PD2a1 and PD2b1 dendrites showing punctate Synaptotagmin-HA, indicating dendritic presynapses. The image is representative of n = 5. (G–G”). ChAT immunohistochemistry demonstrating that PD2a1 and PD2b1 neurons are cholinergic. The images show a representative slice (n = 4 stacks). Scale bars, 5 μm. See also Figures S1–S3.
Figure 1 PD2a1 and PD2b1 Are Postsynaptic to MBON-ɑ2sc and Necessary for Memory Retrieval (A) Distribution of LH overlap scores for MBON-ɑ2sc axon mask versus 3,500 GAL4 lines. Scores > 97 percentile are labeled in red, y axis clipped <−2,000. (B) Sparsest GAL4 line labeling cell type PD2a1 and PD2b1, R37G11-GAL4 (image from https://www.janelia.org/gal4-gen1). Scale bar, 30 μm. (C) z-projection of double labeling. MBON axons are labeled in magenta, and PD2a1 and PD2b1 are labeled with membrane-bound GFP (in green). This LexA line contains both MBON-ɑ2sc (dorsal) and MBON-α′3ap (ventral). Scale bar, 5 μm. The image is representative of n = 4. (D–D”) Flies with R37G11-GAL4 driving Shits and genotypic controls were trained and tested with the illustrated protocols (restrictive temperature indicated in red). Silencing PD2a1 and PD2b1 neurons impaired immediate memory after single-cycle training (D; n = 12–13, F(2,36) = 3.79, p = 0.033), 3-hr memory after single-cycle training (D’; n = 9, F(2,26) = 12.07, p = 0.0002), and long-term memory after spaced training (D”; n = 9, F(2,26) = 6.28, p = 0.0064). (E) Flies expressing Shits driven by the 37G11-GAL4 driver showed normal olfactory avoidance to octanol (Oct) and methylcyclohexanol (Mch) compared with their controls at the restrictive temperature (Oct, n = 14, F(2,41) = 2.41, p = 0.10; Mch, n = 14, F(2,41) = 0.23, p = 0.79). Data are presented as mean ± SEM. (F) Confocal z-projection of PD2a1 and PD2b1 driving both membrane-bound GFP (green) and Synaptotagmin-HA (gray). PD2a1 and PD2b1 has been manually segmented. The orange rectangle represents the inset. Inset: a single slice of PD2a1 and PD2b1 dendrites showing punctate Synaptotagmin-HA, indicating dendritic presynapses. The image is representative of n = 5. (G–G”). ChAT immunohistochemistry demonstrating that PD2a1 and PD2b1 neurons are cholinergic. The images show a representative slice (n = 4 stacks). Scale bars, 5 μm. See also Figures S1–S3.CC BY · PubMed Central
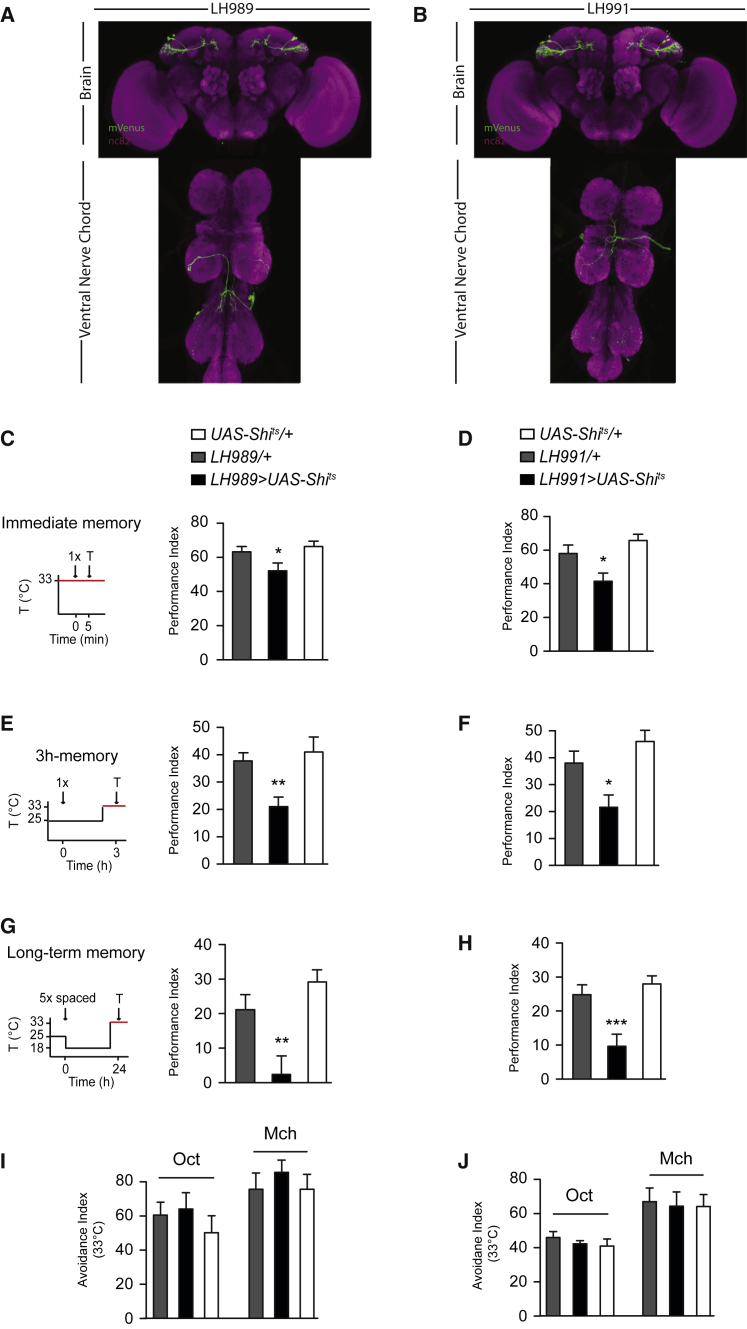
Figure 2 Specific Control with the Split-GAL4 System Confirms PD2a1 and PD2b1’s Role in Memory Retrieval, but Not Innate Behavior (A and B) Confocal z-projections of split-GAL4 lines targeting PD2a1 and PD2b1 neurons, LH989 (A) and LH991 (B). mVenus membrane stain, green; neuropil, magenta. Flies expressing Shits by the split-GAL4 lines LH989 or LH991 were trained and tested according to the illustrated protocols along with genotypic controls (restrictive temperature in red). (C and D) Silencing PD2a1 and PD2b1 neurons using LH989 (C; n = 14–15, F(2,42) = 4.13, p = 0.02) or LH991 (D; n = 18, F(2,53) = 7.27, p = 0.0017) impaired immediate memory after single-cycle training. (E and F) Silencing PD2a1 and PD2b1 neurons during the retrieval phase 3 hr after single-cycle training using LH989 (E; n = 14, F(2,42) = 6.73, p = 0.0031) or LH991 (F; n = 11–13, F(2,35) = 8.23, p = 0.0013) caused a memory defect. (G and H) Silencing PD2a1 and PD2b1 neurons during the retrieval phase 24 hr after spaced training using LH989 (G; n = 7–9, F(2,23) = 9.79, p = 0.0010) or LH991 (H; n = 19–23, F(2,72) = 10.83, p < 0.0001) abolished performance. (I and J) Silencing PD2a1 and PD2b1 neurons using LH989 (I; Oct, n = 8–12, F(2,29) = 0.63, p = 0.54; Mch, n = 10, F(2,29) = 0.44, p = 0.65) or LH991 (J; Oct, n = 7–8, F(2,22) = 0.25, p = 0.78; Mch, n = 7, F(2,20) = 0.068, p = 0.93) had no effect on naive avoidance of Oct or Mch. ∗p < 0.05, ∗∗p < 0.01, ∗∗∗p < 0.001. Data are presented as mean ± SEM. See also Figures S4 and S5.
Figure 2 Specific Control with the Split-GAL4 System Confirms PD2a1 and PD2b1’s Role in Memory Retrieval, but Not Innate Behavior (A and B) Confocal z-projections of split-GAL4 lines targeting PD2a1 and PD2b1 neurons, LH989 (A) and LH991 (B). mVenus membrane stain, green; neuropil, magenta. Flies expressing Shits by the split-GAL4 lines LH989 or LH991 were trained and tested according to the illustrated protocols along with genotypic controls (restrictive temperature in red). (C and D) Silencing PD2a1 and PD2b1 neurons using LH989 (C; n = 14–15, F(2,42) = 4.13, p = 0.02) or LH991 (D; n = 18, F(2,53) = 7.27, p = 0.0017) impaired immediate memory after single-cycle training. (E and F) Silencing PD2a1 and PD2b1 neurons during the retrieval phase 3 hr after single-cycle training using LH989 (E; n = 14, F(2,42) = 6.73, p = 0.0031) or LH991 (F; n = 11–13, F(2,35) = 8.23, p = 0.0013) caused a memory defect. (G and H) Silencing PD2a1 and PD2b1 neurons during the retrieval phase 24 hr after spaced training using LH989 (G; n = 7–9, F(2,23) = 9.79, p = 0.0010) or LH991 (H; n = 19–23, F(2,72) = 10.83, p < 0.0001) abolished performance. (I and J) Silencing PD2a1 and PD2b1 neurons using LH989 (I; Oct, n = 8–12, F(2,29) = 0.63, p = 0.54; Mch, n = 10, F(2,29) = 0.44, p = 0.65) or LH991 (J; Oct, n = 7–8, F(2,22) = 0.25, p = 0.78; Mch, n = 7, F(2,20) = 0.068, p = 0.93) had no effect on naive avoidance of Oct or Mch. ∗p < 0.05, ∗∗p < 0.01, ∗∗∗p < 0.001. Data are presented as mean ± SEM. See also Figures S4 and S5.CC BY · PubMed Central
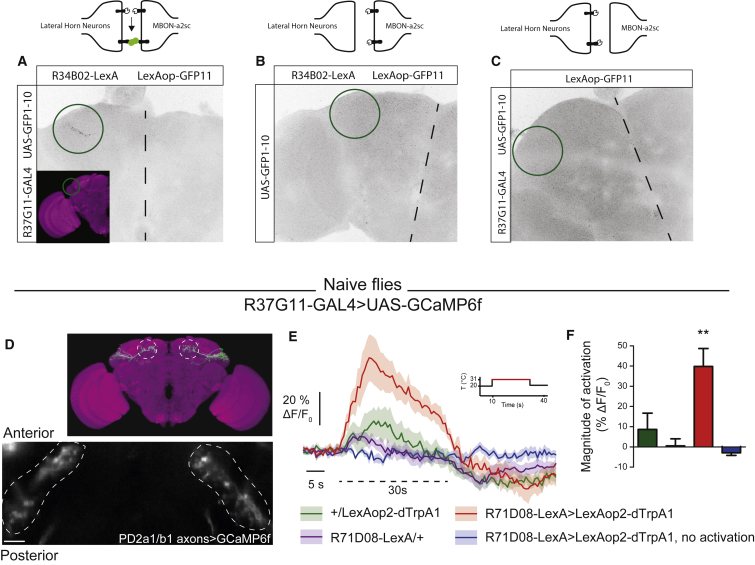
Figure 3 MBON-ɑ2sc Is Functionally Connected to PD2a1 and PD2b1 (A–C) GRASP signal in the dorsal LH (green circles, dashed lines indicate midlines) for the experimental genotype (A) and two controls (B and C). Genotypes and controls are represented in the schematics above each figure. Images are representative of n = 3. (D) GCaMP6f was expressed in PD2a1 and PD2b1 neurons with the R37G11-GAL4 driver (scale bar, 10 μm). Fluorescence was recorded in vivo from the axonal compartment of PD2a1 and PD2b1 neurons while the temperature was shifted from 20°C to 31°C (dashed line on F, except for the blue trace). (E) The calcium increase of PD2a1 and PD2b1 neurons because of thermal activation of V2 MBONs (red trace) was stronger than that because of temperature shift only in the genotypic controls (green and purple traces). (F) Quantification of calcium increase from the traces (n = 10 flies per condition, except 71D08-LexA/+ [n = 8], F(3,37) = 9.09, p = 0.0001). ∗∗p < 0.01. Data are presented as mean ± SEM. See also Figure S6.
Figure 3 MBON-ɑ2sc Is Functionally Connected to PD2a1 and PD2b1 (A–C) GRASP signal in the dorsal LH (green circles, dashed lines indicate midlines) for the experimental genotype (A) and two controls (B and C). Genotypes and controls are represented in the schematics above each figure. Images are representative of n = 3. (D) GCaMP6f was expressed in PD2a1 and PD2b1 neurons with the R37G11-GAL4 driver (scale bar, 10 μm). Fluorescence was recorded in vivo from the axonal compartment of PD2a1 and PD2b1 neurons while the temperature was shifted from 20°C to 31°C (dashed line on F, except for the blue trace). (E) The calcium increase of PD2a1 and PD2b1 neurons because of thermal activation of V2 MBONs (red trace) was stronger than that because of temperature shift only in the genotypic controls (green and purple traces). (F) Quantification of calcium increase from the traces (n = 10 flies per condition, except 71D08-LexA/+ [n = 8], F(3,37) = 9.09, p = 0.0001). ∗∗p < 0.01. Data are presented as mean ± SEM. See also Figure S6.CC BY · PubMed Central
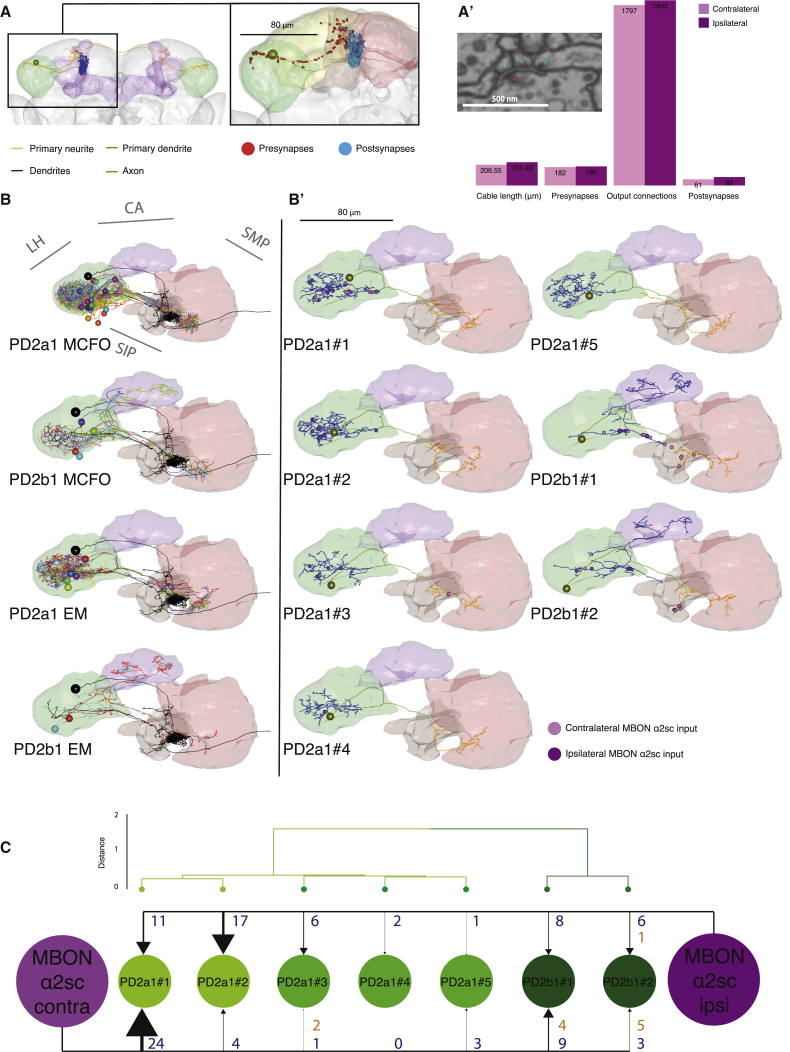
Figure 4 Electron Microscopy Reconstruction of PD2a1 and PD2b1 (A) Reconstruction of the right-side MBON-ɑ2sc in a whole brain EM volume. The cell body is represented as a sphere, and the primary neurite (yellow-green), primary dendrite (green), dendrite (blue), and axon (orange) compartments are separately colored. Neuropils: LH in green, MB in purple. Inset: position of presynapses (red spheres) and postsynapses (cyan spheres) on the right-side MBON-ɑ2sc. Neuropils: SLP in yellow, SIP in orange, SMP in red. (A’) Comparison of different metrics for the reconstructions of the contralateral and ipsilateral MBON-ɑ2sc within the LH (green in A). Inset: example of a polyadic synapse with a single T-bar (red dot) and multiple postsynapses (blue dots), referred to as “output connections” in the bar chart. Scale bar, 500 nm. (B) Dorsal view of co-registered PD2a1 and PD2b1 MCFO data (top two panels, respectively) and EM reconstructions (bottom two panels, respectively). Cells are individually colored. Ipsilateral MBON-ɑ2sc is shown in black. (B’) Dorsal view of single PD2a1 and PD2b1 neurons reconstructed in the EM volume. Yellow-green spheres represent somata, whereas ipsilateral and contralateral MBON-ɑ2sc synaptic connections are represented in dark and light purple, respectively. (C) Schematic of synaptic connectivity from the two MBON-ɑ2sc neurons onto each PD2a1 and PD2b1 cell. The PD2a1 and PD2b1 cells are clustered according to the NBLAST score of their axons and dendrites, identifying two main groups, PD2a1 and PD2b1. Numbers beside each arrow indicate the number of outgoing connections made onto PD2a1 and PD2b1 neurons dendro-dendritically (blue) and axo-axonically (orange). Contra, contralateral; ipsi, ipsilateral; LH, lateral horn; CA, mushroom body calyx; SIP, superior intermediate protocerebrum; SLP, superior lateral protocerebrum; SMP, superior medial protocerebrum. See also Figures S7 and S8.
Figure 4 Electron Microscopy Reconstruction of PD2a1 and PD2b1 (A) Reconstruction of the right-side MBON-ɑ2sc in a whole brain EM volume. The cell body is represented as a sphere, and the primary neurite (yellow-green), primary dendrite (green), dendrite (blue), and axon (orange) compartments are separately colored. Neuropils: LH in green, MB in purple. Inset: position of presynapses (red spheres) and postsynapses (cyan spheres) on the right-side MBON-ɑ2sc. Neuropils: SLP in yellow, SIP in orange, SMP in red. (A’) Comparison of different metrics for the reconstructions of the contralateral and ipsilateral MBON-ɑ2sc within the LH (green in A). Inset: example of a polyadic synapse with a single T-bar (red dot) and multiple postsynapses (blue dots), referred to as “output connections” in the bar chart. Scale bar, 500 nm. (B) Dorsal view of co-registered PD2a1 and PD2b1 MCFO data (top two panels, respectively) and EM reconstructions (bottom two panels, respectively). Cells are individually colored. Ipsilateral MBON-ɑ2sc is shown in black. (B’) Dorsal view of single PD2a1 and PD2b1 neurons reconstructed in the EM volume. Yellow-green spheres represent somata, whereas ipsilateral and contralateral MBON-ɑ2sc synaptic connections are represented in dark and light purple, respectively. (C) Schematic of synaptic connectivity from the two MBON-ɑ2sc neurons onto each PD2a1 and PD2b1 cell. The PD2a1 and PD2b1 cells are clustered according to the NBLAST score of their axons and dendrites, identifying two main groups, PD2a1 and PD2b1. Numbers beside each arrow indicate the number of outgoing connections made onto PD2a1 and PD2b1 neurons dendro-dendritically (blue) and axo-axonically (orange). Contra, contralateral; ipsi, ipsilateral; LH, lateral horn; CA, mushroom body calyx; SIP, superior intermediate protocerebrum; SLP, superior lateral protocerebrum; SMP, superior medial protocerebrum. See also Figures S7 and S8.CC BY · PubMed Central
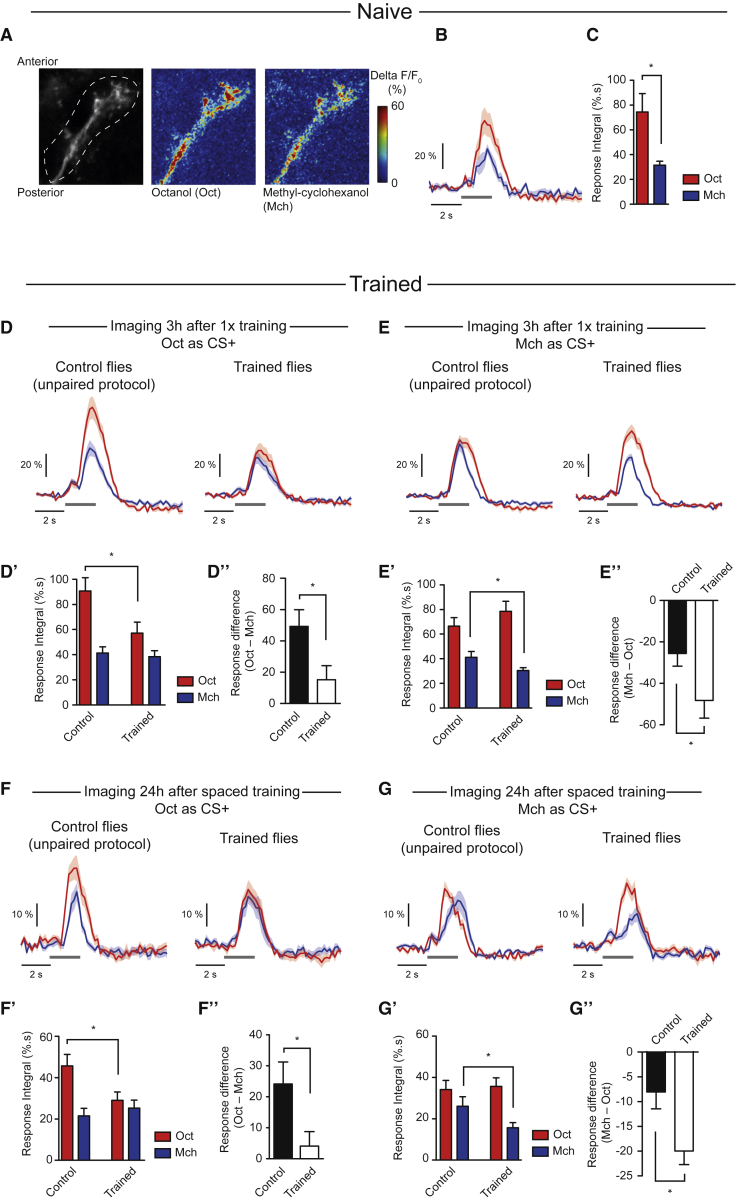
Figure 5 PD2a1 and PD2b1 Decrease Response to the CS+ after Training (A) GCaMP3 was expressed in PD2a1 and PD2b1 with R37G11-GAL4. Olfactory responses to Oct and Mch were recorded in vivo from the axonal compartment of PD2a1 and b1 neurons. (B and C) In naive flies, the calcium increase in PD2a1 and PD2b1 neurons in response to Oct was larger than Mch (average traces from n = 6 flies; t test, p = 0.015; B, average time trace; C, bar chart of response integral). (D–D”) Odor responses were recorded 3 hr after single-cycle training using Oct as CS+ (n = 19 flies) or after the corresponding unpaired control protocol (n = 20 flies) (Figure S9A).The integral of the odor responses (D’; t test, p = 0.023) and the calculation of the difference between Oct and Mch responses (D”; t test, p = 0.024) revealed a decreased response to the CS+ after the associative protocol. (E–E”) Odor responses were recorded 3 hr after single-cycle training using Mch as CS+ (n = 22 flies) or after the corresponding unpaired control protocol (n = 21 flies) (Figure S9B). The integral of the odor responses (E’; p = 0.047) and the calculation of the difference between Mch and Oct responses (E”; t test, p = 0.041) revealed a decreased response to the CS+ after the associative protocol. (F–F”) Odor responses were recorded 24 hr after spaced training using Oct as CS+ (n = 9 flies) or after the corresponding unpaired control protocol (n = 11 flies) (Figure S9C). The integral of the odor responses (F’; t test, p = 0.036) and the calculation of the difference between Oct and Mch responses (F”; t test, p = 0.035) revealed a decreased response to the CS+ after the associative protocol. (G–G”) Odor responses were recorded 24 hr after spaced training using Mch as CS+ (n = 9 flies) or after the corresponding unpaired control protocol (n = 9 flies) (Figure S9C). The integral of the odor responses (G’; t test, p = 0.047) and the calculation of the difference between Mch and Oct responses (G”; t test, p = 0.010) revealed a decreased response to the CS+ after the associative protocol. ∗p < 0.05. Data are presented as mean ± SEM. Gray bars indicate periods of olfactory stimulation. See also Figure S9.
Figure 5 PD2a1 and PD2b1 Decrease Response to the CS+ after Training (A) GCaMP3 was expressed in PD2a1 and PD2b1 with R37G11-GAL4. Olfactory responses to Oct and Mch were recorded in vivo from the axonal compartment of PD2a1 and b1 neurons. (B and C) In naive flies, the calcium increase in PD2a1 and PD2b1 neurons in response to Oct was larger than Mch (average traces from n = 6 flies; t test, p = 0.015; B, average time trace; C, bar chart of response integral). (D–D”) Odor responses were recorded 3 hr after single-cycle training using Oct as CS+ (n = 19 flies) or after the corresponding unpaired control protocol (n = 20 flies) (Figure S9A).The integral of the odor responses (D’; t test, p = 0.023) and the calculation of the difference between Oct and Mch responses (D”; t test, p = 0.024) revealed a decreased response to the CS+ after the associative protocol. (E–E”) Odor responses were recorded 3 hr after single-cycle training using Mch as CS+ (n = 22 flies) or after the corresponding unpaired control protocol (n = 21 flies) (Figure S9B). The integral of the odor responses (E’; p = 0.047) and the calculation of the difference between Mch and Oct responses (E”; t test, p = 0.041) revealed a decreased response to the CS+ after the associative protocol. (F–F”) Odor responses were recorded 24 hr after spaced training using Oct as CS+ (n = 9 flies) or after the corresponding unpaired control protocol (n = 11 flies) (Figure S9C). The integral of the odor responses (F’; t test, p = 0.036) and the calculation of the difference between Oct and Mch responses (F”; t test, p = 0.035) revealed a decreased response to the CS+ after the associative protocol. (G–G”) Odor responses were recorded 24 hr after spaced training using Mch as CS+ (n = 9 flies) or after the corresponding unpaired control protocol (n = 9 flies) (Figure S9C). The integral of the odor responses (G’; t test, p = 0.047) and the calculation of the difference between Mch and Oct responses (G”; t test, p = 0.010) revealed a decreased response to the CS+ after the associative protocol. ∗p < 0.05. Data are presented as mean ± SEM. Gray bars indicate periods of olfactory stimulation. See also Figure S9.CC BY · PubMed Central
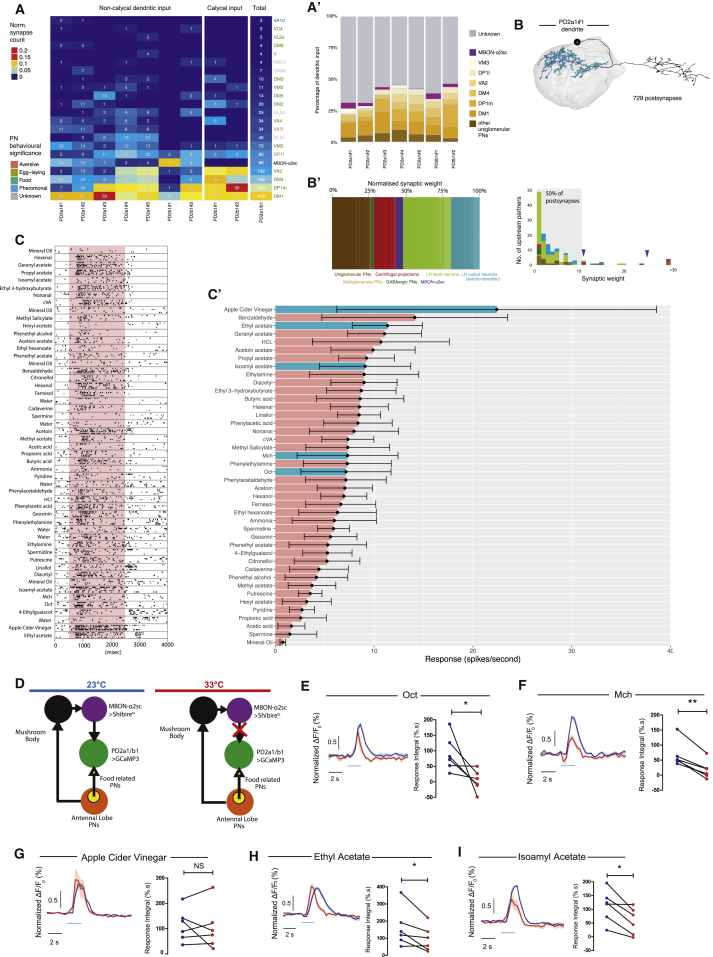
Figure 6 PD2a1 and PD2b1 Receive Input from Appetitive PNs and Are Broadly Tuned (A) Summary heatmap of antennal lobe glomeruli with uniglomerular, excitatory PN connectivity to individual PD2a1 and PD2b1 neurons as determined by EM reconstruction. The connectivity heatmap is separated by neuropil location: PD2a1 and PD2b1 LH dendrites, PD2b1 MB calyx dendrites and total across all PD2a1 and PD2b1 dendrites. Cell numbers represent the number of synapses, and heatmap coloring represents the synapse count normalized by the total number of postsynapses in that neuropil. Uniglomerular PNs with no connectivity are not shown. Uniglomerular PNs from connected glomeruli or MBON-ɑ2sc are ordered by connection strength. PN names are colored by their behavioral significance based on published studies. (A’) The number of synaptic inputs for all PD2a1 and PD2b1 dendrites traced in this study. Input is either undefined (gray), uniglomerular PN (oranges), or MBON-ɑ2sc (purple). (B) Reconstruction of all presynaptic partners to PD2a1#1 in the EM volume. Shown is the PD2a1#1 EM-reconstructed skeleton with dendritic postsynapses highlighted in blue. (B’) Right: stacked bar chart showing the percentages of postsynapses contributed by different types of input neurons (different colors). Left: histogram showing the number of upstream postsynpatic partners against their synaptic weight (number of synapses onto PD2a1#1). The gray box highlights that 50% of PD2a1#1’s postsynapses are spent on neurons that only input PD2a1#1 by less than 10 synaptic connections. MBON-ɑ2sc is indicated by purple arrowheads. (C) Electrophysiological recording raster plot from a representative PD2a1 neuron. The responses of each cell to the different odors are stacked, black squares represent action potentials, and there are 4 presentations of each odor. The red block represents the odor stimulation period. (C’) Tuning curve of PD2a1 and PD2b1 neurons. Responses are shown in hertz. Data are mean ± SEM; n = 7 cells, consisting of one PD2b1, one PD2a1 or PD2b1, and five PD2a1 neurons. Odors in the text are shown in cyan. (D) Schematic for imaging experiments with MBON-ɑ2sc silencing. Flies express Shits in MBON-ɑ2sc and GCaMP3 in PD2a1 and PD2b1 neurons for calcium imaging. At the permissive temperature (left), there is no effect on MBON-ɑ2sc neurotransmission, and PD2a1 and PD2b1 neurons receive input from both MBON-ɑ2sc and directly from the antennal lobe. MBON-ɑ2sc is silenced at the restrictive temperature (right), although the PD2a1 and PD2b1 neurons still receive input from the antennal lobe. (E) Response of PD2a1 and PD2b1 axons to Oct with or without MBON-ɑ2sc silencing. Left: time traces of normalized GCaMP3 fluorescence (STAR Methods) are shown at permissive (blue) and restrictive (red) temperature in response to Oct stimulation (light blue bar). Right: the integral of the absolute odor responses for each fly at the permissive (blue) and restrictive (red) temperatures are plotted, which revealed decreased response to Oct after MBON-ɑ2sc silencing (n = 6, paired t test = 0.044). (F) Response of PD2a1 and PD2b1 axons to Mch with or without MBON-ɑ2sc silencing. The layout of the data is the same as in (E). This revealed a decreased response to Mch after MBON-ɑ2sc silencing (n = 6, paired t test = 0.0015). (G) Response of PD2a1 and PD2b1 axons to vinegar with or without MBON-ɑ2sc silencing. The layout of the data is the same as in (E). There was no change in response to vinegar after MBON-ɑ2sc silencing (n = 6, paired t test = 0.67). (H) Response of PD2a1 and PD2b1 axons to ethyl acetate with or without MBON-ɑ2sc silencing. The layout of the data is the same as in (E). This revealed a decreased response to ethyl acetate after MBON-ɑ2sc silencing (n = 6, paired t test = 0.039). (I) Response of PD2a1 and PD2b1 axons to isoamyl acetate with or without MBON-ɑ2sc silencing. This revealed a decreased response to isoamyl acetate after MBON-ɑ2sc silencing (n = 6, paired t test = 0.012). ∗p < 0.05, ∗∗p < 0.01. See also Figure S10.
Figure 6 PD2a1 and PD2b1 Receive Input from Appetitive PNs and Are Broadly Tuned (A) Summary heatmap of antennal lobe glomeruli with uniglomerular, excitatory PN connectivity to individual PD2a1 and PD2b1 neurons as determined by EM reconstruction. The connectivity heatmap is separated by neuropil location: PD2a1 and PD2b1 LH dendrites, PD2b1 MB calyx dendrites and total across all PD2a1 and PD2b1 dendrites. Cell numbers represent the number of synapses, and heatmap coloring represents the synapse count normalized by the total number of postsynapses in that neuropil. Uniglomerular PNs with no connectivity are not shown. Uniglomerular PNs from connected glomeruli or MBON-ɑ2sc are ordered by connection strength. PN names are colored by their behavioral significance based on published studies. (A’) The number of synaptic inputs for all PD2a1 and PD2b1 dendrites traced in this study. Input is either undefined (gray), uniglomerular PN (oranges), or MBON-ɑ2sc (purple). (B) Reconstruction of all presynaptic partners to PD2a1#1 in the EM volume. Shown is the PD2a1#1 EM-reconstructed skeleton with dendritic postsynapses highlighted in blue. (B’) Right: stacked bar chart showing the percentages of postsynapses contributed by different types of input neurons (different colors). Left: histogram showing the number of upstream postsynpatic partners against their synaptic weight (number of synapses onto PD2a1#1). The gray box highlights that 50% of PD2a1#1’s postsynapses are spent on neurons that only input PD2a1#1 by less than 10 synaptic connections. MBON-ɑ2sc is indicated by purple arrowheads. (C) Electrophysiological recording raster plot from a representative PD2a1 neuron. The responses of each cell to the different odors are stacked, black squares represent action potentials, and there are 4 presentations of each odor. The red block represents the odor stimulation period. (C’) Tuning curve of PD2a1 and PD2b1 neurons. Responses are shown in hertz. Data are mean ± SEM; n = 7 cells, consisting of one PD2b1, one PD2a1 or PD2b1, and five PD2a1 neurons. Odors in the text are shown in cyan. (D) Schematic for imaging experiments with MBON-ɑ2sc silencing. Flies express Shits in MBON-ɑ2sc and GCaMP3 in PD2a1 and PD2b1 neurons for calcium imaging. At the permissive temperature (left), there is no effect on MBON-ɑ2sc neurotransmission, and PD2a1 and PD2b1 neurons receive input from both MBON-ɑ2sc and directly from the antennal lobe. MBON-ɑ2sc is silenced at the restrictive temperature (right), although the PD2a1 and PD2b1 neurons still receive input from the antennal lobe. (E) Response of PD2a1 and PD2b1 axons to Oct with or without MBON-ɑ2sc silencing. Left: time traces of normalized GCaMP3 fluorescence (STAR Methods) are shown at permissive (blue) and restrictive (red) temperature in response to Oct stimulation (light blue bar). Right: the integral of the absolute odor responses for each fly at the permissive (blue) and restrictive (red) temperatures are plotted, which revealed decreased response to Oct after MBON-ɑ2sc silencing (n = 6, paired t test = 0.044). (F) Response of PD2a1 and PD2b1 axons to Mch with or without MBON-ɑ2sc silencing. The layout of the data is the same as in (E). This revealed a decreased response to Mch after MBON-ɑ2sc silencing (n = 6, paired t test = 0.0015). (G) Response of PD2a1 and PD2b1 axons to vinegar with or without MBON-ɑ2sc silencing. The layout of the data is the same as in (E). There was no change in response to vinegar after MBON-ɑ2sc silencing (n = 6, paired t test = 0.67). (H) Response of PD2a1 and PD2b1 axons to ethyl acetate with or without MBON-ɑ2sc silencing. The layout of the data is the same as in (E). This revealed a decreased response to ethyl acetate after MBON-ɑ2sc silencing (n = 6, paired t test = 0.039). (I) Response of PD2a1 and PD2b1 axons to isoamyl acetate with or without MBON-ɑ2sc silencing. This revealed a decreased response to isoamyl acetate after MBON-ɑ2sc silencing (n = 6, paired t test = 0.012). ∗p < 0.05, ∗∗p < 0.01. See also Figure S10.CC BY · PubMed Central
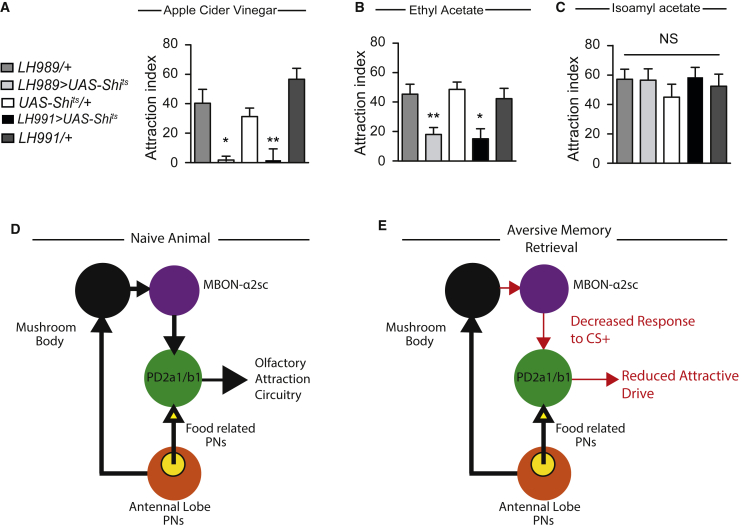
Figure 7 PD2a1 and PD2b1 Mediate Innate Olfactory Attraction, Leading to a Model of Aversive Memory Retrieval (A) Flies expressing Shits driven by either LH989 or LH991 showed impaired attraction to apple cider vinegar relative to their genotype controls at the restrictive temperature (n = 9, F(4,44) = 12.10, p < 0.0001). (B) Flies expressing Shits driven by either LH989 or LH991 showed impaired attraction to ethyl acetate relative to their genotype controls at the restrictive temperature (n = 13-16, F(4,73) = 6.34, p = 0.0002). (C) Flies expressing Shits driven by either LH989 or LH991 showed impaired attraction to isoamyl acetate relative to their genotype controls at the restrictive temperature (n = 8-9, F(4,42) = 0.53, p = 0.72). (D and E) Model for how PD2a1 and PD2b1 functions in naive and trained animals. (D) In naive animals, PD2a1 and PD2b1 receives input from both the MB (black sphere, via broadly tuned MBON-ɑ2sc) and directly from the AL food-related PNs (yellow sphere within AL). PD2a1 and PD2b1 activity is necessary for approach behavior to some olfactory stimuli. (E) After conditioning, the response of MBON-ɑ2sc to the CS+ is reduced via synaptic depression at the MB-to-MBON synapse. This results in a decreased response to the CS+ in PD2a1 and PD2b1. Because PD2a1 and PD2b1 are cholinergic and excitatory, this reduces the input onto downstream approach circuits, resulting in decreased attraction to the CS+ during memory recall. ∗p < 0.05, ∗∗p < 0.01. See also Figure S10.
Figure 7 PD2a1 and PD2b1 Mediate Innate Olfactory Attraction, Leading to a Model of Aversive Memory Retrieval (A) Flies expressing Shits driven by either LH989 or LH991 showed impaired attraction to apple cider vinegar relative to their genotype controls at the restrictive temperature (n = 9, F(4,44) = 12.10, p < 0.0001). (B) Flies expressing Shits driven by either LH989 or LH991 showed impaired attraction to ethyl acetate relative to their genotype controls at the restrictive temperature (n = 13-16, F(4,73) = 6.34, p = 0.0002). (C) Flies expressing Shits driven by either LH989 or LH991 showed impaired attraction to isoamyl acetate relative to their genotype controls at the restrictive temperature (n = 8-9, F(4,42) = 0.53, p = 0.72). (D and E) Model for how PD2a1 and PD2b1 functions in naive and trained animals. (D) In naive animals, PD2a1 and PD2b1 receives input from both the MB (black sphere, via broadly tuned MBON-ɑ2sc) and directly from the AL food-related PNs (yellow sphere within AL). PD2a1 and PD2b1 activity is necessary for approach behavior to some olfactory stimuli. (E) After conditioning, the response of MBON-ɑ2sc to the CS+ is reduced via synaptic depression at the MB-to-MBON synapse. This results in a decreased response to the CS+ in PD2a1 and PD2b1. Because PD2a1 and PD2b1 are cholinergic and excitatory, this reduces the input onto downstream approach circuits, resulting in decreased attraction to the CS+ during memory recall. ∗p < 0.05, ∗∗p < 0.01. See also Figure S10.CC BY · PubMed Central
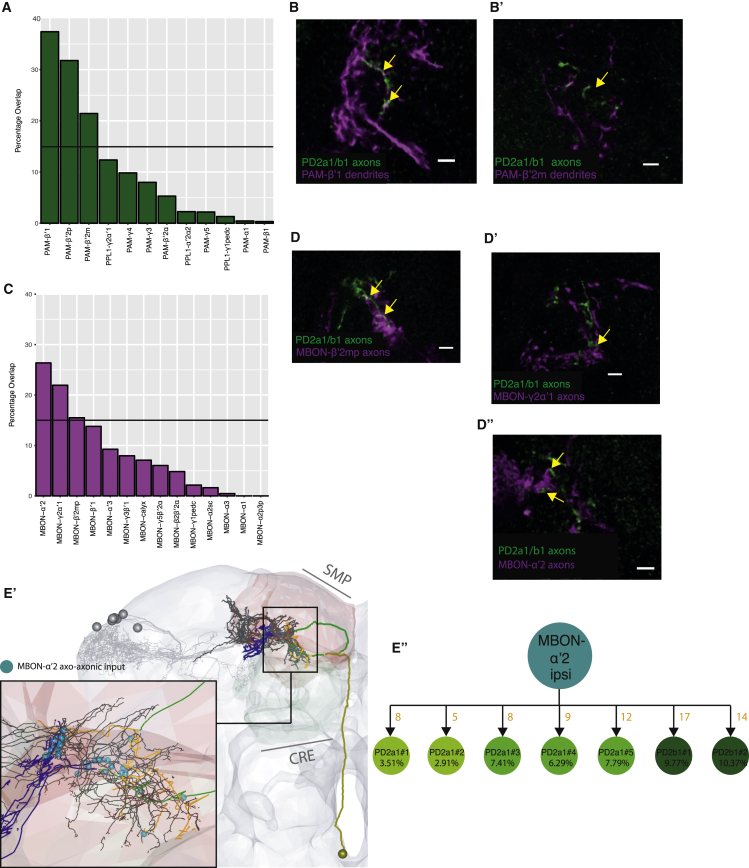
Figure 8 PD2a1 and PD2b1 Axons Interdigitate and Interact with DAN Dendrites and MBON Axons (A) Histogram of light microscopy overlap between a mask of PD2a1 and PD2b1 axons and masks of the dendrites of DANs (along the x axis). (B and B’) Confocal imaging of double labeling between PD2a1 and PD2b1 axons (labeled with GFP, green) and DAN dendrites (labeled with RFP, magenta). PAM-β’1 dendrites (B) and PAM-β’2m dendrites (B’). (C) Histogram of light microscopy overlap between a mask of PD2a1 and PD2b1 axons and masks of the dendrites of most MBONs (along the x axis). (D–D”) Confocal imaging of double labeling between PD2a1 and PD2b1 axons (labeled with GFP, green) and MBONs (labeled with RFP, magenta). Shown are MBON-β’2mp axons (D), MBON-y2ɑ’1 axons (D’), and MBON -ɑ′2 axons (D”). (E) Visualization of MBON-ɑ’2 axons interdigitating with PD2a1 and PD2b1 axons (black) in the EM volume. Other PD2a1 and PD2b1 neurons are shown in gray. Inset: positions of axo-axonic connections from MBON-ɑ’2 onto PD2a1 and PD2b1 neurons, shown as cyan spheres. (E’) Summary of ipsilateral MBON-ɑ’2′s axo-axonic connectivity onto PD2a1 and PD2b1 cells. Double labeling images are examples from n = 3 brains. For double labeling, the scale bar represents 5 μm.
Figure 8 PD2a1 and PD2b1 Axons Interdigitate and Interact with DAN Dendrites and MBON Axons (A) Histogram of light microscopy overlap between a mask of PD2a1 and PD2b1 axons and masks of the dendrites of DANs (along the x axis). (B and B’) Confocal imaging of double labeling between PD2a1 and PD2b1 axons (labeled with GFP, green) and DAN dendrites (labeled with RFP, magenta). PAM-β’1 dendrites (B) and PAM-β’2m dendrites (B’). (C) Histogram of light microscopy overlap between a mask of PD2a1 and PD2b1 axons and masks of the dendrites of most MBONs (along the x axis). (D–D”) Confocal imaging of double labeling between PD2a1 and PD2b1 axons (labeled with GFP, green) and MBONs (labeled with RFP, magenta). Shown are MBON-β’2mp axons (D), MBON-y2ɑ’1 axons (D’), and MBON -ɑ′2 axons (D”). (E) Visualization of MBON-ɑ’2 axons interdigitating with PD2a1 and PD2b1 axons (black) in the EM volume. Other PD2a1 and PD2b1 neurons are shown in gray. Inset: positions of axo-axonic connections from MBON-ɑ’2 onto PD2a1 and PD2b1 neurons, shown as cyan spheres. (E’) Summary of ipsilateral MBON-ɑ’2′s axo-axonic connectivity onto PD2a1 and PD2b1 cells. Double labeling images are examples from n = 3 brains. For double labeling, the scale bar represents 5 μm.CC BY · PubMed Central

Verification

Claims the paper makes

The claims and statistics of this paper haven’t been checked yet.

Run the check — free, no account needed. It reads the open-access text and checks the sources it cites.

A few free checks a day · papers already verified open instantly · results are public

Claims other papers make about this one

Each is checked against this paper’s own text: does it say what the citing paper says it does?

Self-check

Percentages, sums and reported differences re-computed from the paper’s own numbers.

The self-check needs the paper’s full text.

Citations

Cites

Show all 13 references

Research works printed but not linked: 52

  1. Aso, 2014, The neuronal architecture of the mushroom body provides a logic for associative learning, eLife, 3, e04577, 10.7554/eLife.04577 · DOI · Paper page
  2. Aso, 2014, Mushroom body output neurons encode valence and guide memory-based action selection in Drosophila, eLife, 3, e04580, 10.7554/eLife.04580 · DOI
  3. Badel, 2016, Decoding of context-dependent olfactory behavior in Drosophila, Neuron, 91, 155, 10.1016/j.neuron.2016.05.022 · DOI
  4. Bouzaiane, 2015, Two independent mushroom body output circuits retrieve the six discrete components of Drosophila aversive memory, Cell Rep., 11, 1280, 10.1016/j.celrep.2015.04.044 · DOI
  5. Chen, 2017, The BLOC-1 subunit Pallidin facilitates activity-dependent synaptic vesicle recycling, eNeuro, 4, 10.1523/ENEURO.0335-16.2017 · DOI
  6. Chiang, 2011, Three-dimensional reconstruction of brain-wide wiring networks in Drosophila at single-cell resolution, Curr. Biol., 21, 1, 10.1016/j.cub.2010.11.056 · DOI · Paper page
  7. Choi, 2011, Driving opposing behaviors with ensembles of piriform neurons, Cell, 146, 1004, 10.1016/j.cell.2011.07.041 · DOI
  8. Christiansen, 2011, Presynapses in Kenyon cell dendrites in the mushroom body calyx of Drosophila, J. Neurosci., 31, 9696, 10.1523/JNEUROSCI.6542-10.2011 · DOI
  9. Costa, 2016, NBLAST: rapid, sensitive comparison of neuronal structure and construction of neuron family databases, Neuron, 91, 293, 10.1016/j.neuron.2016.06.012 · DOI · Paper page
  10. Diao, 2015, Plug-and-play genetic access to Drosophila cell types using exchangeable exon cassettes, Cell Rep., 10, 1410, 10.1016/j.celrep.2015.01.059 · DOI
  11. Fişek, 2014, Stereotyped connectivity and computations in higher-order olfactory neurons, Nat. Neurosci., 17, 280, 10.1038/nn.3613 · DOI
  12. Gohl, 2011, A versatile in vivo system for directed dissection of gene expression patterns, Nat. Methods, 8, 231, 10.1038/nmeth.1561 · DOI
  13. Hamada, 2008, An internal thermal sensor controlling temperature preference in Drosophila, Nature, 454, 217, 10.1038/nature07001 · DOI
  14. Heimbeck, 2001, A central neural circuit for experience-independent olfactory and courtship behavior in Drosophila melanogaster, Proc. Natl. Acad. Sci. USA, 98, 15336, 10.1073/pnas.011314898 · DOI
  15. Hige, 2015, Plasticity-driven individualization of olfactory coding in mushroom body output neurons, Nature, 526, 258, 10.1038/nature15396 · DOI
  16. Honegger, 2011, Cellular-resolution population imaging reveals robust sparse coding in the Drosophila mushroom body, J. Neurosci., 31, 11772, 10.1523/JNEUROSCI.1099-11.2011 · DOI
  17. Iurilli, 2017, Population coding in an innately relevant olfactory area, Neuron, 93, 1180, 10.1016/j.neuron.2017.02.010 · DOI
  18. Jefferis, 2007, Comprehensive maps of Drosophila higher olfactory centers: spatially segregated fruit and pheromone representation, Cell, 128, 1187, 10.1016/j.cell.2007.01.040 · DOI
  19. Keene, 2007, Drosophila olfactory memory: single genes to complex neural circuits, Nat. Rev. Neurosci., 8, 341, 10.1038/nrn2098 · DOI
  20. Keene, 2004, Diverse odor-conditioned memories require uniquely timed dorsal paired medial neuron output, Neuron, 44, 521, 10.1016/j.neuron.2004.10.006 · DOI
  21. Kitamoto, 2001, Conditional modification of behavior in Drosophila by targeted expression of a temperature-sensitive shibire allele in defined neurons, J. Neurobiol., 47, 81, 10.1002/neu.1018 · DOI
  22. Knaden, 2012, Spatial representation of odorant valence in an insect brain, Cell Rep., 1, 392, 10.1016/j.celrep.2012.03.002 · DOI
  23. Kohl, 2013, A bidirectional circuit switch reroutes pheromone signals in male and female brains, Cell, 155, 1610, 10.1016/j.cell.2013.11.025 · DOI · Paper page
  24. Lewis, 2015, A higher brain circuit for immediate integration of conflicting sensory information in Drosophila, Curr. Biol., 25, 2203, 10.1016/j.cub.2015.07.015 · DOI
  25. Liang, 2013, GABAergic projection neurons route selective olfactory inputs to specific higher-order neurons, Neuron, 79, 917, 10.1016/j.neuron.2013.06.014 · DOI
  26. Liu, 2012, A subset of dopamine neurons signals reward for odour memory in Drosophila, Nature, 488, 512, 10.1038/nature11304 · DOI
  27. Luan, 2006, Refined spatial manipulation of neuronal function by combinatorial restriction of transgene expression, Neuron, 52, 425, 10.1016/j.neuron.2006.08.028 · DOI · Paper page
  28. Manton, 2014, Combining genome-scale Drosophila 3D neuroanatomical data by bridging template brains, bioRxiv
  29. Marin, 2002, Representation of the glomerular olfactory map in the Drosophila brain, Cell, 109, 243, 10.1016/S0092-8674(02)00700-6 · DOI
  30. Masek, 2015, A dopamine-modulated neural circuit regulating aversive taste memory in Drosophila, Curr. Biol., 25, 1535, 10.1016/j.cub.2015.04.027 · DOI
  31. Masse, 2009, Olfactory information processing in Drosophila, Curr. Biol., 19, R700, 10.1016/j.cub.2009.06.026 · DOI
  32. Miyamichi, 2011, Cortical representations of olfactory input by trans-synaptic tracing, Nature, 472, 191, 10.1038/nature09714 · DOI
  33. Owald, 2015, Activity of defined mushroom body output neurons underlies learned olfactory behavior in Drosophila, Neuron, 86, 417, 10.1016/j.neuron.2015.03.025 · DOI · Paper page
  34. Parnas, 2013, Odor discrimination in Drosophila: from neural population codes to behavior, Neuron, 79, 932, 10.1016/j.neuron.2013.08.006 · DOI
  35. Pfeiffer, 2010, Refinement of tools for targeted gene expression in Drosophila, Genetics, 186, 735, 10.1534/genetics.110.119917 · DOI · Paper page
  36. Robinson, 2002, Synaptotagmins I and IV promote transmitter release independently of Ca(2+) binding in the C(2)A domain, Nature, 418, 336, 10.1038/nature00915 · DOI
  37. Root, 2014, The participation of cortical amygdala in innate, odour-driven behaviour, Nature, 515, 269, 10.1038/nature13897 · DOI
  38. Saalfeld, 2009, CATMAID: collaborative annotation toolkit for massive amounts of image data, Bioinformatics, 25, 1984, 10.1093/bioinformatics/btp266 · DOI · Paper page
  39. Schwabe, 2004, The central piriform cortex: anatomical connections and anticonvulsant effect of GABA elevation in the kindling model, Neuroscience, 126, 727, 10.1016/j.neuroscience.2004.04.022 · DOI
  40. Séjourné, 2011, Mushroom body efferent neurons responsible for aversive olfactory memory retrieval in Drosophila, Nat. Neurosci., 14, 903, 10.1038/nn.2846 · DOI
  41. Semmelhack, 2009, Select Drosophila glomeruli mediate innate olfactory attraction and aversion, Nature, 459, 218, 10.1038/nature07983 · DOI
  42. Sosulski, 2011, Distinct representations of olfactory information in different cortical centres, Nature, 472, 213, 10.1038/nature09868 · DOI · Paper page
  43. Stettler, 2009, Representations of odor in the piriform cortex, Neuron, 63, 854, 10.1016/j.neuron.2009.09.005 · DOI
  44. Strutz, 2014, Decoding odor quality and intensity in the Drosophila brain, eLife, 3, e04147, 10.7554/eLife.04147 · DOI
  45. Su, 2009, Olfactory perception: receptors, cells, and circuits, Cell, 139, 45, 10.1016/j.cell.2009.09.015 · DOI
  46. Tanaka, 2012, Organization of antennal lobe-associated neurons in adult Drosophila melanogaster brain, J. Comp. Neurol., 520, 4067, 10.1002/cne.23142 · DOI
  47. Tian, 2009, Imaging neural activity in worms, flies and mice with improved GCaMP calcium indicators, Nat. Methods, 6, 875, 10.1038/nmeth.1398 · DOI · Paper page
  48. Tully, 1994, Genetic dissection of consolidated memory in Drosophila, Cell, 79, 35, 10.1016/0092-8674(94)90398-0 · DOI · Paper page
  49. Vogt, 2014, Shared mushroom body circuits underlie visual and olfactory memories in Drosophila, eLife, 3, e02395, 10.7554/eLife.02395 · DOI
  50. Wilson, 2008, Neural and behavioral mechanisms of olfactory perception, Curr. Opin. Neurobiol., 18, 408, 10.1016/j.conb.2008.08.015 · DOI
  51. Wong, 2002, Spatial representation of the glomerular map in the Drosophila protocerebrum, Cell, 109, 229, 10.1016/S0092-8674(02)00707-9 · DOI
  52. Zheng, 2018, A complete electron microscopy volume of the brain of adult Drosophila melanogaster, Cell, 174, 730, 10.1016/j.cell.2018.06.019 · DOI · Paper page

Cited by

Sorted by citations

Metadata

Authors
Dolan, M.-J., Belliart-Guérin, G., Bates, A. S., Frechter, S., Lampin-Saint-Amaux, A., Aso, Y., Roberts, R. J. V., Schlegel, P., Wong, A., Hammad, A., Bock, D., Rubin, G. M., Preat, T., Plaçais, P.-Y., & Jefferis, G. S. X. E.
Venue
Neuron
Publisher
Elsevier BV
Published
2018-11
Volume
100
Issue
3
Pages
651-668.e8
ISSN
0896-6273
Cited by
118
References
13
Language
en
Funders
  • MRC LMB
  • Boehringer Ingelheim Fonds
  • Janelia
  • ERC (211089, 649111)
  • MRC (MC-U105188491)
  • Agence Nationale de la Recherche
  • Labex Memolife
  • Howard Hughes Medical Institute
  • Wellcome Trust (203261/Z/16/Z)
  • Cambridge Neuroscience-PSL
  • Embassy of France in London
  • HHMI Janelia Visiting Scientist Program
  • NIH (P40OD018537)

About these checks

Registry, retraction, Cites and statistics results are computed, not judged, with one exception: a printed reference that no index lists is read once by a model before it counts as a citation error. Claims are extracted by a model and kept only when their quote appears verbatim in the text; each cited source is then checked, with a model’s help, for whether it says what the claim relies on. Those verdicts can be wrong — read the claim’s quote and the cited source before relying on one.

Statistics and arithmetic are recomputed, not judged.

Confidence bands are shown only for fields calibrated on our annotated test set. None is calibrated yet, so no band is shown.

What counts as a claim ›How we measure confidence ›How we check this ›

Are you an author, or do you see a problem with this page? Request a review