

The DOI matches its Crossref record; 42 of the 42 references it cites were found in a registry or an index.
Inducing Different Neuronal Subtypes from Astrocytes in the Injured Mouse Cerebral Cortex
Open accessAbstract
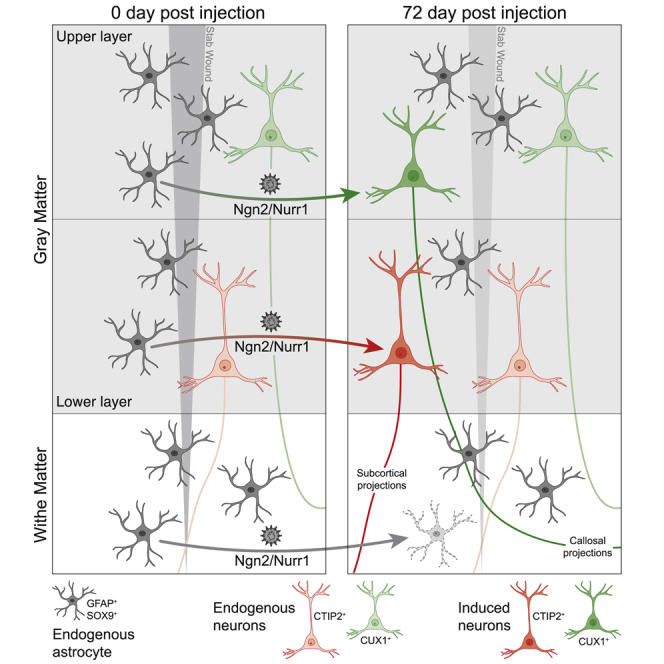
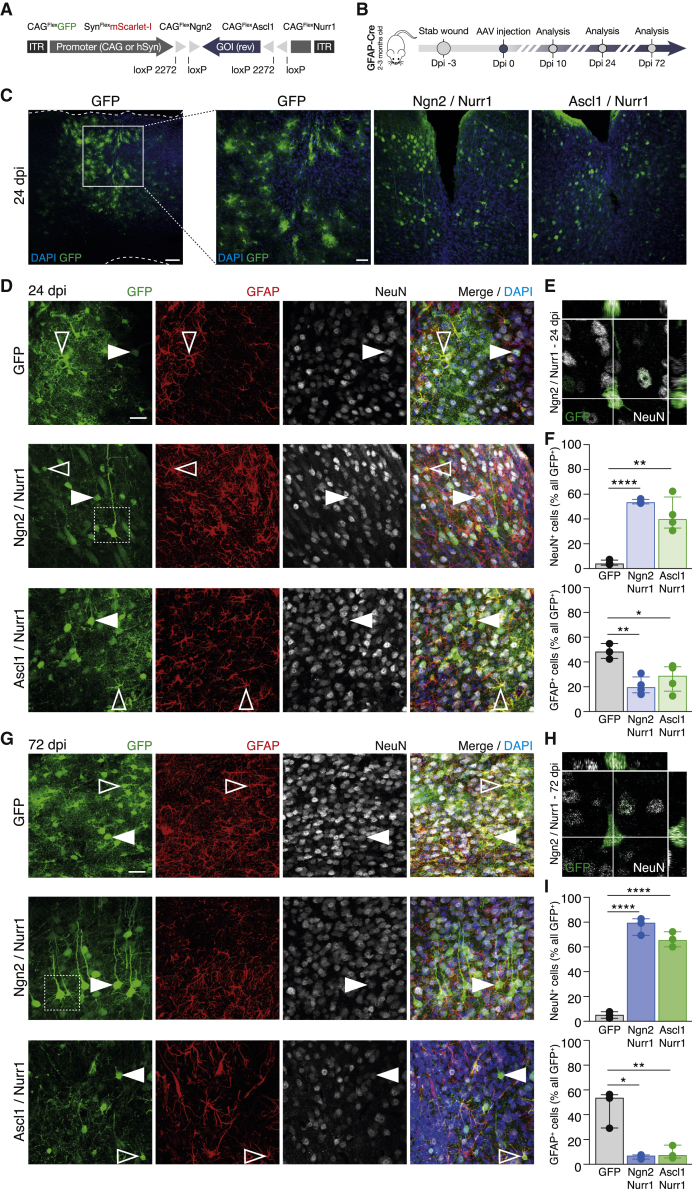
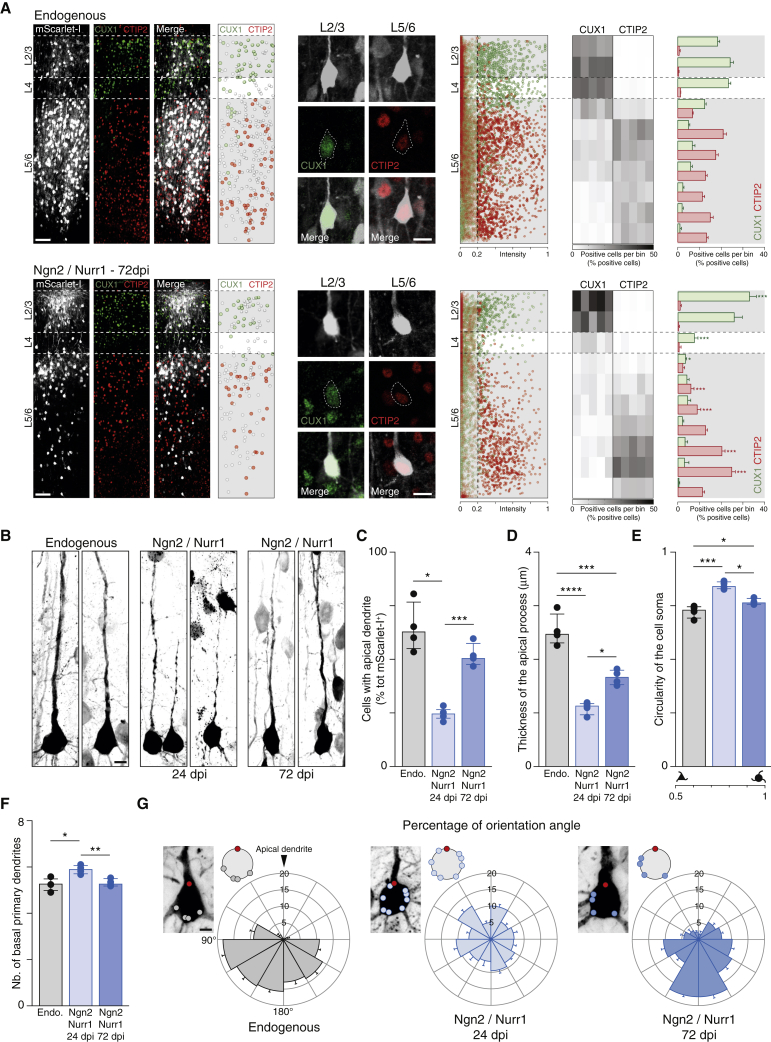
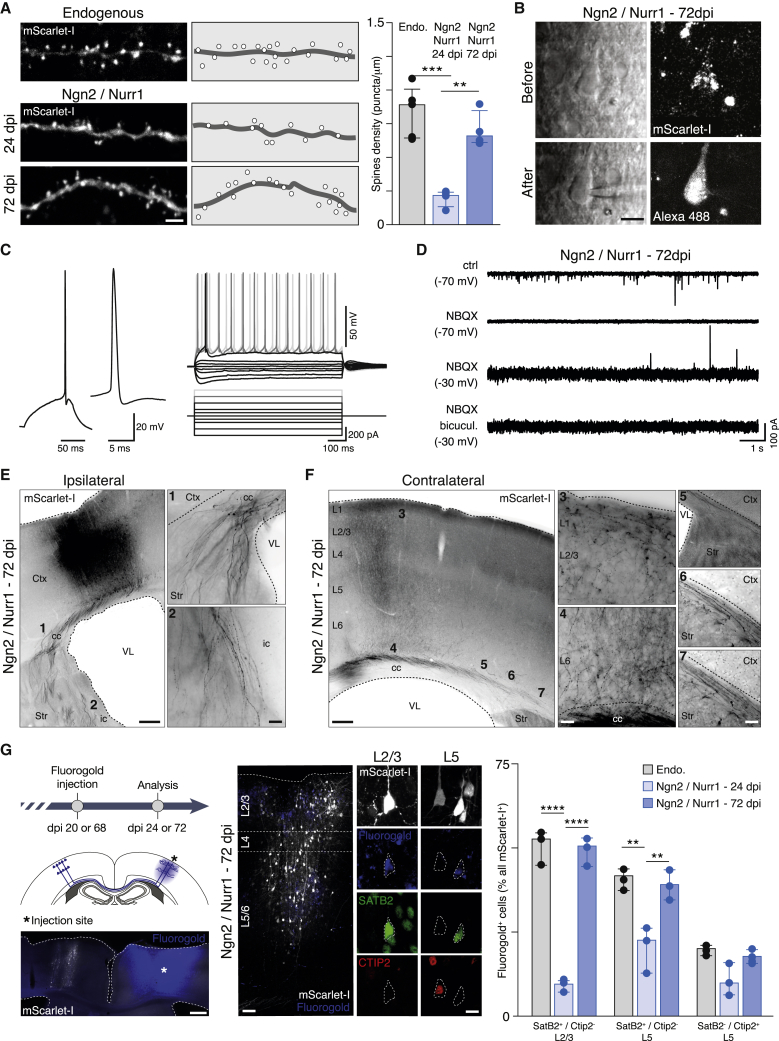
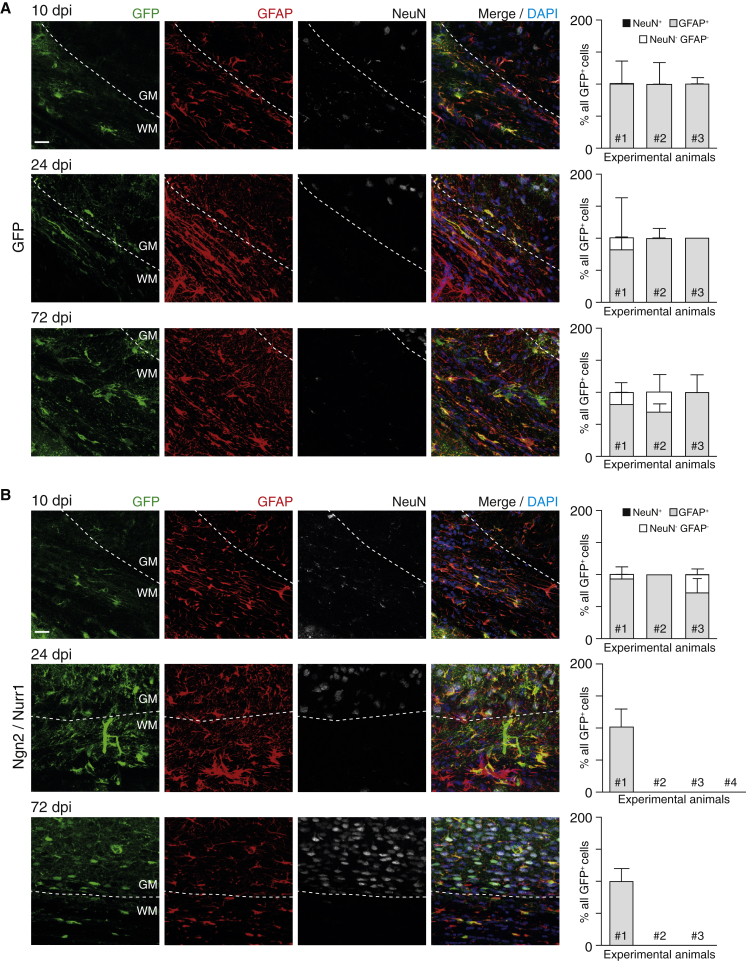
Astrocytes are particularly promising candidates for reprogramming into neurons, as they maintain some of the original patterning information from their radial glial ancestors. However, to which extent the position of astrocytes influences the fate of reprogrammed neurons remains unknown. To elucidate this, we performed stab wound injury covering an entire neocortical column, including the gray matter (GM) and white matter (WM), and targeted local reactive astrocytes via injecting FLEx switch (Cre-On) adeno-associated viral (AAV) vectors into mGFAP-Cre mice. Single proneural factors were not sufficient for adequate reprogramming, although their combination with the nuclear receptor-related 1 protein (Nurr1) improved reprogramming efficiency. Nurr1 and Neurogenin 2 (Ngn2) resulted in high-efficiency reprogramming of targeted astrocytes into neurons that develop lamina-specific hallmarks, including the appropriate long-distance axonal projections. Surprisingly, in the WM, we did not observe any reprogrammed neurons, thereby unveiling a crucial role of region- and layer-specific differences in astrocyte reprogramming.
Overview
The claims and statistics of this paper haven’t been checked yet.
Run the check — free, no account needed. It reads the open-access text and checks the sources it cites.
Integrity signals
Registry
Cites
Statistics
Figures
Verification
Claims the paper makes
The claims and statistics of this paper haven’t been checked yet.
Run the check — free, no account needed. It reads the open-access text and checks the sources it cites.
Claims other papers make about this one
Each is checked against this paper’s own text: does it say what the citing paper says it does?
The cited source says what the claim attributes to it.
In the citing paper
“Astrocyte-to-neuron reprogramming has recently emerged as an appealing regenerative strategy because astrocytes, which are abundant, regionally distributed, and proliferative, represent an endogenous cellular reservoir from which new neurons might be generated in situ.”
From Reverse the progression of Alzheimer’s disease through Nano-ERASER-based adult neuroregeneration (2026) · cites this paper as [10]
Self-check
Percentages, sums and reported differences re-computed from the paper’s own numbers.
The self-check needs the paper’s full text.
Citations
Cites
Molecular Architecture of the Mouse Nervous System
Zeisel, A., Hochgerner, H., Lönnerberg, P., Johnsson, A., Memic, F., van der Zwan, J., Häring, M., Braun, E., Borm, L. E., La Manno, G., et al. (2018) · Cell · doi:10.1016/j.cell.2018.06.021 · Cited by 2,552
Neuronal subtype specification in the cerebral cortex
Molyneaux, B. J., Arlotta, P., Menezes, J. R. L., & Macklis, J. D. (2007) · Nature reviews. Neuroscience · doi:10.1038/nrn2151 · Cited by 1,704
Zolotukhin, S., Byrne, B. J., Mason, E. G., Zolotukhin, I., Potter, M., Chesnut, K. A., Summerford, C., Samulski, R. J., & Muzyczka, N. (1999) · Gene Therapy · doi:10.1038/sj.gt.3300938 · Cited by 1,321
The neocortical circuit: themes and variations
Harris, K. D., & Shepherd, G. M. G. (2015) · Nature Neuroscience · doi:10.1038/nn.3917 · Cited by 1,215
Long-term, high-resolution imaging in the mouse neocortex through a chronic cranial window
Holtmaat, A. J. D. G., Bonhoeffer, T., Chow, D. K., Chuckowree, J. A., Paola, V. D., Hofer, S. B., Hübener, M., Keck, T., Knott, G. W., Lee, W.-C. A., et al. (2009) · Nature Protocols · doi:10.1038/nprot.2009.89 · Cited by 1,023
Saijo, K., Winner, B., Carson, C. T., Collier, J. G., Boyer, L., Rosenfeld, M. G., Gage, F. H., & Glass, C. K. (2009) · Cell · doi:10.1016/j.cell.2009.01.038 · Cited by 957
Molecular logic of neocortical projection neuron specification, development and diversity
Greig, L. C., Woodworth, M. B., Galazo, M. J., Padmanabhan, H., & Macklis, J. D. (2013) · Nature Reviews Neuroscience · doi:10.1038/nrn3586 · Cited by 863
Origin and progeny of reactive gliosis: A source of multipotent cells in the injured brain
Buffo, A., Rite, I., Tripathi, P., Lepier, A., Colak, D., Horn, A.-P., Mori, T., & Götz, M. (2008) · Proceedings of the National Academy of Sciences · doi:10.1073/pnas.0709002105 · Cited by 789
Self-citationNeuronal fate determinants of adult olfactory bulb neurogenesis
Hack, M., Saghatelyan, A., de Chevigny, A., Pfeifer, A., Ashery-Padan, R., Lledo, P., & Götz, M. (2005) · Nature Neuroscience · doi:10.1038/nn1479 · Cited by 648
Self-citationAtasoy, D., Aponte, Y., Su, H. H., & Sternson, S. M. (2008) · Journal of Neuroscience · doi:10.1523/jneurosci.1954-08.2008 · Cited by 635
Identification of diverse astrocyte populations and their malignant analogs
John Lin, C.-C., Yu, K., Hatcher, A., Huang, T.-W., Lee, H. K., Carlson, J., Weston, M. C., Chen, F., Zhang, Y., Zhu, W., et al. (2017) · Nature Neuroscience · doi:10.1038/nn.4493 · Cited by 525
Directing Astroglia from the Cerebral Cortex into Subtype Specific Functional Neurons
Heinrich, C., Blum, R., Gascón, S., Masserdotti, G., Tripathi, P., Sánchez, R., Tiedt, S., Schroeder, T., Götz, M., & Berninger, B. (2010) · PLoS Biology · doi:10.1371/journal.pbio.1000373 · Cited by 465
Self-citationRidder, K., Keller, S., Dams, M., Rupp, A.-K., Schlaudraff, J., Del Turco, D., Starmann, J., Macas, J., Karpova, D., Devraj, K., et al. (2014) · PLoS Biology · doi:10.1371/journal.pbio.1001874 · Cited by 412
Buffo, A., Vosko, M., Ertürk, D., Hamann, G., Jucker, M., Rowitch, D., & Götz, M. (2005) · Proceedings of the National Academy of Sciences of the United States of America · doi:10.1073/pnas.0506535102 · Cited by 402
Self-citationGenerating Neuronal Diversity in the Mammalian Cerebral Cortex
Lodato, S., & Arlotta, P. (2015) · Annual Review of Cell and Developmental Biology · doi:10.1146/annurev-cellbio-100814-125353 · Cited by 389
Astrocyte Development and HeterogeneityPreprint
Bayraktar, O. A., Fuentealba, L. C., Álvarez-Buylla, A., & Rowitch, D. H. (2014) · Cold Spring Harbor Perspectives in Biology · doi:10.1101/cshperspect.a020362 · Cited by 365
Identification and Successful Negotiation of a Metabolic Checkpoint in Direct Neuronal Reprogramming
Gascón, S., Murenu, E., Masserdotti, G., Ortega, F., Russo, G. L., Petřík, D., Deshpande, A., Heinrich, C., Karow, M., Robertson, S. P., et al. (2015) · Cell stem cell · doi:10.1016/j.stem.2015.12.003 · Cited by 362
Self-citationCervo, P. R. D. V., Romanov, R. A., Spigolon, G., Masini, D., Martín‐Montañez, E., Toledo, E. M., Manno, G. L., Feyder, M. T., Pifl, C., Ng, Y. H., et al. (2017) · Nature Biotechnology · doi:10.1038/nbt.3835 · Cited by 357
Lanjakornsiripan, D., Pior, B., Kawaguchi, D., Furutachi, S., Tahara, T., Katsuyama, Y., Suzuki, Y., Fukazawa, Y., & Gotoh, Y. (2018) · Nature Communications · doi:10.1038/s41467-018-03940-3 · Cited by 324
Neurons diversify astrocytes in the adult brain through sonic hedgehog signaling
Farmer, W. T., Abrahamsson, T., Chierzi, S., Lui, C. G., Zaelzer, C. A., Jones, E. V., Bally, B. P., Chen, G. G., Théroux, J., Peng, J., et al. (2016) · Science · doi:10.1126/science.aab3103 · Cited by 270
Pten Deletion in Adult Neural Stem/Progenitor Cells Enhances Constitutive Neurogenesis
Gregorian, C., Nakashima, J. K., Belle, J. E. L., Ohab, J. J., Kim, R., Liu, A., Smith, K. B., Groszer, M., Garcia, A. D. R., Sofroniew, M. V., et al. (2009) · Journal of Neuroscience · doi:10.1523/jneurosci.3095-08.2009 · Cited by 265
New approaches for brain repair-from rescue to reprogramming
Barker, R. A., Götz, M., & Parmar, M. (2018) · Nature · doi:10.1038/s41586-018-0087-1 · Cited by 214
Self-citationTorper, O., Ottosson, D. R., Pereira, M., Lau, S., Cardoso, T., Grealish, S., & Parmar, M. (2015) · Cell Reports · doi:10.1016/j.celrep.2015.06.040 · Cited by 198
Self-citationDirect Neuronal Reprogramming: Achievements, Hurdles, and New Roads to Success
Gascón, S., Masserdotti, G., Russo, G. L., & Götz, M. (2017) · Cell stem cell · doi:10.1016/j.stem.2017.06.011 · Cited by 183
Self-citationGeneration of subtype-specific neurons from postnatal astroglia of the mouse cerebral cortex
Heinrich, C., Gascón, S., Masserdotti, G., Lepier, A., Sánchez, R., Simon‐Ebert, T., Schroeder, T., Götz, M., & Berninger, B. (2011) · Nature Protocols · doi:10.1038/nprot.2010.188 · Cited by 151
Self-citationNurr1, an orphan nuclear receptor with essential functions in developing dopamine cells
Perlmann, T., & Wallén‐Mackenzie, Å. (2004) · Cell and Tissue Research · doi:10.1007/s00441-004-0974-7 · Cited by 149
Comparative Analysis of Layer-Specific Genes in Mammalian Neocortex
Watakabe, A., Ichinohe, N., Ohsawa, S., Hashikawa, T., Komatsu, Y., Rockland, K. S., & Yamamori, T. (2006) · Cerebral Cortex · doi:10.1093/cercor/bhl102 · Cited by 134
Fate and freedom in developing neocortical circuits
Jabaudon, D. (2017) · Nature Communications · doi:10.1038/ncomms16042 · Cited by 134
Direct neuronal reprogramming: learning from and for development
Masserdotti, G., Gascón, S., & Götz, M. (2016) · Development · doi:10.1242/dev.092163 · Cited by 130
Self-citationCross‐talk between monocyte invasion and astrocyte proliferation regulates scarring in brain injury
Frik, J., Merl‐Pham, J., Plesnila, N., Mattugini, N., Kjell, J., Kraska, J., Gomez, R. M., Hauck, S. M., Sirko, S., & Götz, M. (2018) · EMBO Reports · doi:10.15252/embr.201745294 · Cited by 126
Self-citationNeuronal replacement therapy: previous achievements and challenges ahead
Grade, S., & Götz, M. (2017) · npj Regenerative Medicine · doi:10.1038/s41536-017-0033-0 · Cited by 119
Self-citationRodríguez-Calvo, R., Tajes, M., & Vázquez-Carrera, M. (2017) · Expert Opinion on Therapeutic Targets · doi:10.1080/14728222.2017.1279146 · Cited by 117
Scheuß, V., Yasuda, R., Sobczyk, A., & Svoboda, K. (2006) · Journal of Neuroscience · doi:10.1523/jneurosci.1962-06.2006 · Cited by 111
Self-citationRobel, S., Bardehle, S., Lepier, A., Brakebusch, C., & Götz, M. (2011) · Journal of Neuroscience · doi:10.1523/jneurosci.2696-11.2011 · Cited by 95
Self-citationD'Costa, S., Blouin, V., Broucque, F., Penaud-Budloo, M., Fçranois, A., Perez, I. C., Le Bec, C., Moullier, P., Snyder, R. O., & Ayuso, E. (2016) · Molecular Therapy - Methods & Clinical Development · doi:10.1038/mtm.2016.19 · Cited by 89
Differentiation of the dopaminergic phenotype in the olfactory system of neonatal and adult mice
Saino‐Saito, S., Sasaki, H., Volpe, B. T., Kobayashi, K., Berlin, R., & Baker, H. A. (2004) · The Journal of Comparative Neurology · doi:10.1002/cne.20320 · Cited by 72
Pesaresi, M., Sebastián-Pérez, R., & Cosma, M. P. (2018) · FEBS Journal · doi:10.1111/febs.14633 · Cited by 63
Engineering new neurons: in vivo reprogramming in mammalian brain and spinal cord
Wang, L.-L., & Zhang, C. (2017) · Cell and Tissue Research · doi:10.1007/s00441-017-2729-2 · Cited by 50
Sousa, K. M., Mira, H., Hall, A. C., Jansson-Sjöstrand, L., Kusakabe, M., & Arenas, E. (2006) · Stem Cells · doi:10.1634/stemcells.2006-0238 · Cited by 43
Coupling progenitor and neuronal diversity in the developing neocortex
Govindan, S., & Jabaudon, D. (2017) · FEBS Letters · doi:10.1002/1873-3468.12846 · Cited by 40
Mattugini, N., Merl‐Pham, J., Petrozziello, E., Schindler, L., Bernhagen, J., Hauck, S. M., & Götz, M. (2018) · Glia · doi:10.1002/glia.23329 · Cited by 32
Self-citationHigh-yield in vitro recordings from neurons functionally characterized in vivo
Weiler, S., Bauer, J., Hübener, M., Bonhoeffer, T., Rose, T., & Scheuß, V. (2018) · Nature Protocols · doi:10.1038/nprot.2018.026 · Cited by 21
Cited by
Sorted by citations
Revisiting astrocyte to neuron conversion with lineage tracing in vivo
Wang, L.-L., Serrano, C., Zhong, X., Ma, S., Zou, Y., & Zhang, C.-L. (2021) · Cell · doi:10.1016/j.cell.2021.09.005 · Cited by 329
Making neurons, made easy: The use of Neurogenin-2 in neuronal differentiation
Hulme, A. E., Maksour, S., Clair‐Glover, M. S., Miellet, S., & Dottori, M. (2021) · Stem Cell Reports · doi:10.1016/j.stemcr.2021.11.015 · Cited by 153
Todd, L. J., Hooper, M. J., Haugan, A. K., Finkbeiner, C., Jorstad, N. L., Radulovich, N. P., Wong, C. K., Donaldson, P. C., Jenkins, W., Chen, Q., et al. (2021) · Cell Reports · doi:10.1016/j.celrep.2021.109857 · Cited by 147
Direct neuronal reprogramming: Fast forward from new concepts toward therapeutic approaches
Bocchi, R., Masserdotti, G., & Götz, M. (2021) · Neuron · doi:10.1016/j.neuron.2021.11.023 · Cited by 135
Self-citationHerrero-Navarro, Á., Puche-Aroca, L., Moreno-Juan, V., Sempere-Ferràndez, A., Espinosa, A., Susín, R., Torres-Masjoan, L., Leyva-Díaz, E., Karow, M., Figueres-Oñate, M., et al. (2021) · Science Advances · doi:10.1126/sciadv.abe8978 · Cited by 117
Metadata
- Authors
- Mattugini, N., Bocchi, R., Scheuss, V., Russo, G. L., Torper, O., Lao, C. L., & Götz, M.
- Affiliations
- Helmholtz Munich (DE)
- Corresponding author
- Götz, Magdalena
- ORCID
- Venue
- Neuron
- Publisher
- Elsevier BV
- Published
- 2019-09
- Volume
- 103
- Issue
- 6
- Pages
- 1086-1095.e5
- ISSN
- 0896-6273 (ISSN-L)
- PMC
- PMC6859713
- OpenAlex
- W2971841027
- Cited by
- 159
- References
- 42
- Citations by year
- 2026: 12 · 2025: 26 · 2024: 28 · 2023: 19 · 2022: 26 · 2021: 35 · 2020: 11 · 2019: 2
- FWCI
- 6.97
- Type
- journal article
- Language
- en
- Open access
- hybrid
- doi.org
- Licence
- Locations
- Neuron (publishedVersion, cc-by-nc-nd)
- PubMed Central (publishedVersion, cc-by-nc-nd)
- PubMed (publishedVersion)
- Open access LMU (Ludwid Maxmilian's Universitat Munchen) (submittedVersion, cc-by-nc-nd)
- Site cant be reached (submittedVersion, cc-by-nc-nd)
- PuSH - Publication Server of Helmholtz Zentrum München (submittedVersion, cc-by-nc-nd)
- Funders
- Schweizerischer Nationalfonds zur Förderung der Wissenschaftlichen Forschung (P400PB_183826, P2GEP3_174900)
- European Research Council (340793)
- Fondation Roger de Spoelberch
- ERA-LEARN 2020
- Deutsche Forschungsgemeinschaft (01EW1705B, SFB 870, A06)
- Topics
- Life Sciences › Neuroscience › Developmental Neuroscience › Neurogenesis and neuroplasticity mechanisms
- Life Sciences › Biochemistry, Genetics and Molecular Biology › Molecular Biology › Pluripotent Stem Cells Research
- Life Sciences › Biochemistry, Genetics and Molecular Biology › Molecular Biology › Nuclear Receptors and Signaling
- Keywords
- neuronal subtype specification, stab wounds, cerebral cortex, Nurr1, Neurogenin2, white matter, gray matter, adeno-associated virus vectors
- MeSH terms
- Cellular Reprogramming Techniques, Brain Injuries, Traumatic, Dependovirus, Animals, Astrocytes, Cerebral Cortex, Genetic Vectors, Gliosis, Nerve Tissue Proteins, Neurons, Wounds, Stab, Pyramidal Cells, Mice, Basic Helix-Loop-Helix Transcription Factors, Basic Helix-Loop-Helix Proteins, Nuclear Receptor Subfamily 4, Group A, Member 2, White Matter, Gray Matter
About these checks
Registry, retraction, Cites and statistics results are computed, not judged, with one exception: a printed reference that no index lists is read once by a model before it counts as a citation error. Claims are extracted by a model and kept only when their quote appears verbatim in the text; each cited source is then checked, with a model’s help, for whether it says what the claim relies on. Those verdicts can be wrong — read the claim’s quote and the cited source before relying on one.
Statistics and arithmetic are recomputed, not judged.
Confidence bands are shown only for fields calibrated on our annotated test set. None is calibrated yet, so no band is shown.
What counts as a claim ›How we measure confidence ›How we check this ›
Are you an author, or do you see a problem with this page? Request a review
