

The DOI matches its Crossref record; 61 of the 61 references it cites were found in a registry or an index.
Altered network hub connectivity after acute LSD administration
Open accessAbstract
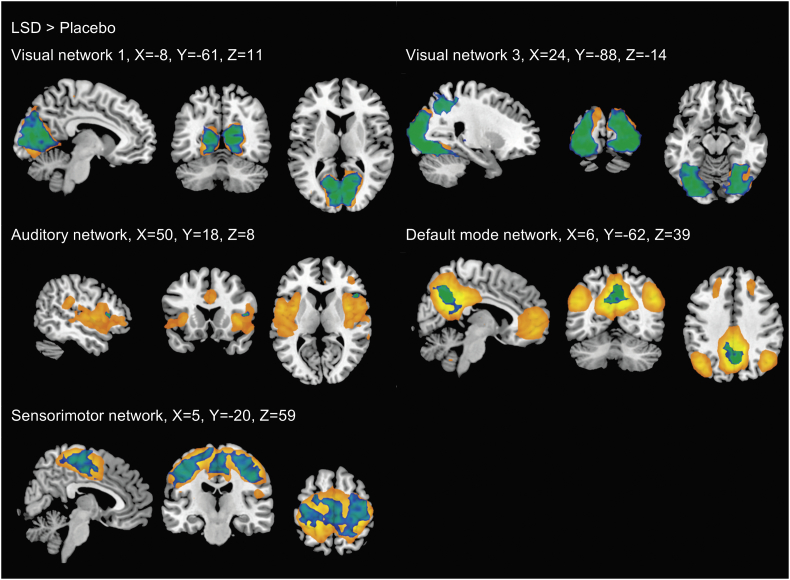
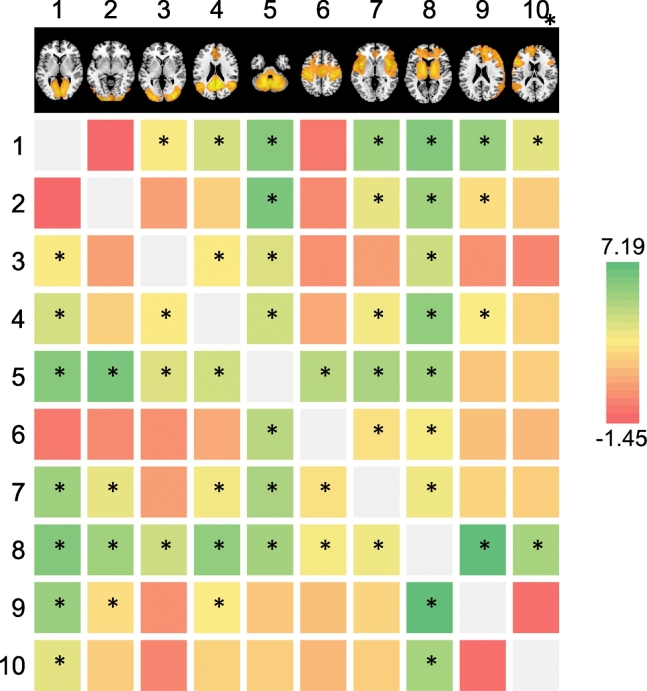
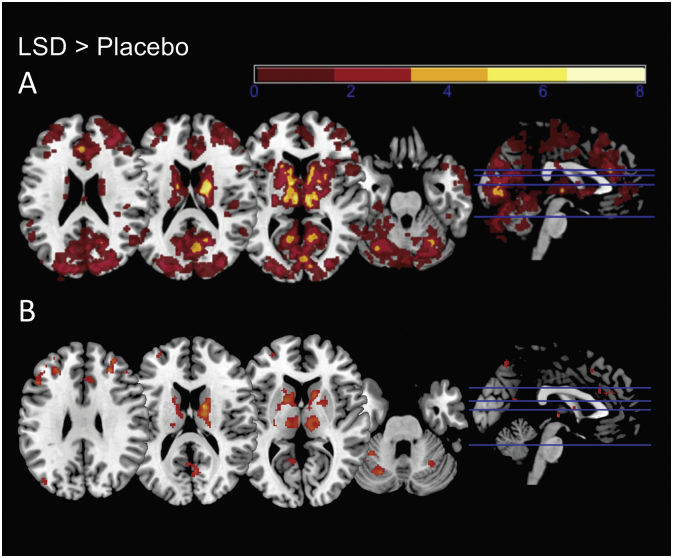
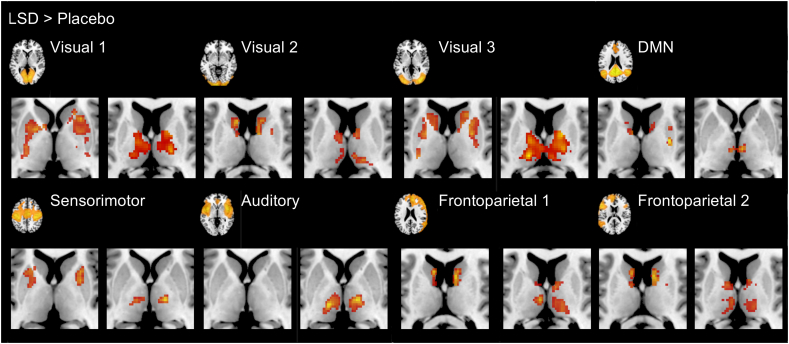
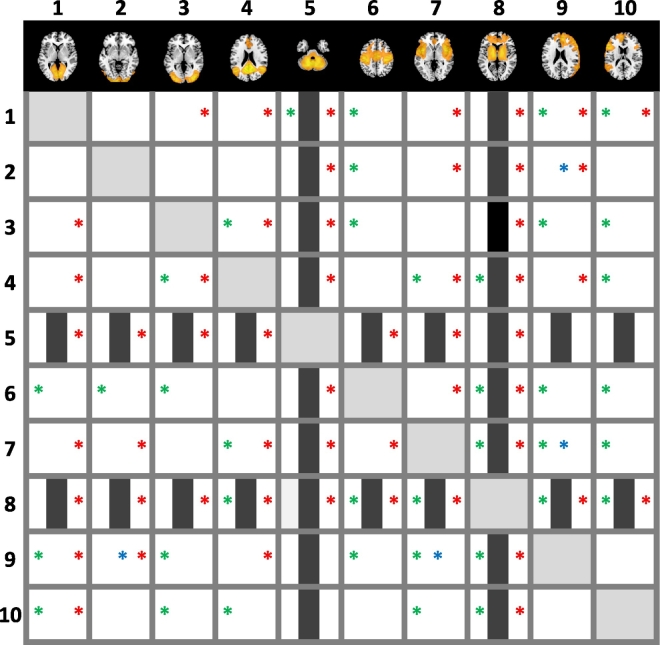
LSD is an ambiguous substance, said to mimic psychosis and to improve mental health in people suffering from anxiety and depression. Little is known about the neuronal correlates of altered states of consciousness induced by this substance. Limited previous studies indicated profound changes in functional connectivity of resting state networks after the administration of LSD. The current investigation attempts to replicate and extend those findings in an independent sample. In a double-blind, randomized, cross-over study, 100 μg LSD and placebo were orally administered to 20 healthy participants. Resting state brain activity was assessed by functional magnetic resonance imaging. Within -network and between -network connectivity measures of ten established resting state networks were compared between drug conditions. Complementary analysis were conducted using resting state networks as sources in seed-to-voxel analyses. Acute LSD administration significantly decreased functional connectivity within visual, sensorimotor and auditory networks and the default mode network. While between -network connectivity was widely increased and all investigated networks were affected to some extent, seed-to-voxel analyses consistently indicated increased connectivity between networks and subcortical (thalamus, striatum) and cortical (precuneus, anterior cingulate cortex) hub structures. These latter observations are consistent with findings on the importance of hubs in psychopathological states, especially in psychosis, and could underlay therapeutic effects of hallucinogens as proposed by a recent model.
Overview
The claims and statistics of this paper haven’t been checked yet.
Run the check — free, no account needed. It reads the open-access text and checks the sources it cites.
Integrity signals
Registry
Cites
Statistics
Figures
Verification
Claims the paper makes
The claims and statistics of this paper haven’t been checked yet.
Run the check — free, no account needed. It reads the open-access text and checks the sources it cites.
Claims other papers make about this one
Each is checked against this paper’s own text: does it say what the citing paper says it does?
The source backs part of the claim, not all of it — or backs it for a different population, condition or comparison.
In the citing paper
“It has been demonstrated with functional magnetic resonance imaging (fMRI) that during psychedelic experience, the DMN is modulated, which sharply reduces blood flow and connection within its nodes [46], leading to decreased functional connectivity within the DMN and increased between-network connectivity [47, 48].”
From Mindfulness meditation and psychedelics: potential synergies and commonalities (2023) · cites this paper as [48]
Experimental — accuracy not yet measured
Self-check
Percentages, sums and reported differences re-computed from the paper’s own numbers.
The self-check needs the paper’s full text.
Citations
Cites
A default mode of brain function
Raichle, M. E., MacLeod, A. M., Snyder, A. Z., Powers, W. J., Gusnard, D. A., & Shulman, G. L. (2001) · Proceedings of the National Academy of Sciences · doi:10.1073/pnas.98.2.676 · Cited by 12,190
The Brain's Default Network: Anatomy, Function, and Relevance to Disease
Buckner, R. L., Andrews‐Hanna, J. R., & Schacter, D. L. (2008) · Annals of the New York Academy of Sciences · doi:10.1196/annals.1440.011 · Cited by 9,761 · cited 1×
“The DMN is particularly activated during rest and is thought to be involved in functions such as self-referential thinking (Buckner et al., 2008; Raichle et al., 2001).”
BackgroundParallel organization of functionally segregated circuits linking basal ganglia and cortex
Alexander, G. E., DeLong, M. R., & Strick, P. L. (1986) · Annual Review of Neuroscience · doi:10.1146/annurev.ne.09.030186.002041 · Cited by 8,527
The organization of the human cerebellum estimated by intrinsic functional connectivity
Buckner, R. L., Krienen, F. M., Castellanos, A., Diaz, J. C., & Yeo, B. T. T. (2011) · Journal of Neurophysiology · doi:10.1152/jn.00339.2011 · Cited by 7,304
Correspondence of the brain's functional architecture during activation and rest
Smith, S. M., Fox, P. T., Miller, K. L., Glahn, D. C., Fox, P. M., Mackay, C. E., Filippini, N., Watkins, K. E., Toro, R., Laird, A. R., et al. (2009) · Proceedings of the National Academy of Sciences · doi:10.1073/pnas.0905267106 · Cited by 5,150
Conn : A Functional Connectivity Toolbox for Correlated and Anticorrelated Brain Networks
Whitfield-Gabrieli, S., & Nieto-Castanon, A. (2012) · Brain Connectivity · doi:10.1089/brain.2012.0073 · Cited by 4,885
A component based noise correction method (CompCor) for BOLD and perfusion based fMRI
Behzadi, Y., Restom, K., Liau, J., & Liu, T. T. (2007) · NeuroImage · doi:10.1016/j.neuroimage.2007.04.042 · Cited by 4,502
Methods to detect, characterize, and remove motion artifact in resting state fMRI
Power, J. D., Mitra, A., Laumann, T. O., Snyder, A. Z., Schlaggar, B. L., & Petersen, S. E. (2014) · NeuroImage · doi:10.1016/j.neuroimage.2013.08.048 · Cited by 3,748
Functional and Effective Connectivity: A Review
Friston, K. J. (2011) · Brain Connectivity · doi:10.1089/brain.2011.0008 · Cited by 3,415
Rich-club organization of the human connectome
van den Heuvel, M. P., & Sporns, O. (2011) · The Journal of Neuroscience · doi:10.1523/jneurosci.3539-11.2011 · Cited by 2,354
Functional anatomy of the basal ganglia. I. The cortico-basal ganglia-thalamo-cortical loop
Parent, A., & Hazrati, L.-N. (1995) · Brain Research Reviews · doi:10.1016/0165-0173(94)00007-c · Cited by 2,161
Network hubs in the human brain
van den Heuvel, M. P., & Sporns, O. (2013) · Trends in Cognitive Sciences · doi:10.1016/j.tics.2013.09.012 · Cited by 2,123 · cited 2×
“Hubs are thought to be of importance for overall brain functioning by serving integration and large-scale interaction (van den Heuvel and Sporns, 2013; Bell and Shine, 2016).”
BackgroundNichols, D. E. (2016) · Pharmacological Reviews · doi:10.1124/pr.115.011478 · Cited by 1,762
The hubs of the human connectome are generally implicated in the anatomy of brain disorders
Crossley, N. A., Mechelli, A., Scott, J., Carletti, F., Fox, P. T., McGuire, P., & Bullmore, E. T. (2014) · Brain · doi:10.1093/brain/awu132 · Cited by 1,166
Psilocybin induces schizophrenia-like psychosis in humans via a serotonin-2 agonist action
Vollenweider, F. X., Vollenweider-Scherpenhuyzen, M. F. I., Bäbler, A., Vogel, H., & Hell, D. (1998) · NeuroReport · doi:10.1097/00001756-199812010-00024 · Cited by 1,018
Neural correlates of the LSD experience revealed by multimodal neuroimaging
Carhart-Harris, R. L., Muthukumaraswamy, S., Roseman, L., Kaelen, M., Droog, W., Murphy, K., Tagliazucchi, E., Schenberg, E. E., Nest, T., Orban, C., et al. (2016) · Proceedings of the National Academy of Sciences · doi:10.1073/pnas.1518377113 · Cited by 859
The organization of the human striatum estimated by intrinsic functional connectivity
Choi, E. Y., Yeo, B. T. T., & Buckner, R. L. (2012) · Journal of Neurophysiology · doi:10.1152/jn.00270.2012 · Cited by 746
Group comparison of resting-state FMRI data using multi-subject ICA and dual regression
Beckmann, C. F., Mackay, C., Filippini, N., & Smith, S. R. (2009) · NeuroImage · doi:10.1016/s1053-8119(09)71511-3 · Cited by 744
Psychometric evaluation of the altered states of consciousness rating scale (OAV)
Studerus, E., Gamma, A., & Vollenweider, F. X. (2010) · PLoS ONE · doi:10.1371/journal.pone.0012412 · Cited by 683
A Unitary Model of Schizophrenia
Andreasen, N. C. (1999) · Archives of General Psychiatry · doi:10.1001/archpsyc.56.9.781 · Cited by 609
The Standardized Psychometric Assessment of Altered States of Consciousness (ASCs) in Humans
Dittrich, A. (1998) · Pharmacopsychiatry · doi:10.1055/s-2007-979351 · Cited by 577
Increased global functional connectivity correlates with LSD-induced ego dissolution
Tagliazucchi, E., Roseman, L., Kaelen, M., Orban, C., Muthukumaraswamy, S. D., Murphy, K., Laufs, H., Leech, R., McGonigle, J., Crossley, N., et al. (2016) · Current Biology · doi:10.1016/j.cub.2016.02.010 · Cited by 503
Palhano-Fontes, F., Andrade, K. C., Tofoli, L. F., Santos, A. C., Crippa, J. A. S., Hallak, J. E. C., Ribeiro, S., & de Araujo, D. B. (2015) · PLOS ONE · doi:10.1371/journal.pone.0118143 · Cited by 454
Intrinsic functional relations between human cerebral cortex and thalamus
Zhang, D., Snyder, A. Z., Fox, M. D., Sansbury, M. W., Shimony, J. S., & Raichle, M. E. (2008) · Journal of Neurophysiology · doi:10.1152/jn.90463.2008 · Cited by 437
Acute Effects of Lysergic Acid Diethylamide in Healthy Subjects
Schmid, Y., Enzler, F., Gasser, P., Grouzmann, E., Preller, K. H., Vollenweider, F. X., Brenneisen, R., Müller, F., Borgwardt, S., & Liechti, M. E. (2014) · Biological Psychiatry · doi:10.1016/j.biopsych.2014.11.015 · Cited by 427
Self-citationSerotonin research: contributions to understanding psychoses
GEYER, M., & VOLLENWEIDER, F. (2008) · Trends in Pharmacological Sciences · doi:10.1016/j.tips.2008.06.006 · Cited by 427
Preller, K. H., Herdener, M., Pokorny, T., Planzer, A., Kraehenmann, R., Stämpfli, P., Liechti, M. E., Seifritz, E., & Vollenweider, F. X. (2017) · Current Biology · doi:10.1016/j.cub.2016.12.030 · Cited by 402
Self-citationPsychedelics as Medicines: An Emerging New Paradigm
Nichols, D. E., Johnson, M., & Nichols, C. (2016) · Clinical Pharmacology & Therapeutics · doi:10.1002/cpt.557 · Cited by 397
Anticevic, A., Haut, K. M., Murray, J. D., Repovš, G., Yang, G., Diehl, C., McEwen, S. C., Bearden, C. E., Addington, J., Goodyear, B. G., et al. (2015) · JAMA Psychiatry · doi:10.1001/jamapsychiatry.2015.0566 · Cited by 387
Receptor interaction profiles of novel psychoactive tryptamines compared with classic hallucinogens
Rickli, A., Moning, O. D., Hoener, M. C., & Liechti, M. E. (2016) · European Neuropsychopharmacology · doi:10.1016/j.euroneuro.2016.05.001 · Cited by 379
Self-citationPrediction of Psilocybin Response in Healthy Volunteers
Studerus, E., Gamma, A., Kometer, M., & Vollenweider, F. X. (2012) · PLoS ONE · doi:10.1371/journal.pone.0030800 · Cited by 369
Noninvasive Functional and Structural Connectivity Mapping of the Human Thalamocortical System
Zhang, D., Snyder, A. Z., Shimony, J. S., Fox, M., & Raichle, M. E. (2009) · Cerebral Cortex · doi:10.1093/cercor/bhp182 · Cited by 351
Kelly, R. E., Alexopoulos, G. S., Wang, Z., Gunning, F. M., Murphy, C. F., Morimoto, S. S., Kanellopoulos, D., Jia, Z., Lim, K. O., & Hoptman, M. J. (2010) · Journal of Neuroscience Methods · doi:10.1016/j.jneumeth.2010.03.028 · Cited by 345
Psychedelics not linked to mental health problems or suicidal behavior: A population study
Johansen, P.-Ø., & Krebs, T. S. (2015) · Journal of Psychopharmacology · doi:10.1177/0269881114568039 · Cited by 330
The paradoxical psychological effects of lysergic acid diethylamide LSD
Carhart-Harris, R. L., Kaelen, M., Bolstridge, M., Williams, T. M., Williams, L. T., Underwood, R., Feilding, A., & Nutt, D. J. (2016) · Psychological Medicine · doi:10.1017/s0033291715002901 · Cited by 293
Roseman, L., Leech, R., Feilding, A., Nutt, D., & Carhart-Harris, R. L. (2014) · Frontiers in Human Neuroscience · doi:10.3389/fnhum.2014.00204 · Cited by 285
Functional Connectivity Measures After Psilocybin Inform a Novel Hypothesis of Early Psychosis
Carhart-Harris, R. L., Leech, R., Erritzoe, D., Williams, T. M., Stone, J. M., Evans, J., Sharp, D. J., Feilding, A., Wise, R. G., & Nutt, D. J. (2013) · Schizophrenia Bulletin · doi:10.1093/schbul/sbs117 · Cited by 256
The Thalamic Reticular Nucleus and Schizophrenia
Ferrarelli, F., & Tononi, G. (2010) · Schizophrenia Bulletin · doi:10.1093/schbul/sbq142 · Cited by 244
Modern clinical research on LSD
Liechti, M. E. (2017) · Neuropsychopharmacology · doi:10.1038/npp.2017.86 · Cited by 236
Review of thalamocortical resting-state fMRI studies in schizophrenia
Giraldo‐Chica, M., & Woodward, N. D. (2016) · Schizophrenia Research · doi:10.1016/j.schres.2016.08.005 · Cited by 229
ICA model order selection of task co-activation networks
Ray, K. L., McKay, D., Fox, P. M., Riedel, M. C., Uecker, A. M., Beckmann, C. F., Smith, S. M., Fox, P. T., & Laird, A. R. (2013) · Frontiers in Neuroscience · doi:10.3389/fnins.2013.00237 · Cited by 211
Alterations of consciousness and mystical-type experiences after acute LSD in humans
Liechti, M. E., Dolder, P. C., & Schmid, Y. (2017) · Psychopharmacology · doi:10.1007/s00213-016-4453-0 · Cited by 198
Self-citationSubcortical contributions to large-scale network communication
Bell, P. T., & Shine, J. M. (2016) · Neuroscience & Biobehavioral Reviews · doi:10.1016/j.neubiorev.2016.08.036 · Cited by 168
Cheng, W., Palaniyappan, L. K., Li, M., Kendrick, K. M., Zhang, J., Luo, Q., Liu, Z., Yu, R., Deng, W., Wang, Q., et al. (2015) · Schizophrenia · doi:10.1038/npjschz.2015.16 · Cited by 156
LSD Psychosis or LSD-Induced Schizophrenia?
Vardy, M. M. (1983) · Archives of General Psychiatry · doi:10.1001/archpsyc.1983.01790070067008 · Cited by 144
Increased thalamic resting‐state connectivity as a core driver of LSD‐induced hallucinations
Müller, F., Lenz, C., Dolder, P. C., Lang, U. E., Schmidt, A., Liechti, M. E., & Borgwardt, S. (2017) · Acta Psychiatrica Scandinavica · doi:10.1111/acps.12818 · Cited by 144
Self-citationd-Lysergic Acid Diethylamide (LSD) as a Model of Psychosis: Mechanism of Action and Pharmacology
Gregorio, D. D., Comai, S., Posa, L., & Gobbi, G. (2016) · International Journal of Molecular Sciences · doi:10.3390/ijms17111953 · Cited by 138
Neurovascular factors in resting-state functional MRI
Liu, T. T. (2013) · NeuroImage · doi:10.1016/j.neuroimage.2013.04.071 · Cited by 136
Pharmacokinetics and Pharmacodynamics of Lysergic Acid Diethylamide in Healthy Subjects
Dolder, P. C., Schmid, Y., Steuer, A. E., Kraemer, T., Rentsch, K. M., Hammann, F., & Liechti, M. E. (2017) · Clinical Pharmacokinetics · doi:10.1007/s40262-017-0513-9 · Cited by 133
Self-citationFunctional topography of the thalamocortical system in human
Yuan, R., Di, X., Taylor, P. A., Gohel, S., Tsai, Y., & Biswal, B. B. (2015) · Brain Structure and Function · doi:10.1007/s00429-015-1018-7 · Cited by 128
Lisman, J. E., Pi, H. J., Zhang, Y., & Otmakhova, N. A. (2010) · Biological Psychiatry · doi:10.1016/j.biopsych.2010.04.007 · Cited by 123
Dysfunctional Thalamus-Related Networks in Schizophrenia
Pinault, D. (2011) · Schizophrenia Bulletin · doi:10.1093/schbul/sbq165 · Cited by 105
Single-dose serotonergic stimulation shows widespread effects on functional brain connectivity
Klaassens, B. L., van Gorsel, H. C., Khalili-Mahani, N., van der Grond, J., Wyman, B. T., Whitcher, B., Rombouts, S. A. R. B., & van Gerven, J. M. A. (2015) · NeuroImage · doi:10.1016/j.neuroimage.2015.08.012 · Cited by 76
Hollister, L. E., & Hartman, A. M. (1962) · Comprehensive Psychiatry · doi:10.1016/s0010-440x(62)80024-8 · Cited by 73
Khalili‐Mahani, N., Chang, C. E., van Osch, M. J. P., Veer, I. M., van Buchem, M. A., Dahan, A., Beckmann, C. F., van Gerven, J., & Rombouts, S. A. R. B. (2012) · NeuroImage · doi:10.1016/j.neuroimage.2012.09.044 · Cited by 65
Gouzoulis‐Mayfrank, E., Habermeyer, E., Hermle, L., Steinmeyer, A., Kunert, H. J., & Sass, H. (1998) · European Psychiatry · doi:10.1016/s0924-9338(99)80686-5 · Cited by 61
Structural Network Disorganization in Subjects at Clinical High Risk for Psychosis
Schmidt, A., Crossley, N. A., Harrisberger, F., Smieskova, R., Lenz, C., Riecher‐Rössler, A., Lang, U. E., McGuire, P. K., Fusar‐Poli, P., & Borgwardt, S. (2016) · Schizophrenia Bulletin · doi:10.1093/schbul/sbw110 · Cited by 55
Self-citationComparison of functional thalamic segmentation from seed-based analysis and ICA
Hale, J. R., Mayhew, S. D., Mullinger, K. J., Wilson, R. S., Arvanitis, T. N., Francis, S., & Bagshaw, A. P. (2015) · NeuroImage · doi:10.1016/j.neuroimage.2015.04.027 · Cited by 45
Spain, A., Howarth, C., Khrapitchev, A. A., Sharp, T., Sibson, N. R., & Martin, C. J. (2015) · Neuropharmacology · doi:10.1016/j.neuropharm.2015.07.018 · Cited by 37
Hollister, L. E., & Sjoberg, B. M. (1964) · Comprehensive Psychiatry · doi:10.1016/s0010-440x(64)80030-4 · Cited by 36
Dolder, P. C., Liechti, M. E., & Rentsch, K. (2017) · Journal of Clinical Laboratory Analysis · doi:10.1002/jcla.22265 · Cited by 31
Self-citation
Cited by
Sorted by citations
Psychedelic drugs: neurobiology and potential for treatment of psychiatric disorders
Vollenweider, F. X., & Preller, K. H. (2020) · Nature Reviews Neuroscience · doi:10.1038/s41583-020-0367-2 · Cited by 570
Doss, M. K., Považan, M., Rosenberg, M. D., Sepeda, N. D., Davis, A. K., Finan, P. H., Smith, G. S., Pekar, J. J., Barker, P. B., Griffiths, R. R., et al. (2021) · Translational Psychiatry · doi:10.1038/s41398-021-01706-y · Cited by 356
The neural basis of psychedelic action
Kwan, A. C., Olson, D. E., Preller, K. H., & Roth, B. L. (2022) · Nature Neuroscience · doi:10.1038/s41593-022-01177-4 · Cited by 330
Mason, N. L., Kuypers, K. P. C., Müller, F., Reckweg, J., Tse, D. H. Y., Toennes, S. W., Hutten, N. R. P. W., Jansen, J. F. A., Stiers, P., Feilding, A., et al. (2020) · Neuropsychopharmacology · doi:10.1038/s41386-020-0718-8 · Cited by 258
Self-citationGregorio, D. D., Aguilar‐Valles, A., Preller, K. H., Heifets, B. D., Hibicke, M., Mitchell, J., & Gobbi, G. (2020) · Journal of Neuroscience · doi:10.1523/jneurosci.1659-20.2020 · Cited by 279
Metadata
- Authors
- Müller, F., Dolder, P. C., Schmidt, A., Liechti, M. E., & Borgwardt, S.
- Affiliations
- University of Basel (CH)
- Corresponding author
- Borgwardt, Stefan
- Venue
- NeuroImage: Clinical
- Publisher
- Elsevier BV
- Published
- 2018
- Volume
- 18
- Pages
- 694-701
- ISSN
- 2213-1582 (ISSN-L)
- PMC
- PMC5857492
- OpenAlex
- W2792211781
- Cited by
- 174
- References
- 61
- Citations by year
- 2026: 15 · 2025: 21 · 2024: 23 · 2023: 45 · 2022: 22 · 2021: 19 · 2020: 19 · 2019: 6 · 2018: 4
- FWCI
- 14.10
- Type
- journal article
- Language
- en
- Open access
- gold
- doi.org
- Licence
- Locations
- NeuroImage Clinical (publishedVersion, cc-by-nc-nd)
- Europe PMC (PubMed Central) (publishedVersion, cc-by-nc-nd)
- PubMed Central (publishedVersion, cc-by-nc-nd)
- PubMed (publishedVersion)
- edoc (University of Basel) (acceptedVersion)
- DOAJ (DOAJ: Directory of Open Access Journals) (submittedVersion, cc-by-sa)
- edoc (University of Basel)
- Funders
- Schweizerischer Nationalfonds zur Förderung der Wissenschaftlichen Forschung (320030_170249)
- Topics
- Social Sciences › Psychology › Clinical Psychology › Psychedelics and Drug Studies
- Life Sciences › Neuroscience › Cognitive Neuroscience › Functional Brain Connectivity Studies
- Life Sciences › Neuroscience › Cognitive Neuroscience › Hallucinations in medical conditions
- Keywords
- LSD, hallucinogens, resting-state functional connectivity, network hubs, default mode network, seed-to-voxel analysis, altered states of consciousness, psychosis, thalamus, striatum, precuneus, anterior cingulate cortex, visual network, sensorimotor network, auditory network
- MeSH terms
- Adult, Brain, Brain Mapping, Double-Blind Method, Female, Hallucinogens, Humans, Image Processing, Computer-Assisted, Lysergic Acid Diethylamide, Magnetic Resonance Imaging, Male, Middle Aged, Nerve Net, Cross-Over Studies
About these checks
Registry, retraction, Cites and statistics results are computed, not judged, with one exception: a printed reference that no index lists is read once by a model before it counts as a citation error. Claims are extracted by a model and kept only when their quote appears verbatim in the text; each cited source is then checked, with a model’s help, for whether it says what the claim relies on. Those verdicts can be wrong — read the claim’s quote and the cited source before relying on one.
Statistics and arithmetic are recomputed, not judged.
Confidence bands are shown only for fields calibrated on our annotated test set. None is calibrated yet, so no band is shown.
What counts as a claim ›How we measure confidence ›How we check this ›
Are you an author, or do you see a problem with this page? Request a review
