Cited by 135Posttraumatic Stress Disorder ResearchNeural and Behavioral Psychology StudiesTranscranial Magnetic Stimulation Studies

The DOI matches its Crossref record; 66 of the 67 references it cites were found in a registry or an index.

Real-time fMRI neurofeedback training of the amygdala activity with simultaneous EEG in veterans with combat-related PTSD

Open access

Abstract

Posttraumatic stress disorder (PTSD) is a chronic and disabling neuropsychiatric disorder characterized by insufficient top-down modulation of the amygdala activity by the prefrontal cortex. Real-time fMRI neurofeedback (rtfMRI-nf) is an emerging method with potential for modifying the amygdala-prefrontal interactions. We report the first controlled emotion self-regulation study in veterans with combat-related PTSD utilizing rtfMRI-nf of the amygdala activity. PTSD patients in the experimental group (EG, n = 20) learned to upregulate blood‑oxygenation-level-dependent (BOLD) activity of the left amygdala (LA) using the rtfMRI-nf during a happy emotion induction task. PTSD patients in the control group (CG, n = 11) were provided with a sham rtfMRI-nf. The study included three rtfMRI-nf training sessions, and EEG recordings were performed simultaneously with fMRI. PTSD severity was assessed before and after the training using the Clinician-Administered PTSD Scale (CAPS). The EG participants who completed the study showed a significant reduction in total CAPS ratings, including significant reductions in avoidance and hyperarousal symptoms. They also exhibited a significant reduction in comorbid depression severity. Overall, 80% of the EG participants demonstrated clinically meaningful reductions in CAPS ratings, compared to 38% in the CG. No significant difference in the CAPS rating changes was observed between the groups. During the first rtfMRI-nf session, functional connectivity of the LA with the orbitofrontal cortex (OFC) and the dorsolateral prefrontal cortex (DLPFC) was progressively enhanced, and this enhancement significantly and positively correlated with the initial CAPS ratings. Left-lateralized enhancement in upper alpha EEG coherence also exhibited a significant positive correlation with the initial CAPS. Reduction in PTSD severity between the first and last rtfMRI-nf sessions significantly correlated with enhancement in functional connectivity between the LA and the left DLPFC. Our results demonstrate that the rtfMRI-nf of the amygdala activity has the potential to correct the amygdala-prefrontal functional connectivity deficiencies specific to PTSD.

Overview

The claims and statistics of this paper haven’t been checked yet.

Run the check — free, no account needed. It reads the open-access text and checks the sources it cites.

A few free checks a day · papers already verified open instantly · results are public

Integrity signals

Registry

Crossref · 10.1016/j.nicl.2018.04.010

Cites

66 of 66 references verified0 citation errors · 0 not checkable

Statistics

Figures

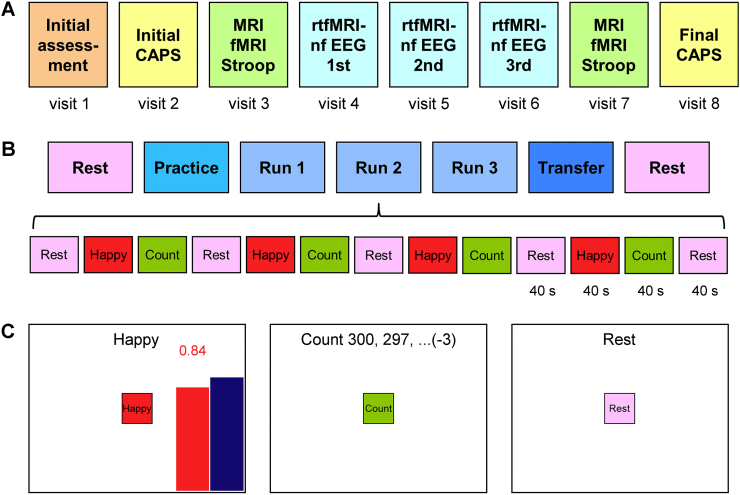
Fig. 1 Overview of the emotion self-regulation study utilizing real-time fMRI neurofeedback (rtfMRI-nf) of the amygdala in veterans with combat-related PTSD. A) The study included eight sessions (visits) with three rtfMRI-nf training sessions (visits 4, 5, 6) and two PTSD symptom assessment (CAPS) sessions (visits 2, 8). B) Experimental protocol for one rtfMRI-nf session. It consisted of seven runs, each lasting 8 min 46 s. It included two Rest runs, four rtfMRI-nf runs – Practice, Run 1, Run 2, Run 3, and a Transfer run without nf. The names of the five task runs are abbreviated in the text and figures as PR, R1, R2, R3, and TR, respectively. The experimental runs (except the Rest) consisted of 40-s long blocks of Happy Memories, Count, and Rest conditions (abbreviated as H, C, and R, respectively). C) Real-time GUI display screens for the Happy Memories, Count, and Rest conditions. The rtfMRI-nf signal is displayed during the Happy Memories conditions in the four nf runs as the variable-height red bar. The height of the red bar represents real-time fMRI activity of the target ROI. It is updated every 2 s. The height of the blue bar specifies a target level for the rtfMRI-nf signal. It is raised from run to run. (For interpretation of the references to color in this figure legend, the reader is referred to the web version of this article.)
Fig. 1 Overview of the emotion self-regulation study utilizing real-time fMRI neurofeedback (rtfMRI-nf) of the amygdala in veterans with combat-related PTSD. A) The study included eight sessions (visits) with three rtfMRI-nf training sessions (visits 4, 5, 6) and two PTSD symptom assessment (CAPS) sessions (visits 2, 8). B) Experimental protocol for one rtfMRI-nf session. It consisted of seven runs, each lasting 8 min 46 s. It included two Rest runs, four rtfMRI-nf runs – Practice, Run 1, Run 2, Run 3, and a Transfer run without nf. The names of the five task runs are abbreviated in the text and figures as PR, R1, R2, R3, and TR, respectively. The experimental runs (except the Rest) consisted of 40-s long blocks of Happy Memories, Count, and Rest conditions (abbreviated as H, C, and R, respectively). C) Real-time GUI display screens for the Happy Memories, Count, and Rest conditions. The rtfMRI-nf signal is displayed during the Happy Memories conditions in the four nf runs as the variable-height red bar. The height of the red bar represents real-time fMRI activity of the target ROI. It is updated every 2 s. The height of the blue bar specifies a target level for the rtfMRI-nf signal. It is raised from run to run. (For interpretation of the references to color in this figure legend, the reader is referred to the web version of this article.)CC BY-NC-ND · PubMed Central
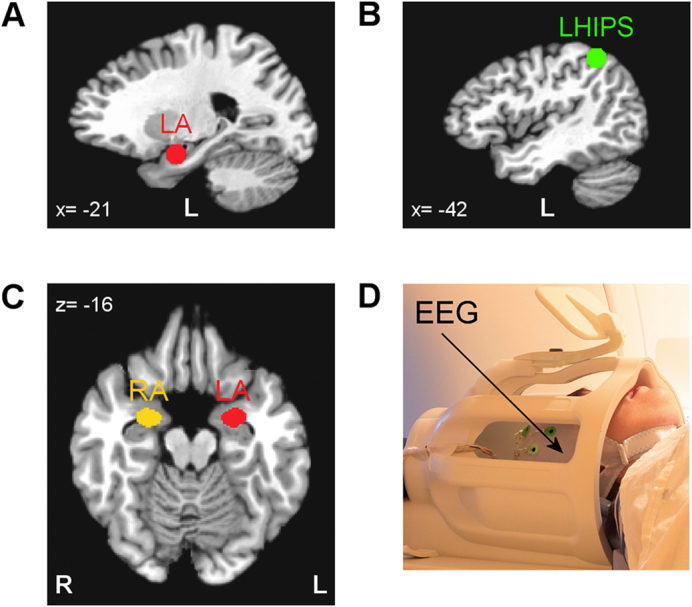
Fig. 2 Regions of interest for real-time fMRI data processing and offline fMRI data analyses. A) Spherical 14-mm diameter target ROI in the left amygdala (LA) region used to provide rtfMRI-nf for the experimental group (EG). B) Spherical 14-mm diameter target ROI in the left horizontal segment of the intraparietal sulcus (LHIPS) region used to provide sham rtfMRI-nf for the control group (CG). C) Left amygdala (LA) and right amygdala (RA) ROIs defined anatomically as the amygdala regions specified in the co-planar stereotaxic atlas of the human brain by Talairach and Tournoux. These ROIs were employed in the offline fMRI data analyses. The ROIs are projected in the figure onto the standard TT_N27 template in the Talairach space. Following the radiological notation, the left hemisphere (L) is shown to the reader's right. D) A 32-channel MR-compatible EEG system from Brain Products, GmbH was used to perform EEG recordings during fMRI.
Fig. 2 Regions of interest for real-time fMRI data processing and offline fMRI data analyses. A) Spherical 14-mm diameter target ROI in the left amygdala (LA) region used to provide rtfMRI-nf for the experimental group (EG). B) Spherical 14-mm diameter target ROI in the left horizontal segment of the intraparietal sulcus (LHIPS) region used to provide sham rtfMRI-nf for the control group (CG). C) Left amygdala (LA) and right amygdala (RA) ROIs defined anatomically as the amygdala regions specified in the co-planar stereotaxic atlas of the human brain by Talairach and Tournoux. These ROIs were employed in the offline fMRI data analyses. The ROIs are projected in the figure onto the standard TT_N27 template in the Talairach space. Following the radiological notation, the left hemisphere (L) is shown to the reader's right. D) A 32-channel MR-compatible EEG system from Brain Products, GmbH was used to perform EEG recordings during fMRI.CC BY-NC-ND · PubMed Central
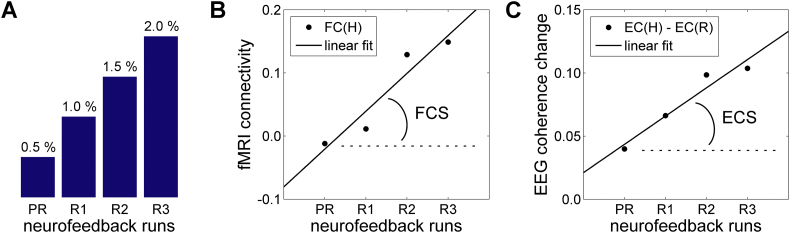
Fig. 3 Measures used to characterize linear trends in functional connectivity across neurofeedback runs in fMRI and EEG domains. A) The target level for the rtfMRI-nf (blue bar in Fig. 1C) was raised in a linear fashion across the four rtfMRI-nf runs (Practice, Run 1, Run 2, Run 3) in each neurofeedback session (Fig. 1B). B) Definition of the fMRI connectivity slope (FCS). It is defined, for each fMRI voxel, as a slope of a linear trend in fMRI connectivity during the Happy Memories conditions, FC(H), with the seed ROI across the four rtfMRI-nf runs. C) Definition of the EEG coherence slope (ECS). It is defined, for each pair of EEG channels, as a slope of a linear trend in upper alpha EEG coherence changes between the Rest and Happy Memories conditions, EC(H) − EC(R), across the four rtfMRI-nf runs.
Fig. 3 Measures used to characterize linear trends in functional connectivity across neurofeedback runs in fMRI and EEG domains. A) The target level for the rtfMRI-nf (blue bar in Fig. 1C) was raised in a linear fashion across the four rtfMRI-nf runs (Practice, Run 1, Run 2, Run 3) in each neurofeedback session (Fig. 1B). B) Definition of the fMRI connectivity slope (FCS). It is defined, for each fMRI voxel, as a slope of a linear trend in fMRI connectivity during the Happy Memories conditions, FC(H), with the seed ROI across the four rtfMRI-nf runs. C) Definition of the EEG coherence slope (ECS). It is defined, for each pair of EEG channels, as a slope of a linear trend in upper alpha EEG coherence changes between the Rest and Happy Memories conditions, EC(H) − EC(R), across the four rtfMRI-nf runs.CC BY-NC-ND · PubMed Central
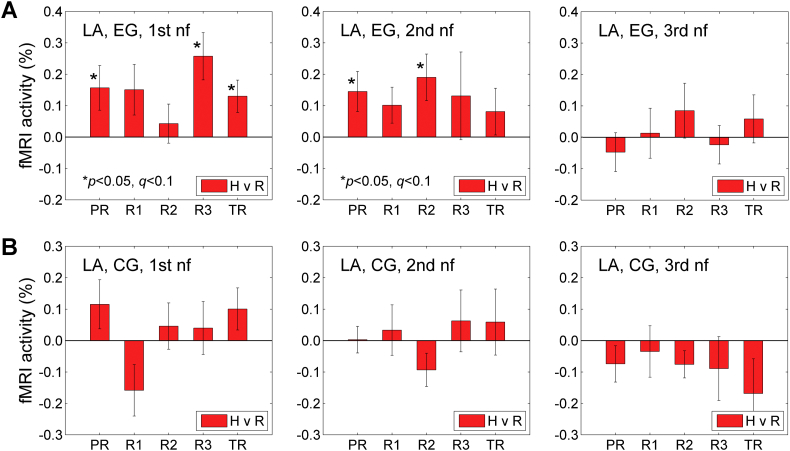
Fig. 4 BOLD activity of the left amygdala during the Happy Memories conditions in the three rtfMRI-nf sessions. A) Average fMRI percent signal changes for the left amygdala ROI (LA, Fig. 2C) across the five task runs in the 1st (visit 4), 2nd (visit 5), and 3rd (visit 6) rtfMRI-nf sessions (Fig. 1A) for the experimental group (EG). Each bar represents a mean GLM-based fMRI percent signal change for the Happy Memories conditions with respect to the Rest baseline (H vs R) in a given run, averaged across the group. The error bars are standard errors of the means (sem) for the group averages. The experimental runs and condition blocks are depicted schematically in Fig. 1B. B) Corresponding average fMRI percent signal changes for the control group (CG).
Fig. 4 BOLD activity of the left amygdala during the Happy Memories conditions in the three rtfMRI-nf sessions. A) Average fMRI percent signal changes for the left amygdala ROI (LA, Fig. 2C) across the five task runs in the 1st (visit 4), 2nd (visit 5), and 3rd (visit 6) rtfMRI-nf sessions (Fig. 1A) for the experimental group (EG). Each bar represents a mean GLM-based fMRI percent signal change for the Happy Memories conditions with respect to the Rest baseline (H vs R) in a given run, averaged across the group. The error bars are standard errors of the means (sem) for the group averages. The experimental runs and condition blocks are depicted schematically in Fig. 1B. B) Corresponding average fMRI percent signal changes for the control group (CG).CC BY-NC-ND · PubMed Central
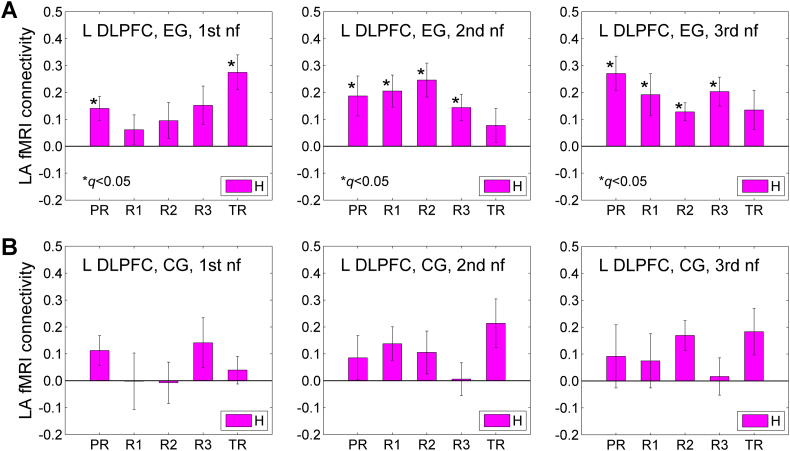
Fig. 5 fMRI functional connectivity between the left amygdala and the left dorsolateral prefrontal cortex (DLPFC) during the Happy Memories conditions in the three rtfMRI-nf sessions. A) Average fMRI connectivities of the LA seed ROI (Fig. 2C) with the left DLPFC ROI across the five task runs in the 1st (visit 4), 2nd (visit 5), and 3rd (visit 6) rtfMRI-nf sessions (Fig. 1A) for the experimental group (EG). The left DLPFC ROI is a 10-mm diameter ROI centered at (−45, 21, 24) in the Talairach space. This locus is shown in Fig. 10 below. Each bar represents a mean GLM-based fMRI connectivity strength (z-score) for the two ROIs during the Happy Memories conditions (H) in a given run, averaged across the group. The error bars are standard errors of the means (sem) for the group averages. B) Corresponding average fMRI connectivities for the control group (CG).
Fig. 5 fMRI functional connectivity between the left amygdala and the left dorsolateral prefrontal cortex (DLPFC) during the Happy Memories conditions in the three rtfMRI-nf sessions. A) Average fMRI connectivities of the LA seed ROI (Fig. 2C) with the left DLPFC ROI across the five task runs in the 1st (visit 4), 2nd (visit 5), and 3rd (visit 6) rtfMRI-nf sessions (Fig. 1A) for the experimental group (EG). The left DLPFC ROI is a 10-mm diameter ROI centered at (−45, 21, 24) in the Talairach space. This locus is shown in Fig. 10 below. Each bar represents a mean GLM-based fMRI connectivity strength (z-score) for the two ROIs during the Happy Memories conditions (H) in a given run, averaged across the group. The error bars are standard errors of the means (sem) for the group averages. B) Corresponding average fMRI connectivities for the control group (CG).CC BY-NC-ND · PubMed Central
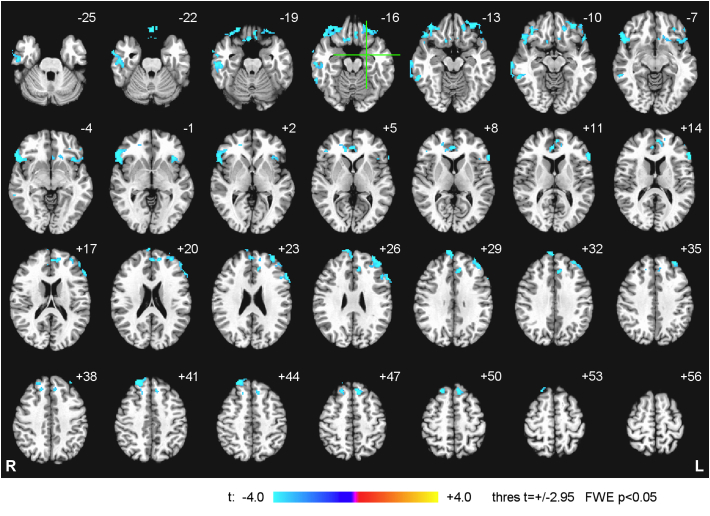
Fig. 6 Statistical maps of the correlation between the left amygdala fMRI connectivity during the Happy Memories conditions in the Practice run of the 1st rtfMRI-nf session and the initial PTSD severity for the experimental group (EG). The correlation is a voxel-wise partial correlation with the initial CAPS ratings controlled for comorbid depression severity (HDRS) ratings and average individual LA connectivity with central white matter. The maps are FWE corrected and projected onto the standard anatomical template TT_N27 in the Talairach space, with 3 mm separation between axial slices. The number adjacent to each slice indicates the z coordinate in mm. The left hemisphere (L) is to the reader's right. The green crosshairs mark the center of the LA target ROI. Peak t-statistics values for the correlation effect and the corresponding cluster properties are specified in Table 3.
Fig. 6 Statistical maps of the correlation between the left amygdala fMRI connectivity during the Happy Memories conditions in the Practice run of the 1st rtfMRI-nf session and the initial PTSD severity for the experimental group (EG). The correlation is a voxel-wise partial correlation with the initial CAPS ratings controlled for comorbid depression severity (HDRS) ratings and average individual LA connectivity with central white matter. The maps are FWE corrected and projected onto the standard anatomical template TT_N27 in the Talairach space, with 3 mm separation between axial slices. The number adjacent to each slice indicates the z coordinate in mm. The left hemisphere (L) is to the reader's right. The green crosshairs mark the center of the LA target ROI. Peak t-statistics values for the correlation effect and the corresponding cluster properties are specified in Table 3.CC BY-NC-ND · PubMed Central
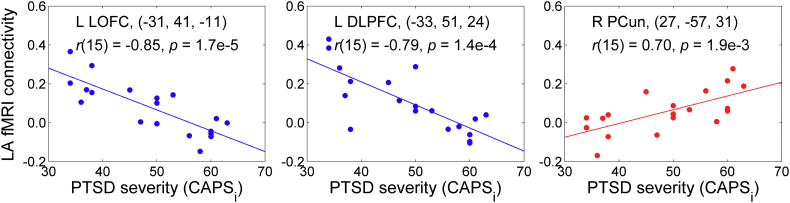
Fig. 7 Illustration of the correlation effects between the LA fMRI connectivity during the first Practice run and the initial PTSD severity, exhibited in Fig. 6. Each plot shows an average correlation effect for a 10-mm diameter ROI centered at a specified location. The correlation is a partial correlation with the initial CAPS ratings controlled for HDRS ratings and average individual LA connectivity with central white matter (n = 19, df = 15). The results for the left LOFC and the left DLPFC correspond to those reported in Fig. 6 and Table 3. The result for the right PCun is included to illustrate existence of positive correlations between the LA fMRI connectivity and PTSD severity (see text). Abbreviations: LOFC – lateral orbitofrontal cortex, DLPFC – dorsolateral prefrontal cortex, PCun – precuneus.
Fig. 7 Illustration of the correlation effects between the LA fMRI connectivity during the first Practice run and the initial PTSD severity, exhibited in Fig. 6. Each plot shows an average correlation effect for a 10-mm diameter ROI centered at a specified location. The correlation is a partial correlation with the initial CAPS ratings controlled for HDRS ratings and average individual LA connectivity with central white matter (n = 19, df = 15). The results for the left LOFC and the left DLPFC correspond to those reported in Fig. 6 and Table 3. The result for the right PCun is included to illustrate existence of positive correlations between the LA fMRI connectivity and PTSD severity (see text). Abbreviations: LOFC – lateral orbitofrontal cortex, DLPFC – dorsolateral prefrontal cortex, PCun – precuneus.CC BY-NC-ND · PubMed Central
Fig. 8 Statistical maps of the correlation between the left amygdala fMRI connectivity slope (FCS) during the 1st rtfMRI-nf session and the initial PTSD severity for the experimental group (EG). The FCS is defined in Fig. 3B. The correlation is a voxel-wise partial correlation with the initial CAPS ratings controlled for comorbid depression severity (HDRS) ratings and average individual LA FCS for central white matter. The maps are FWE corrected. The green crosshairs mark the statistical peak locations, with their Talairach coordinates specified underneath. Peak t-statistics values and the corresponding cluster properties are described in Table 4. Abbreviations: LOFC – lateral orbitofrontal cortex, DLPFC – dorsolateral prefrontal cortex.
Fig. 8 Statistical maps of the correlation between the left amygdala fMRI connectivity slope (FCS) during the 1st rtfMRI-nf session and the initial PTSD severity for the experimental group (EG). The FCS is defined in Fig. 3B. The correlation is a voxel-wise partial correlation with the initial CAPS ratings controlled for comorbid depression severity (HDRS) ratings and average individual LA FCS for central white matter. The maps are FWE corrected. The green crosshairs mark the statistical peak locations, with their Talairach coordinates specified underneath. Peak t-statistics values and the corresponding cluster properties are described in Table 4. Abbreviations: LOFC – lateral orbitofrontal cortex, DLPFC – dorsolateral prefrontal cortex.CC BY-NC-ND · PubMed Central
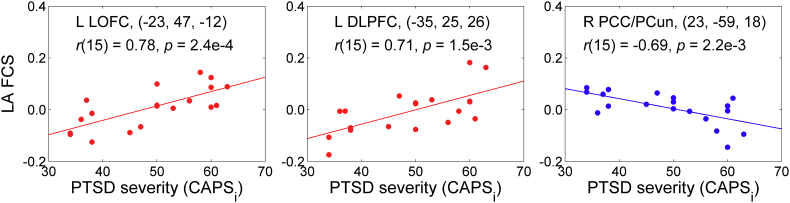
Fig. 9 Illustration of the correlation effects between the LA FCS and the initial PTSD severity, exhibited in Fig. 8. Each plot shows an average correlation effect for a 10-mm diameter ROI centered at a specified location. The correlation is a partial correlation with the initial CAPS ratings controlled for HDRS ratings and average individual LA FCS for central white matter (n = 19, df = 15). The results for the left LOFC and the left DLPFC correspond to those reported in Fig. 8 and Table 4. The result for the right posterior cingulate/precuneus (PCC/PCun) is included to illustrate existence of negative correlations between the LA FCS and PTSD severity (see text).
Fig. 9 Illustration of the correlation effects between the LA FCS and the initial PTSD severity, exhibited in Fig. 8. Each plot shows an average correlation effect for a 10-mm diameter ROI centered at a specified location. The correlation is a partial correlation with the initial CAPS ratings controlled for HDRS ratings and average individual LA FCS for central white matter (n = 19, df = 15). The results for the left LOFC and the left DLPFC correspond to those reported in Fig. 8 and Table 4. The result for the right posterior cingulate/precuneus (PCC/PCun) is included to illustrate existence of negative correlations between the LA FCS and PTSD severity (see text).CC BY-NC-ND · PubMed Central
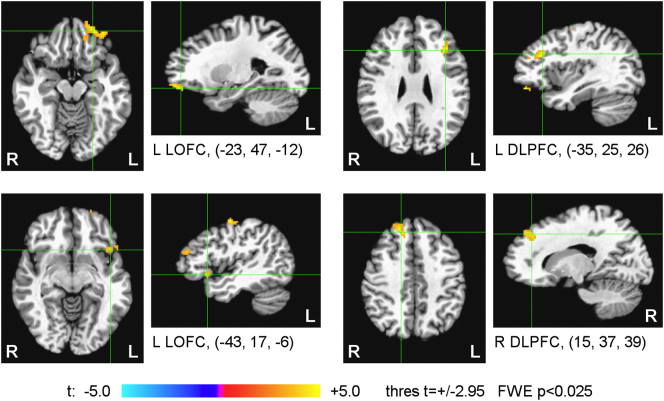
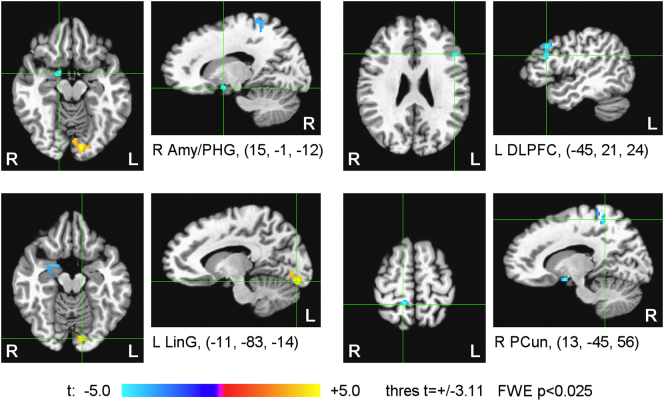
Fig. 10 Statistical maps of the correlation of the average left amygdala fMRI connectivity changes between the final (3rd) and initial (1st) rtfMRI-nf sessions and the corresponding changes in PTSD severity for the experimental group (EG). The LA fMRI connectivity values were averaged across Happy Memories conditions in the four rtfMRI-nf runs for each session. The correlation is a voxel-wise partial correlation with the changes in the CAPS ratings (final vs initial) controlled for corresponding changes in comorbid depression severity (HDRS) ratings and changes in average individual LA connectivity for central white matter. The maps are FWE corrected. The green crosshairs mark the statistical peak locations, with their Talairach coordinates specified underneath. Peak t-statistics values and the corresponding cluster properties are described in Table 5. Abbreviations: Amy – amygdala, PHG – parahippocampal gyrus, DLPFC – dorsolateral prefrontal cortex, LinG – lingual gyrus, PCun – precuneus.
Fig. 10 Statistical maps of the correlation of the average left amygdala fMRI connectivity changes between the final (3rd) and initial (1st) rtfMRI-nf sessions and the corresponding changes in PTSD severity for the experimental group (EG). The LA fMRI connectivity values were averaged across Happy Memories conditions in the four rtfMRI-nf runs for each session. The correlation is a voxel-wise partial correlation with the changes in the CAPS ratings (final vs initial) controlled for corresponding changes in comorbid depression severity (HDRS) ratings and changes in average individual LA connectivity for central white matter. The maps are FWE corrected. The green crosshairs mark the statistical peak locations, with their Talairach coordinates specified underneath. Peak t-statistics values and the corresponding cluster properties are described in Table 5. Abbreviations: Amy – amygdala, PHG – parahippocampal gyrus, DLPFC – dorsolateral prefrontal cortex, LinG – lingual gyrus, PCun – precuneus.CC BY-NC-ND · PubMed Central
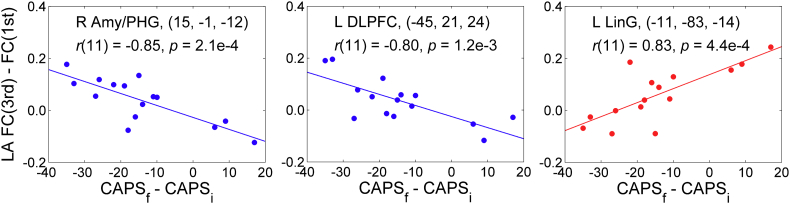
Fig. 11 Illustration of the correlation effects between the average LA fMRI connectivity changes and the corresponding PTSD severity changes for the experimental group, exhibited in Fig. 10. Each plot shows an average correlation effect for a 10-mm diameter ROI centered at a specified location. The correlation is a partial correlation with the changes in CAPS ratings (final vs initial) controlled for corresponding changes in HDRS ratings and changes in average individual LA connectivity for central white matter (n = 15, df = 11).
Fig. 11 Illustration of the correlation effects between the average LA fMRI connectivity changes and the corresponding PTSD severity changes for the experimental group, exhibited in Fig. 10. Each plot shows an average correlation effect for a 10-mm diameter ROI centered at a specified location. The correlation is a partial correlation with the changes in CAPS ratings (final vs initial) controlled for corresponding changes in HDRS ratings and changes in average individual LA connectivity for central white matter (n = 15, df = 11).CC BY-NC-ND · PubMed Central
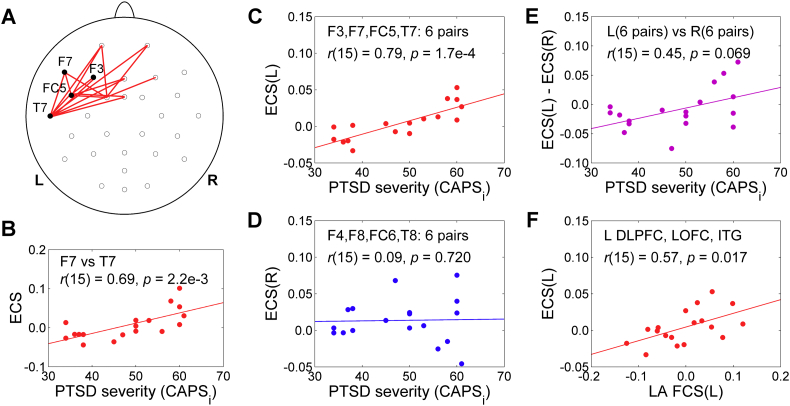
Fig. 12 Correlation between the EEG coherence slope (ECS) in the upper alpha band during the 1st rtfMRI-nf session and the initial PTSD severity for the experimental group (EG). The ECS is defined in Fig. 3C. The correlation for each EEG channel pair (or average across multiple channel pairs) is a partial correlation with the initial CAPS ratings controlled for comorbid depression severity (HDRS) ratings (n = 18, df = 15). A) Red segments denote EEG channel pairs for which the ECS vs CAPS correlations are positive (r(15) > 0, p < 0.05, uncorr.). B) Example of such correlation for one channel pair. C) Significant correlation between the ECS(L), i.e. the average ECS for 6 pairs of prefronto-temporal EEG channels on the left, and the CAPS ratings. D) Lack of correlation between the ECS(R), i.e. the average ECS for 6 pairs of corresponding prefronto-temporal EEG channels on the right, and the CAPS ratings. E) Correlation between the average ECS laterality, ECS(L) − ECS(R), and the CAPS ratings. F) Correlation between the average LA fMRI connectivity slope (FCS) for three ROIs in the prefronto-temporal regions on the left and the ECS(L). Abbreviations: DLPFC – dorsolateral prefrontal cortex, LOFC – lateral orbitofrontal cortex, ITG – inferior temporal gyrus.
Fig. 12 Correlation between the EEG coherence slope (ECS) in the upper alpha band during the 1st rtfMRI-nf session and the initial PTSD severity for the experimental group (EG). The ECS is defined in Fig. 3C. The correlation for each EEG channel pair (or average across multiple channel pairs) is a partial correlation with the initial CAPS ratings controlled for comorbid depression severity (HDRS) ratings (n = 18, df = 15). A) Red segments denote EEG channel pairs for which the ECS vs CAPS correlations are positive (r(15) > 0, p < 0.05, uncorr.). B) Example of such correlation for one channel pair. C) Significant correlation between the ECS(L), i.e. the average ECS for 6 pairs of prefronto-temporal EEG channels on the left, and the CAPS ratings. D) Lack of correlation between the ECS(R), i.e. the average ECS for 6 pairs of corresponding prefronto-temporal EEG channels on the right, and the CAPS ratings. E) Correlation between the average ECS laterality, ECS(L) − ECS(R), and the CAPS ratings. F) Correlation between the average LA fMRI connectivity slope (FCS) for three ROIs in the prefronto-temporal regions on the left and the ECS(L). Abbreviations: DLPFC – dorsolateral prefrontal cortex, LOFC – lateral orbitofrontal cortex, ITG – inferior temporal gyrus.CC BY-NC-ND · PubMed Central

Verification

Claims the paper makes

The claims and statistics of this paper haven’t been checked yet.

Run the check — free, no account needed. It reads the open-access text and checks the sources it cites.

A few free checks a day · papers already verified open instantly · results are public

Claims other papers make about this one

Each is checked against this paper’s own text: does it say what the citing paper says it does?

Self-check

Percentages, sums and reported differences re-computed from the paper’s own numbers.

The self-check needs the paper’s full text.

Citations

Cites

Show all 67 references

Cited by

Sorted by citations

Items 101–135 of 135

Metadata

Authors
Zotev, V., Phillips, R., Misaki, M., Wong, C. K., Wurfel, B. E., Krueger, F., Feldner, M., & Bodurka, J.
Affiliations
  • Laureate Institute for Brain Research (US)
  • Laureate Psychiatric Clinic and Hospital (US)
  • University of Arkansas at Fayetteville (US)
Corresponding author
Bodurka, Jerzy
Venue
NeuroImage Clinical
Publisher
Elsevier BV
Published
2018
Volume
19
Pages
106-121
ISSN
2213-1582 (ISSN-L)
OpenAlex
W2786003115
Cited by
135
References
67
Citations by year
2026: 8 · 2025: 12 · 2024: 16 · 2023: 20 · 2022: 22 · 2021: 20 · 2020: 17 · 2019: 16 · 2018: 4
FWCI
16.71
Type
journal article
Language
en
Open access
Locations
  • NeuroImage Clinical (publishedVersion, cc-by-nc-nd)
  • Europe PMC (PubMed Central) (publishedVersion, cc-by-nc-nd)
  • PubMed Central (publishedVersion, cc-by-nc-nd)
  • PubMed (publishedVersion)
  • arXiv (Cornell University) (submittedVersion)
  • DOAJ (DOAJ: Directory of Open Access Journals) (submittedVersion)
  • arXiv (Cornell University)
Funders
U.S. Department of Defense
Topics
  • Social Sciences › Psychology › Clinical Psychology › Posttraumatic Stress Disorder Research
  • Life Sciences › Neuroscience › Cognitive Neuroscience › Neural and Behavioral Psychology Studies
  • Life Sciences › Neuroscience › Neurology › Transcranial Magnetic Stimulation Studies
Keywords
real-time fMRI neurofeedback, amygdala activity, combat-related posttraumatic stress disorder, veterans, dorsolateral prefrontal cortex, orbitofrontal cortex, emotion regulation, comorbid depression, avoidance symptoms, hyperarousal
MeSH terms
Adult, Amygdala, Brain Mapping, Major Depressive Disorder, Emotions, Female, Humans, Image Processing, Computer-Assisted, Learning, Magnetic Resonance Imaging, Male, Middle Aged, Stress Disorders, Post-Traumatic, Neurofeedback

About these checks

Registry, retraction, Cites and statistics results are computed, not judged, with one exception: a printed reference that no index lists is read once by a model before it counts as a citation error. Claims are extracted by a model and kept only when their quote appears verbatim in the text; each cited source is then checked, with a model’s help, for whether it says what the claim relies on. Those verdicts can be wrong — read the claim’s quote and the cited source before relying on one.

Statistics and arithmetic are recomputed, not judged.

Confidence bands are shown only for fields calibrated on our annotated test set. None is calibrated yet, so no band is shown.

What counts as a claim ›How we measure confidence ›How we check this ›

Are you an author, or do you see a problem with this page? Request a review