

The DOI matches its Crossref record; 22 of the 22 references it cites were found in a registry or an index.
Lipid nanoparticle delivery limits antisense oligonucleotide activity and cellular distribution in the brain after intracerebroventricular injection
Overview
The claims and statistics of this paper haven’t been checked yet.
Run the check — free, no account needed. It reads the open-access text and checks the sources it cites.
Integrity signals
Registry
Cites
Statistics
Figures
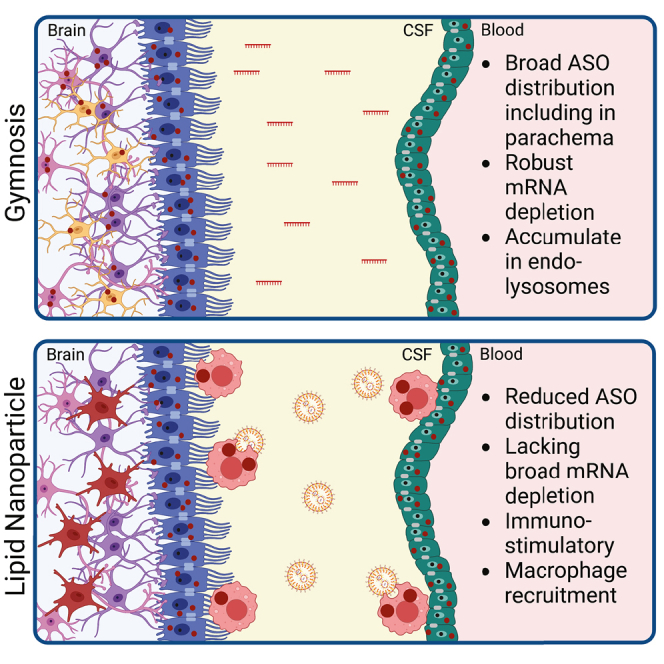
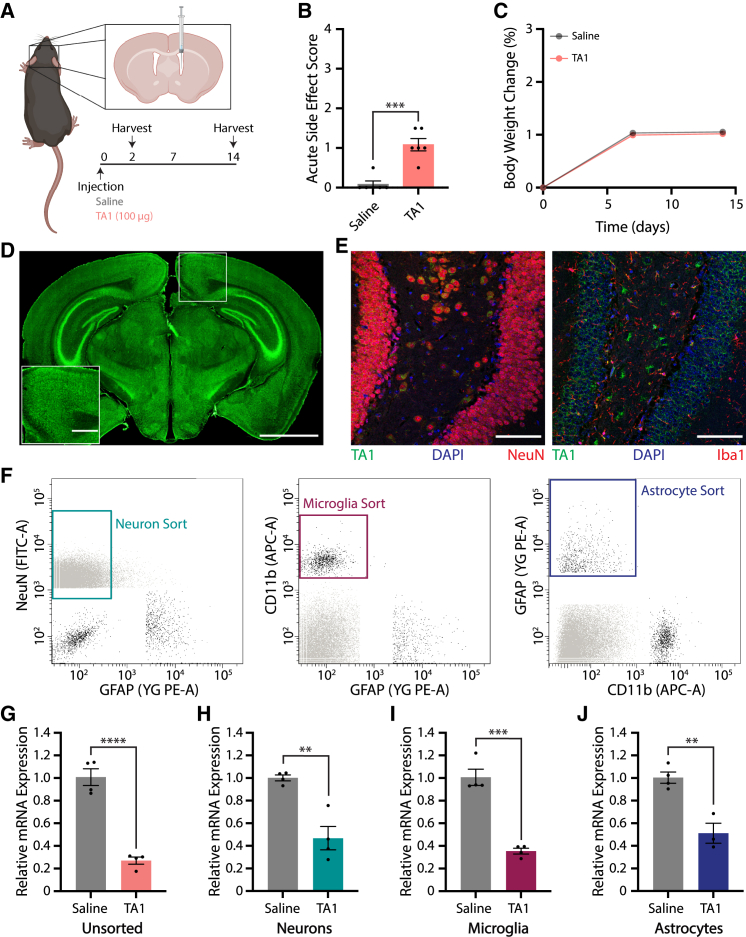
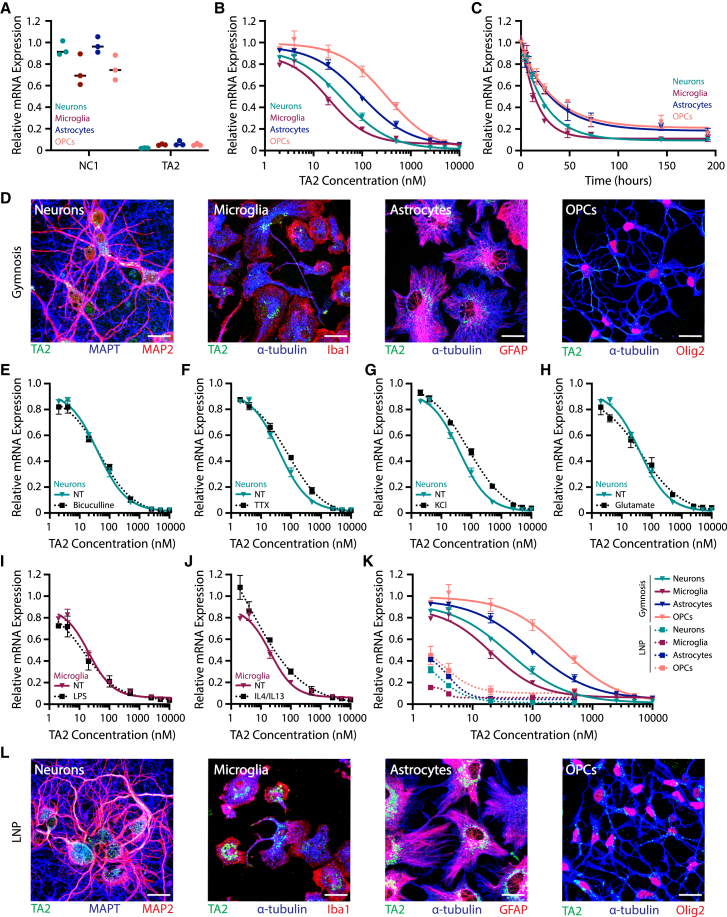
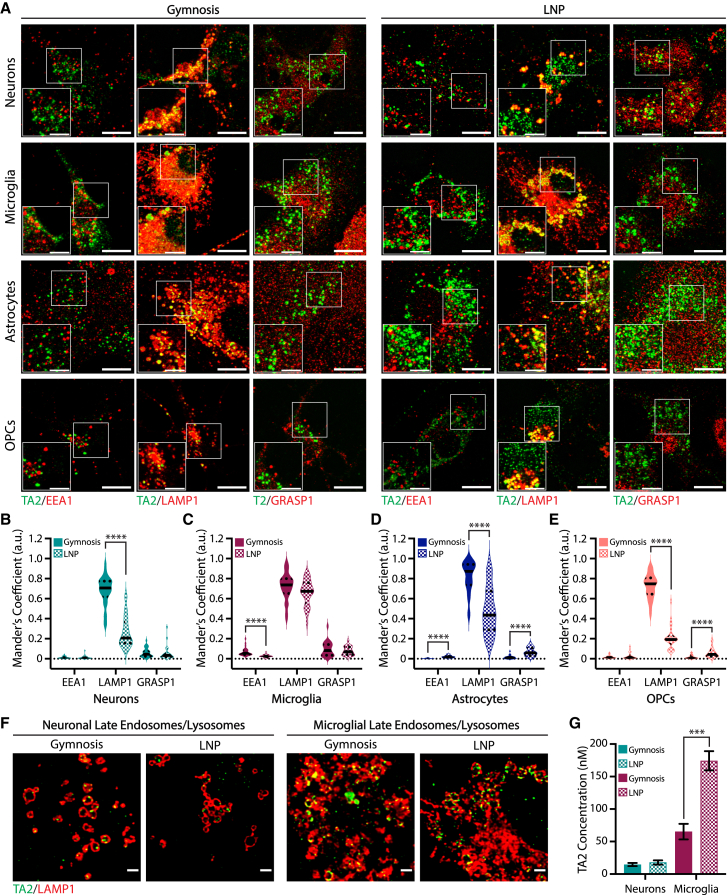
Verification
Claims the paper makes
The claims and statistics of this paper haven’t been checked yet.
Run the check — free, no account needed. It reads the open-access text and checks the sources it cites.
Claims other papers make about this one
Each is checked against this paper’s own text: does it say what the citing paper says it does?
The source backs part of the claim, not all of it — or backs it for a different population, condition or comparison.
In the citing paper
“the uptake of naked oligoribonucleotides, termed gymnosis [59, 60], primarily by cell lines, but also primary neurons has been reported [61, 62].”
From Neurodegenerative disease-associated microRNAs acting as signaling molecules modulate CNS neuron structure and viability (2025) · cites this paper as [62]
Experimental — accuracy not yet measured
Self-check
Percentages, sums and reported differences re-computed from the paper’s own numbers.
The self-check needs the paper’s full text.
Citations
Cites
Lipid nanoparticles for mRNA delivery
Hou, X., Zaks, T., Langer, R., & Dong, Y. (2021) · Nature Reviews Materials · doi:10.1038/s41578-021-00358-0 · Cited by 4,076
Patisiran, an RNAi Therapeutic, for Hereditary Transthyretin Amyloidosis
Adams, D., Gonzalez-Duarte, A., O’Riordan, W. D., Yang, C.-C., Ueda, M., Kristen, A. V., Tournev, I., Schmidt, H. H., Coelho, T., Berk, J. L., et al. (2018) · New England Journal of Medicine · doi:10.1056/nejmoa1716153 · Cited by 3,047
Nusinersen versus Sham Control in Infantile-Onset Spinal Muscular Atrophy
Finkel, R. S., Mercuri, E., Darras, B. T., Connolly, A. M., Kuntz, N. L., Kirschner, J., Chiriboga, C. A., Saito, K., Servais, L., Tizzano, E., et al. (2017) · New England Journal of Medicine · doi:10.1056/nejmoa1702752 · Cited by 2,337
Rational design of cationic lipids for siRNA delivery
Semple, S. C., Akinc, A., Chen, J., Sandhu, A. P., Mui, B. L., Cho, C. K., Sah, D. W. Y., Stebbing, D., Crosley, E. J., Yaworski, E., et al. (2010) · Nature Biotechnology · doi:10.1038/nbt.1602 · Cited by 1,822
Pathology of Neurodegenerative Diseases
Dugger, B. N., & Dickson, D. W. (2017) · Cold Spring Harbor Perspectives in Biology · doi:10.1101/cshperspect.a028035 · Cited by 1,665
Endosomal escape pathways for delivery of biologicals
Varkouhi, A. K., Scholte, M., Storm, G., & Haisma, H. J. (2011) · Journal of Controlled Release · doi:10.1016/j.jconrel.2010.11.004 · Cited by 1,561
Targeting Huntingtin Expression in Patients with Huntington’s Disease
Tabrizi, S. J., Leavitt, B. R., Landwehrmeyer, G. B., Wild, E. J., Saft, C., Barker, R. A., Blair, N. F., Craufurd, D., Priller, J., Rickards, H., et al. (2019) · New England Journal of Medicine · doi:10.1056/nejmoa1900907 · Cited by 708
Friedman, B. A., Srinivasan, K., Ayalon, G., Meilandt, W. J., Lin, H., Huntley, M. A., Cao, Y., Lee, S.-H., Haddick, P. C. G., Ngu, H., et al. (2018) · Cell Reports · doi:10.1016/j.celrep.2017.12.066 · Cited by 662 · cited 2×
“Transcriptomic data were analyzed with the GSNAP aligner,(69) HTSeqGenie,(70) and voom-limma,(71) as described previously.(72) GO enrichment testing was performed using GOfuncR(73,74) and redundant terms were reduced based on semantic similarity through rrvgo.”
MethodSelf-citationPhase 1–2 Trial of Antisense Oligonucleotide Tofersen for SOD1 ALS
Miller, T., Cudkowicz, M., Shaw, P. J., Andersen, P. M., Atassi, N., Bucelli, R. C., Genge, A., Glass, J., Ladha, S., Ludolph, A. L., et al. (2020) · New England Journal of Medicine · doi:10.1056/nejmoa2003715 · Cited by 565 · cited 1×
“These data also support clinical work showing that ASOs modulate disease pathology in many neurodegenerative model systems.(3,36,37)”
ResultUntangling the brain’s neuroinflammatory and neurodegenerative transcriptional responses
Srinivasan, K., Friedman, B. A., Larson, J. L., Lauffer, B. E., Goldstein, L. D., Appling, L. L., Borneo, J., Poon, C., Ho, T., Cai, F., et al. (2016) · Nature Communications · doi:10.1038/ncomms11295 · Cited by 336
Self-citationBarcoded nanoparticles for high throughput in vivo discovery of targeted therapeutics
Dahlman, J. E., Kauffman, K. J., Xing, Y., Shaw, T. E., Mir, F. F., Dlott, C. C., Langer, R., Anderson, D. G., & Wang, E. T. (2017) · Proceedings of the National Academy of Sciences · doi:10.1073/pnas.1620874114 · Cited by 335
Sago, C. D., Lokugamage, M. P., Paunovska, K., Vanover, D. A., Monaco, C. M., Shah, N. N., Gamboa Castro, M., Anderson, S. E., Rudoltz, T. G., Lando, G. N., et al. (2018) · Proceedings of the National Academy of Sciences · doi:10.1073/pnas.1811276115 · Cited by 313
Antisense oligonucleotides: translation from mouse models to human neurodegenerative diseases
Schoch, K. M., & Miller, T. M. (2017) · Neuron · doi:10.1016/j.neuron.2017.04.010 · Cited by 274 · cited 2×
“Alternatively, ASO gapmers typically promote RNase H1 recruitment, which targets RNA for degradation and reduces protein expression.(2) Recent years have seen a marked increase in ASO development for the treatment of various neurodegenerative diseases.”
BackgroundMa, F., Yang, L., Sun, Z., Chen, J., Rui, X., Glass, Z., & Xu, Q. (2020) · Science Advances · doi:10.1126/sciadv.abb4429 · Cited by 218 · cited 1×
“Of note are two studies: the first hijacked GLUT1 to deliver glucose-coated ASO-LNPs across the BBB(42) and the second utilized neurotransmitter “lipidoids” to enhance brain delivery.(43) Although these studies are promising, additional details are needed to understand how LNPs affect ASO localization, trafficking, an…”
Meilandt, W. J., Ngu, H., Gogineni, A., Lalehzadeh, G., Lee, S.-H., Srinivasan, K., Imperio, J., Wu, T., Weber, M., Kruse, A. J., et al. (2020) · The Journal of Neuroscience · doi:10.1523/jneurosci.1871-19.2019 · Cited by 210 · cited 1×
“Analysis of positive stain area was performed using color thresholds and morphological operations as described previously.(67,68) Integrated optical density measurements were calculated by converting to grayscale intensity and applying Beer-Lambert law.”
MethodSelf-citationReview of COVID-19 mRNA Vaccines: BNT162b2 and mRNA-1273
Teo, S. P. (2022) · Journal of Pharmacy Practice · doi:10.1177/08971900211009650 · Cited by 191
Lipid Nanoparticle Delivery of siRNA to Silence Neuronal Gene Expression in the Brain
Rungta, R. L., Choi, H. B., Lin, P. J., Ko, R. W., Ashby, D., Nair, J., Manoharan, M., Cullis, P. R., & MacVicar, B. A. (2013) · Molecular Therapy—Nucleic Acids · doi:10.1038/mtna.2013.65 · Cited by 165
Identification of evolutionarily conserved gene networks mediating neurodegenerative dementia
Swarup, V., Hinz, F. I., Rexach, J. E., Noguchi, K.-I., Toyoshiba, H., Oda, A., Hirai, K., Sarkar, A., Seyfried, N. T., Cheng, C., et al. (2019) · Nature Medicine · doi:10.1038/s41591-018-0223-3 · Cited by 136
Self-citationJafar-nejad, P., Powers, B., Soriano, A., Zhao, H., Norris, D. A., Matson, J., DeBrosse-Serra, B., Watson, J., Narayanan, P., Chun, S. J., et al. (2021) · Nucleic Acids Research · doi:10.1093/nar/gkaa1235 · Cited by 128
Antisense drugs make sense for neurological diseases
Bennett, C. F., Kordasiewicz, H. B., & Cleveland, D. W. (2021) · Annual Review of Pharmacology and Toxicology · doi:10.1146/annurev-pharmtox-010919-023738 · Cited by 108
Yang, L., Ma, F., Liu, F., Chen, J., Zhao, X., & Xu, Q. (2020) · Molecular Therapy - Nucleic Acids · doi:10.1016/j.omtn.2020.01.018 · Cited by 103
Intraventricular Delivery of siRNA Nanoparticles to the Central Nervous System
Shyam, R., Ren, Y., Lee, J., Braunstein, K. E., Mao, H.-Q., & Wong, P. C. (2015) · Molecular Therapy - Nucleic Acids · doi:10.1038/mtna.2015.15 · Cited by 58
Research works printed but not linked: 55
- Crooke, 2018, RNA-targeted therapeutics, Cell Metab., 27, 714, 10.1016/j.cmet.2018.03.004 · DOI · Paper page
- Rinaldi, 2018, Antisense oligonucleotides: the next frontier for treatment of neurological disorders, Nat. Rev. Neurol., 14, 9, 10.1038/nrneurol.2017.148 · DOI · Paper page
- Geary, 2015, Pharmacokinetics, biodistribution and cell uptake of antisense oligonucleotides, Adv. Drug Deliv. Rev., 87, 46, 10.1016/j.addr.2015.01.008 · DOI
- Crooke, 2017, Cellular uptake and trafficking of antisense oligonucleotides, Nat. Biotechnol., 35, 230, 10.1038/nbt.3779 · DOI · Paper page
- Juliano, 2016, The delivery of therapeutic oligonucleotides, Nucleic Acids Res., 44, 6518, 10.1093/nar/gkw236 · DOI
- Roberts, 2020, Advances in oligonucleotide drug delivery, Nat. Rev. Drug Discov., 19, 673, 10.1038/s41573-020-0075-7 · DOI
- Patravale, 2012, Nanoparticulate systems as drug carriers: the need, Nanoparticulate Drug Delivery, 1
- Hirunagi, 2021, Selective suppression of polyglutamine-expanded protein by lipid nanoparticle-delivered siRNA targeting CAG expansions in the mouse CNS, Mol. Ther. Nucleic Acids, 24, 1, 10.1016/j.omtn.2021.02.007 · DOI
- Conceição, 2016, Intravenous administration of brain-targeted stable nucleic acid lipid particles alleviates Machado-Joseph disease neurological phenotype, Biomaterials, 82, 124, 10.1016/j.biomaterials.2015.12.021 · DOI · Paper page
- Kwon, 2016, Neuron-targeted nanoparticle for siRNA delivery to traumatic brain injuries, ACS Nano, 10, 7926, 10.1021/acsnano.6b03858 · DOI
- Karlsson, 2019, Engineered nanoparticles for systemic siRNA delivery to malignant brain tumours, Nanoscale, 11, 20045, 10.1039/C9NR04795F · DOI
- Galbraith, 1994, Complement activation and hemodynamic changes following intravenous administration of phosphorothioate oligonucleotides in the monkey, Antisense Res. Dev., 4, 201, 10.1089/ard.1994.4.201 · DOI
- Levin, 1999, A review of the issues in the pharmacokinetics and toxicology of phosphorothioate antisense oligonucleotides, Biochim. Biophys. Acta, 1489, 69, 10.1016/S0167-4781(99)00140-2 · DOI · Paper page
- Easton, 2022, Identification and characterization of a MAPT-targeting locked nucleic acid antisense oligonucleotide therapeutic for tauopathies, Mol. Ther. Nucleic Acids, 29, 625, 10.1016/j.omtn.2022.07.027 · DOI
- Paramasivam, 2022, Endosomal escape of delivered mRNA from endosomal recycling tubules visualized at the nanoscale, J. Cell Biol., 221, e202110137, 10.1083/jcb.202110137 · DOI
- Schwartz, 2019, RNA regulation of the antiviral protein 2'-5'-oligoadenylate synthetase, Wiley Interdiscip. Rev. RNA, 10, e1534, 10.1002/wrna.1534 · DOI
- Lind, 2022, Regulation of the nucleic acid-sensing Toll-like receptors, Nat. Rev. Immunol., 22, 224, 10.1038/s41577-021-00577-0 · DOI
- Lund, 2004, Recognition of single-stranded RNA viruses by Toll-like receptor 7, Proc. Natl. Acad. Sci. USA, 101, 5598, 10.1073/pnas.0400937101 · DOI
- Gilleron, 2013, Image-based analysis of lipid nanoparticle-mediated siRNA delivery, intracellular trafficking and endosomal escape, Nat. Biotechnol., 31, 638, 10.1038/nbt.2612 · DOI · Paper page
- Migliorati, 2022, Absorption, distribution, metabolism, and excretion of FDA-approved antisense oligonucleotide drugs, Drug Metab. Dispos., 50, 888, 10.1124/dmd.121.000417 · DOI
- Dhuri, 2020, Antisense oligonucleotides: an emerging area in drug discovery and development, J. Clin. Med., 9, 2004, 10.3390/jcm9062004 · DOI
- Van Deerlin, 2010, Common variants at 7p21 are associated with frontotemporal lobar degeneration with TDP-43 inclusions, Nat. Genet., 42, 234, 10.1038/ng.536 · DOI · Paper page
- Finch, 2011, TMEM106B regulates progranulin levels and the penetrance of FTLD in GRN mutation carriers, Neurology, 76, 467, 10.1212/WNL.0b013e31820a0e3b · DOI · Paper page
- Jiang, 2022, Amyloid fibrils in FTLD-TDP are composed of TMEM106B and not TDP-43, Nature, 605, 304, 10.1038/s41586-022-04670-9 · DOI
- Schweighauser, 2022, Age-dependent formation of TMEM106B amyloid filaments in human brains, Nature, 605, 310, 10.1038/s41586-022-04650-z · DOI
- Tanaka, 2021, Delivery of oligonucleotides using a self-degradable lipid-like material, Pharmaceutics, 13, 544, 10.3390/pharmaceutics13040544 · DOI
- Yang, 2019, Delivery of antisense oligonucleotide using polyethylenimine-based lipid nanoparticle modified with cell penetrating peptide, Drug Deliv., 26, 965, 10.1080/10717544.2019.1667453 · DOI
- Chen, 2017, Improving the delivery of SOD1 antisense oligonucleotides to motor neurons using calcium phosphate-lipid nanoparticles, Front. Neurosci., 11, 476, 10.3389/fnins.2017.00476 · DOI
- Min, 2020, Systemic brain delivery of antisense oligonucleotides across the blood–brain barrier with a glucose-coated polymeric nanocarrier, Angew. Chem. Int. Ed. Engl., 59, 8173, 10.1002/anie.201914751 · DOI
- Fleck, 2019, PTCD1 is required for mitochondrial oxidative-phosphorylation: possible genetic association with alzheimer's disease, J. Neurosci., 39, 4636, 10.1523/JNEUROSCI.0116-19.2019 · DOI
- Sarode, 2022, Predictive high-throughput screening of PEGylated lipids in oligonucleotide-loaded lipid nanoparticles for neuronal gene silencing, Nanoscale Adv., 4, 2107, 10.1039/D1NA00712B · DOI
- Householder, 2019, Fate of nanoparticles in the central nervous system after intrathecal injection in healthy mice, Sci. Rep., 9, 12587, 10.1038/s41598-019-49028-w · DOI · Paper page
- Ohta, 2020, Investigating the optimum size of nanoparticles for their delivery into the brain assisted by focused ultrasound-induced blood–brain barrier opening, Sci. Rep., 10, 18220, 10.1038/s41598-020-75253-9 · DOI
- Yaari, 2016, Theranostic barcoded nanoparticles for personalized cancer medicine, Nat. Commun., 7, 13325, 10.1038/ncomms13325 · DOI
- Guimaraes, 2019, Ionizable lipid nanoparticles encapsulating barcoded mRNA for accelerated in vivo delivery screening, J. Control. Release, 316, 404, 10.1016/j.jconrel.2019.10.028 · DOI
- Sago, 2021, Screening of chemically distinct lipid nanoparticles in vivo using DNA barcoding technology towards effectively delivering messenger RNA to hematopoietic stem and progenitor cells, Blood, 138, 2931, 10.1182/blood-2021-153652 · DOI
- Pendergraff, 2020, Nuclear and cytoplasmatic quantification of unconjugated, label-free locked nucleic acid oligonucleotides, Nucleic Acid Ther., 30, 4, 10.1089/nat.2019.0810 · DOI
- Schindelin, 2012, Fiji: an open-source platform for biological-image analysis, Nat. Methods, 9, 676, 10.1038/nmeth.2019 · DOI · Paper page
- Witting, 2011, Microglia cell culture: a primer for the novice, Methods Mol. Biol., 758, 49, 10.1007/978-1-61779-170-3_4 · DOI
- Giulian, 1986, Characterization of ameboid microglia isolated from developing mammalian brain, J. Neurosci., 6, 2163, 10.1523/JNEUROSCI.06-08-02163.1986 · DOI
- McCarthy, 1980, Preparation of separate astroglial and oligodendroglial cell cultures from rat cerebral tissue, J. Cell Biol., 85, 890, 10.1083/jcb.85.3.890 · DOI
- Yang, 2005, Optimization of oligodendrocyte progenitor cell culture method for enhanced survival, J. Neurosci. Methods, 149, 50, 10.1016/j.jneumeth.2005.05.003 · DOI
- Schildge, 2013, Isolation and culture of mouse cortical astrocytes, J. Vis. Exp., 71, 50079
- Saura, 2003, High-yield isolation of murine microglia by mild trypsinization, Glia, 44, 183, 10.1002/glia.10274 · DOI
- Fan, 2021, Automated high-throughput preparation and characterization of oligonucleotide-loaded lipid nanoparticles, Int. J. Pharm., 599, 120392, 10.1016/j.ijpharm.2021.120392 · DOI
- Bolte, 2006, A guided tour into subcellular colocalization analysis in light microscopy, J. Microsc., 224, 213, 10.1111/j.1365-2818.2006.01706.x · DOI
- Le Pichon, 2017, Loss of dual leucine zipper kinase signaling is protective in animal models of neurodegenerative disease, Sci. Transl. Med., 9, eaag0394, 10.1126/scitranslmed.aag0394 · DOI
- Wu, 2016, GMAP and GSNAP for genomic sequence alignment: enhancements to speed, accuracy, and functionality, Methods Mol. Biol., 1418, 283, 10.1007/978-1-4939-3578-9_15 · DOI
- Law, 2014, voom: Precision weights unlock linear model analysis tools for RNA-seq read counts, Genome Biol., 15, R29, 10.1186/gb-2014-15-2-r29 · DOI · Paper page
- Prüfer, 2007, FUNC: a package for detecting significant associations between gene sets and ontological annotations, BMC Bioinformatics, 8, 41, 10.1186/1471-2105-8-41 · DOI
- Grote, 2021, GOfuncR: gene ontology enrichment using FUNC, Bioconductor Release, 3, 13
- Sayols, 2020, rrvgo: a Bioconductor package to reduce and visualize Gene Ontology terms, Bioconductor Release, 3, 13
- Liberzon, 2011, Molecular signatures database (MSigDB) 3.0, Bioinformatics, 27, 1739, 10.1093/bioinformatics/btr260 · DOI · Paper page
- Jassal, 2020, The reactome pathway knowledgebase, Nucleic Acids Res., 48, D498
- Wu, 2012, Camera: a competitive gene set test accounting for inter-gene correlation, Nucleic Acids Res., 40, e133, 10.1093/nar/gks461 · DOI
Cited by
Sorted by citations
Kumbol, V., Ivanov, A., McGurran, H., Schüler, J., Zhai, Y., Ludwik, K., Hinkelmann, L., Brehm, M., Krüger, C., Küchler, J., et al. (2025) · Cell Communication and Signaling · doi:10.1186/s12964-025-02199-8 · Cited by 8
Modulation of the miR-485-3p/PGC-1α Pathway by ASO-Loaded Nanoparticles Attenuates ALS Pathogenesis
Ryu, I. S., Ha, D.-I., Jung, Y.-J., Lee, H. J., Kim, I., Lim, Y. N., Min, H. S., Kim, S. H., Yoon, I., Cho, H.-J., et al. (2026) · International Journal of Molecular Sciences · doi:10.3390/ijms27020615 · Cited by 2
Metadata
- Authors
- Byrnes, A. E., Dominguez, S. L., Yen, C.-W., Laufer, B. I., Foreman, O., Reichelt, M., Lin, H., Sagolla, M., Hötzel, K., Ngu, H., Soendergaard, C., Estevez, A., Lin, H.-C., Goyon, A., Bian, J., Lin, J., Hinz, F. I., Friedman, B. A., Easton, A., & Hoogenraad, C. C.
- Venue
- Molecular Therapy - Nucleic Acids
- Publisher
- Elsevier BV
- Published
- 2023-06
- Volume
- 32
- Pages
- 773-793
- ISSN
- 2162-2531
- PMC
- PMC10280097
- Cited by
- 38
- References
- 22
- Language
- en
- Licence
- Funders
- Genentech Inc
- Roche
About these checks
Registry, retraction, Cites and statistics results are computed, not judged, with one exception: a printed reference that no index lists is read once by a model before it counts as a citation error. Claims are extracted by a model and kept only when their quote appears verbatim in the text; each cited source is then checked, with a model’s help, for whether it says what the claim relies on. Those verdicts can be wrong — read the claim’s quote and the cited source before relying on one.
Statistics and arithmetic are recomputed, not judged.
Confidence bands are shown only for fields calibrated on our annotated test set. None is calibrated yet, so no band is shown.
What counts as a claim ›How we measure confidence ›How we check this ›
Are you an author, or do you see a problem with this page? Request a review
