

The DOI matches its Crossref record; 65 of the 65 references it cites were found in a registry or an index.
PSEN1 Mutant iPSC-Derived Model Reveals Severe Astrocyte Pathology in Alzheimer's Disease
Open accessAbstract
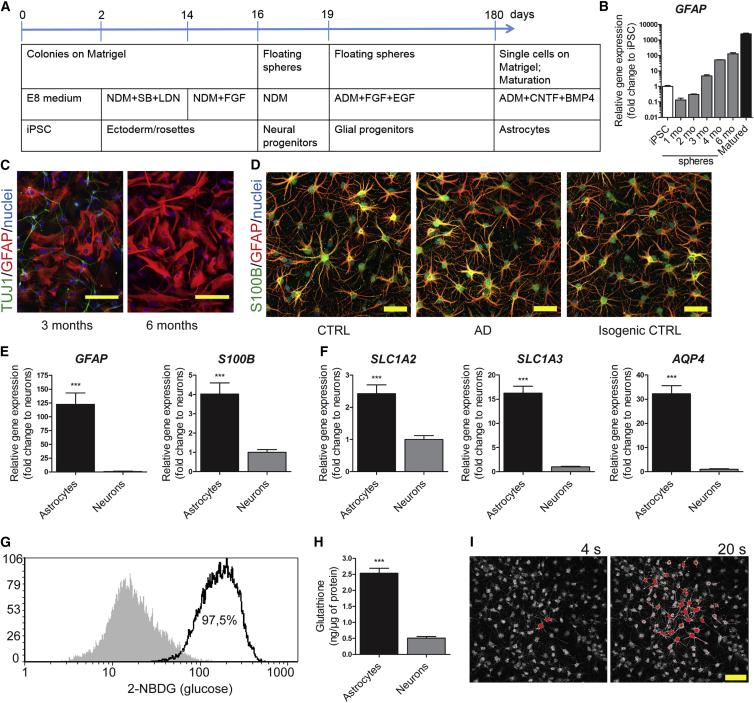
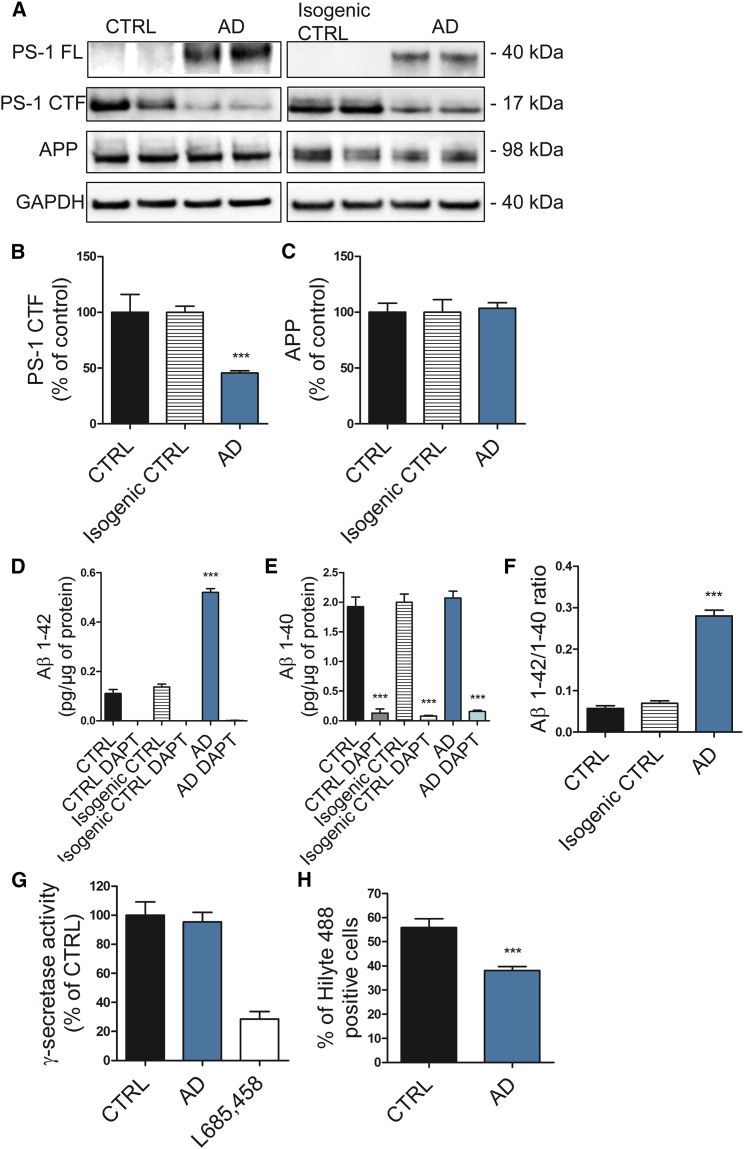
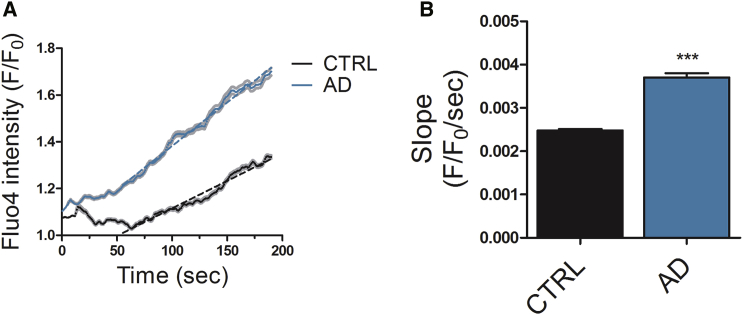
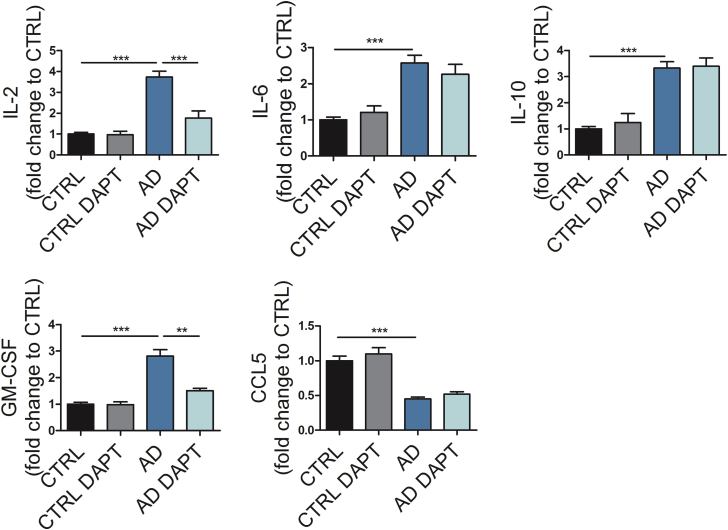
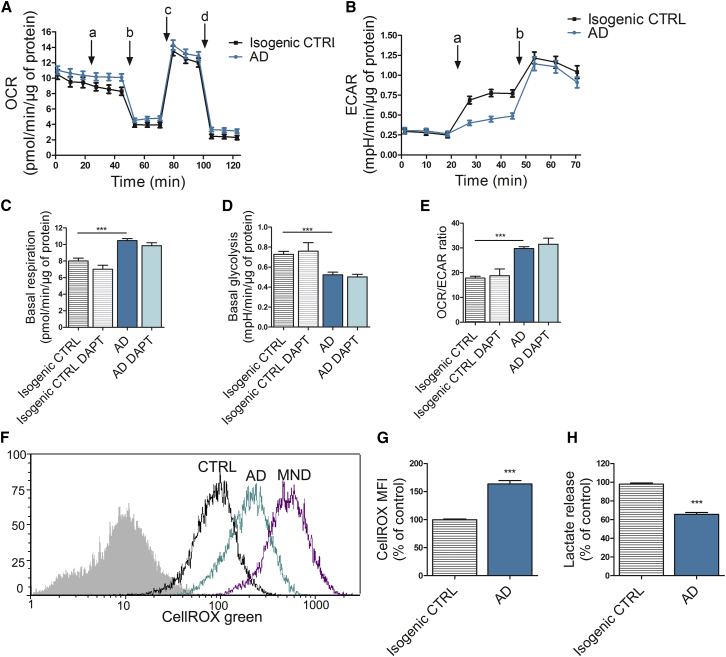
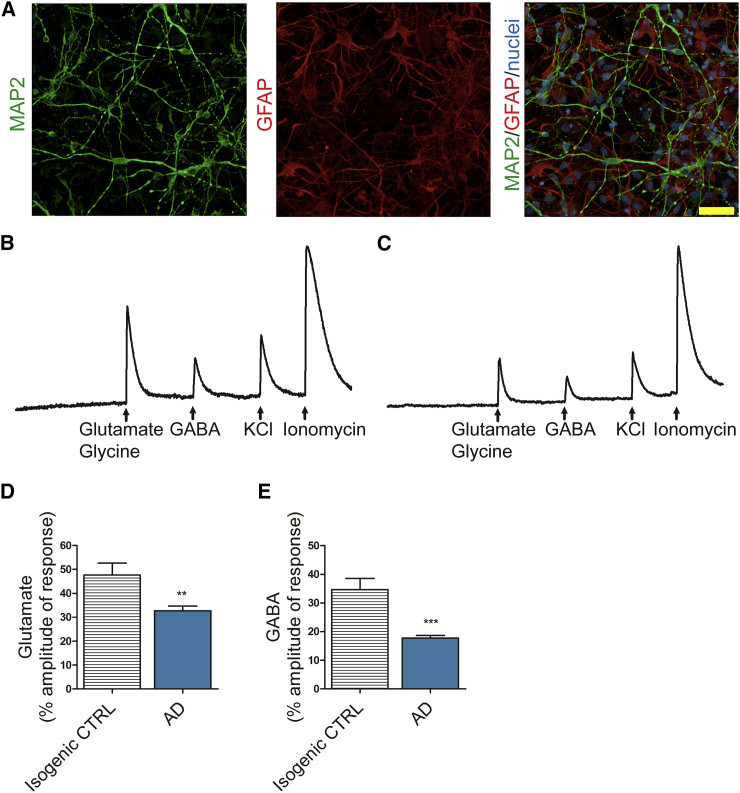
Alzheimer's disease (AD) is a common neurodegenerative disorder and the leading cause of cognitive impairment. Due to insufficient understanding of the disease mechanisms, there are no efficient therapies for AD. Most studies have focused on neuronal cells, but astrocytes have also been suggested to contribute to AD pathology. We describe here the generation of functional astrocytes from induced pluripotent stem cells (iPSCs) derived from AD patients with PSEN1 ΔE9 mutation, as well as healthy and gene-corrected isogenic controls. AD astrocytes manifest hallmarks of disease pathology, including increased β-amyloid production, altered cytokine release, and dysregulated Ca 2+ homeostasis. Furthermore, due to altered metabolism, AD astrocytes show increased oxidative stress and reduced lactate secretion, as well as compromised neuronal supportive function, as evidenced by altering Ca 2+ transients in healthy neurons. Our results reveal an important role for astrocytes in AD pathology and highlight the strength of iPSC-derived models for brain diseases.
Overview
The claims and statistics of this paper haven’t been checked yet.
Run the check — free, no account needed. It reads the open-access text and checks the sources it cites.
Integrity signals
Registry
Cites
Statistics
Figures
Verification
Claims the paper makes
The claims and statistics of this paper haven’t been checked yet.
Run the check — free, no account needed. It reads the open-access text and checks the sources it cites.
Claims other papers make about this one
Each is checked against this paper’s own text: does it say what the citing paper says it does?
The source backs part of the claim, not all of it — or backs it for a different population, condition or comparison.
In the citing paper
“In our study, the continuum of GFAF/S100B-positive cells, ranging from roundish/polarized ones to highly arborized cells, agrees with previous studies [27,28].”
From Emerging Role of miR-21-5p in Neuron–Glia Dysregulation and Exosome Transfer Using Multiple Models of Alzheimer’s Disease (2022) · cites this paper as [27]
Experimental — accuracy not yet measuredThe source backs part of the claim, not all of it — or backs it for a different population, condition or comparison.
In the citing paper
“Ast-AD revealed fewer GFAP-positive cells than S100B-positive ones, with low HMGB1 and IL-10 and elevated IL-6 and C/EBPα gene levels, already pointing to some altered properties [27,72,120].”
From Emerging Role of miR-21-5p in Neuron–Glia Dysregulation and Exosome Transfer Using Multiple Models of Alzheimer’s Disease (2022) · cites this paper as [27]
Experimental — accuracy not yet measuredThe cited source says what the claim attributes to it.
In the citing paper
“Characterization for genetic stability and pluripotency markers of these iPSCs was previously documented in studies using iPSC differentiation into astrocytes and microglia for the screening of AD-associated glial aberrancies [26,27].”
From Emerging Role of miR-21-5p in Neuron–Glia Dysregulation and Exosome Transfer Using Multiple Models of Alzheimer’s Disease (2022) · cites this paper as [27]
The cited source says what the claim attributes to it.
In the citing paper
“The cells displayed heterogeneous shapes, but mostly the stellate morphology characteristic of glial cells [27] (Figure 6B), and the astrocyte-associated GFAP and S100B markers (Figure 6C)”
From Emerging Role of miR-21-5p in Neuron–Glia Dysregulation and Exosome Transfer Using Multiple Models of Alzheimer’s Disease (2022) · cites this paper as [27]
The cited source says what the claim attributes to it.
In the citing paper
“some authors have stimulated astrocytes with TNF-α and IL-1β to make their pathological profiles more visible [27].”
From Emerging Role of miR-21-5p in Neuron–Glia Dysregulation and Exosome Transfer Using Multiple Models of Alzheimer’s Disease (2022) · cites this paper as [27]
The cited source says what the claim attributes to it.
In the citing paper
“because astrocytes are known to contribute to neuroinflammation when reactive”
From Emerging Role of miR-21-5p in Neuron–Glia Dysregulation and Exosome Transfer Using Multiple Models of Alzheimer’s Disease (2022) · cites this paper as [27]
Self-check
Percentages, sums and reported differences re-computed from the paper’s own numbers.
The self-check needs the paper’s full text.
Citations
Cites
The Amyloid Hypothesis of Alzheimer’s Disease: Progress and Problems on the Road to Therapeutics
Hardy, J., & Selkoe, D. J. (2002) · Science · doi:10.1126/science.1072994 · Cited by 13,864
Amyloid oligomers exacerbate tau pathology in a mouse model of tauopathy
Selenica, M.-L. B., Brownlow, M., Jimenez, J. P., Lee, D. C., Pena, G., Dickey, C. A., Gordon, M. N., & Morgan, D. (2013) · Neurodegenerative Diseases · doi:10.1159/000337230 · Cited by 10,359
Neuroinflammation in Alzheimer's disease
Heneka, M. T., Carson, M. J., Khoury, J. E., Landreth, G. E., Brosseron, F., Feinstein, D. L., Jacobs, A. H., Wyss-Coray, T., Vitorica, J., Ransohoff, R. M., et al. (2015) · The Lancet Neurology · doi:10.1016/s1474-4422(15)70016-5 · Cited by 6,226
Highly efficient neural conversion of human ES and iPS cells by dual inhibition of SMAD signaling
Chambers, S. M., Fasano, C. A., Papapetrou, E. P., Tomishima, M., Sadelain, M., & Studer, L. (2009) · Nature Biotechnology · doi:10.1038/nbt.1529 · Cited by 3,620
Blennow, K., de Leon, M. J., & Zetterberg, H. (2006) · The Lancet · doi:10.1016/s0140-6736(06)69113-7 · Cited by 3,134
The antibody aducanumab reduces Aβ plaques in Alzheimer’s disease
Sevigny, J., Chiao, P., Bussière, T., Weinreb, P. H., Williams, L., Maier, M., Dunstan, R., Salloway, S., Chen, T., Ling, Y., et al. (2016) · Nature · doi:10.1038/nature19323 · Cited by 3,059
Pellerin, L., & Magistretti, P. J. (1994) · Proceedings of the National Academy of Sciences · doi:10.1073/pnas.91.22.10625 · Cited by 2,927
Brain energy metabolism: focus on Astrocyte-neuron metabolic cooperation
Bélanger, M., Allaman, I., & Magistretti, P. J. (2011) · Cell Metabolism · doi:10.1016/j.cmet.2011.08.016 · Cited by 2,313
Zhang, Y., Sloan, S. A., Clarke, L. E., Caneda, C., Plaza, C. A., Blumenthal, P. D., Vogel, H., Steinberg, G. K., Edwards, M. S. B., Li, G., et al. (2016) · Neuron · doi:10.1016/j.neuron.2015.11.013 · Cited by 2,295
Oxidative Damage Is the Earliest Event in Alzheimer Disease
Nunomura, A., Perry, G., Aliev, G., Hirai, K., Takeda, A., Balraj, E. K., Jones, P. K., Ghanbari, H., Wataya, T., Shimohama, S., et al. (2001) · Journal of Neuropathology & Experimental Neurology · doi:10.1093/jnen/60.8.759 · Cited by 1,885
Cited by
Sorted by citations
Alzheimer's Disease: Treatment Strategies and Their Limitations.
Passeri, E., Elkhoury, K., Morsink, M., Broersen, K., Linder, M., Tamayol, A., Malaplate, C., Yen, F. T., & Arab-Tehrany, E. (2022) · International Journal of Molecular Sciences · doi:10.3390/ijms232213954 · Cited by 689
Functional roles of reactive astrocytes in neuroinflammation and neurodegeneration
Patani, R., Hardingham, G. E., & Liddelow, S. A. (2023) · Nature Reviews Neurology · doi:10.1038/s41582-023-00822-1 · Cited by 531
Modeling Alzheimer’s disease with iPSC-derived brain cells
Penney, J., Ralvenius, W. T., & Tsai, L.-H. (2020) · Molecular Psychiatry · doi:10.1038/s41380-019-0468-3 · Cited by 471
Astrocytes in human central nervous system diseases: a frontier for new therapies
Verkhratsky, A., Butt, A., Li, B., Illes, P., Zorec, R., Semyanov, A., Tang, Y., & Sofroniew, M. V. (2023) · Signal Transduction and Targeted Therapy · doi:10.1038/s41392-023-01628-9 · Cited by 428
Targa Dias Anastacio, H., Matosin, N., & Ooi, L. (2022) · Translational Psychiatry · doi:10.1038/s41398-022-02024-7 · Cited by 401
Metadata
- Authors
- Oksanen, M., Petersen, A. J., Naumenko, N., Puttonen, K., Lehtonen, Š., Gubert Olivé, M., Shakirzyanova, A., Leskelä, S., Sarajärvi, T., Viitanen, M., Rinne, J. O., Hiltunen, M., Haapasalo, A., Giniatullin, R., Tavi, P., Zhang, S.-C., Kanninen, K. M., Hämäläinen, R. H., & Koistinaho, J.
- Affiliations
- University of Eastern Finland (FI)
- University of Wisconsin–Madison (US)
- Karolinska University Hospital (SE)
- University of Turku (FI)
- University of Wisconsin System (US)
- ORCID
- Venue
- Stem Cell Reports
- Publisher
- Elsevier BV
- Published
- 2017-12
- Volume
- 9
- Issue
- 6
- Pages
- 1885-1897
- ISSN
- 2213-6711 (ISSN-L)
- PMC
- PMC5785689
- OpenAlex
- W2768957663
- Cited by
- 332
- References
- 65
- Citations by year
- 2026: 27 · 2025: 22 · 2024: 46 · 2023: 37 · 2022: 49 · 2021: 41 · 2020: 50 · 2019: 43 · 2018: 17
- FWCI
- 22.27
- Type
- journal article
- Language
- en
- Open access
- gold
- doi.org
- Licence
- Locations
- Stem Cell Reports (publishedVersion, cc-by-nc-nd)
- Europe PMC (PubMed Central) (publishedVersion, cc-by-nc-nd)
- PubMed Central (publishedVersion, cc-by-nc-nd)
- PubMed (publishedVersion)
- UEF eRepo (University of Eastern Finland) (submittedVersion, cc-by-nc-nd)
- UTUPub (University of Turku) (submittedVersion)
- DOAJ (DOAJ: Directory of Open Access Journals) (submittedVersion, cc-by-sa)
- Funders
- Itä-Suomen Yliopisto
- Academy of Finland
- Tekes
- Emil Aaltosen Säätiö
- Sigrid Juséliuksen Säätiö
- Horizon 2020 (643417)
- Topics
- Life Sciences › Neuroscience › Cellular and Molecular Neuroscience › Alzheimer's disease research and treatments
- Life Sciences › Biochemistry, Genetics and Molecular Biology › Molecular Biology › Pluripotent Stem Cells Research
- Life Sciences › Neuroscience › Neurology › Neuroinflammation and Neurodegeneration Mechanisms
- Keywords
- Alzheimer's disease, astrocytes, induced pluripotent stem cells, iPSC-derived astrocytes, amyloid-beta production, cytokine production, calcium homeostasis, oxidative stress, lactate secretion, disease modeling, isogenic controls
- MeSH terms
- Alzheimer Disease, Animals, Astrocytes, Brain, Calcium, Gene Expression Regulation, Humans, Mitochondria, Neurons, Amyloid beta-Peptides, Oxidative Stress, Lactic Acid, Presenilin-1, Induced Pluripotent Stem Cells
About these checks
Registry, retraction, Cites and statistics results are computed, not judged, with one exception: a printed reference that no index lists is read once by a model before it counts as a citation error. Claims are extracted by a model and kept only when their quote appears verbatim in the text; each cited source is then checked, with a model’s help, for whether it says what the claim relies on. Those verdicts can be wrong — read the claim’s quote and the cited source before relying on one.
Statistics and arithmetic are recomputed, not judged.
Confidence bands are shown only for fields calibrated on our annotated test set. None is calibrated yet, so no band is shown.
What counts as a claim ›How we measure confidence ›How we check this ›
Are you an author, or do you see a problem with this page? Request a review
