

The DOI matches its Crossref record; 48 of the 49 references it cites were found in a registry or an index.
Analysis of dementia in the US population using Medicare claims: Insights from linked survey and administrative claims data
Open accessAbstract
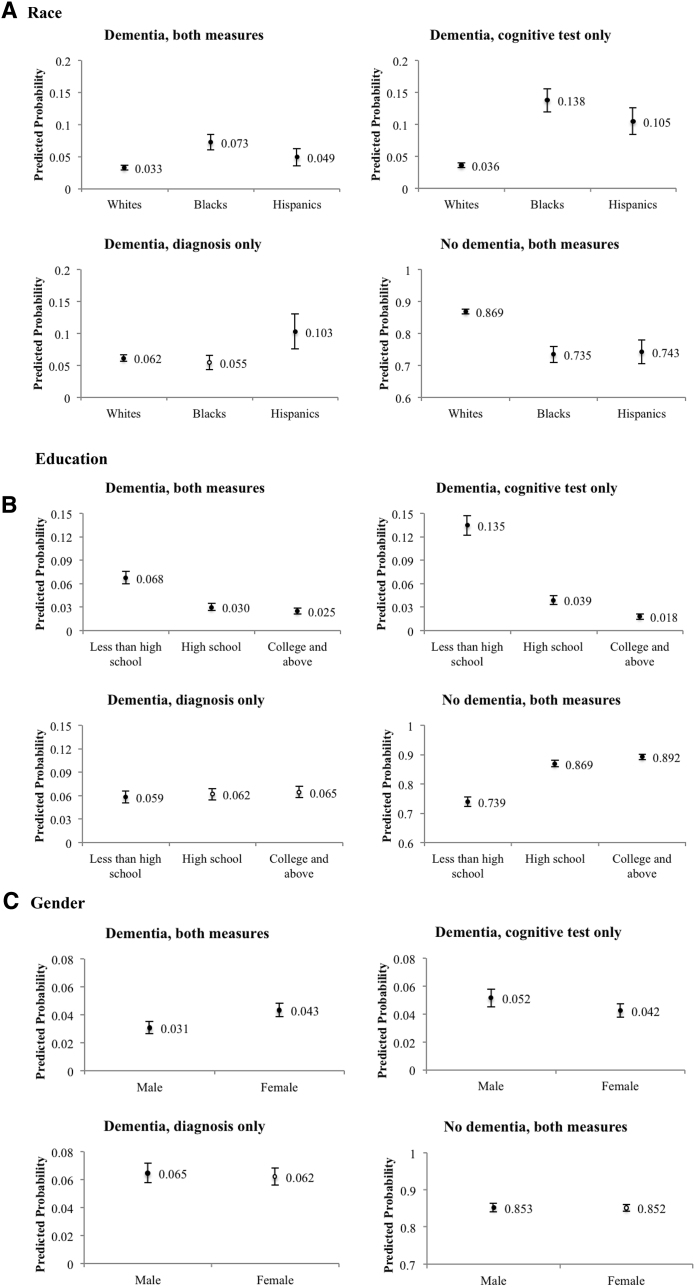
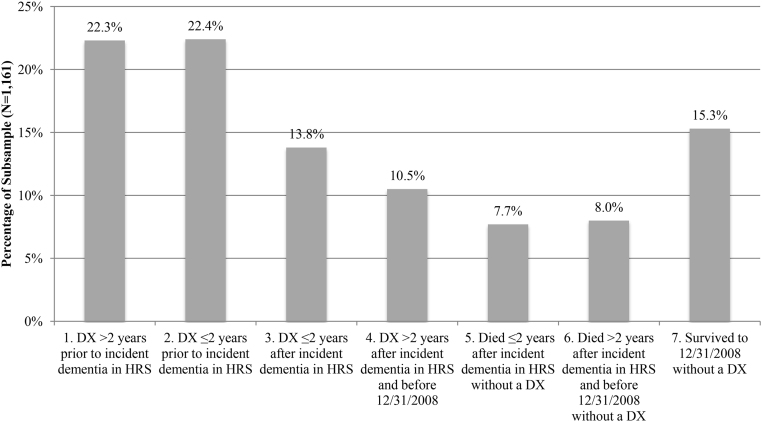
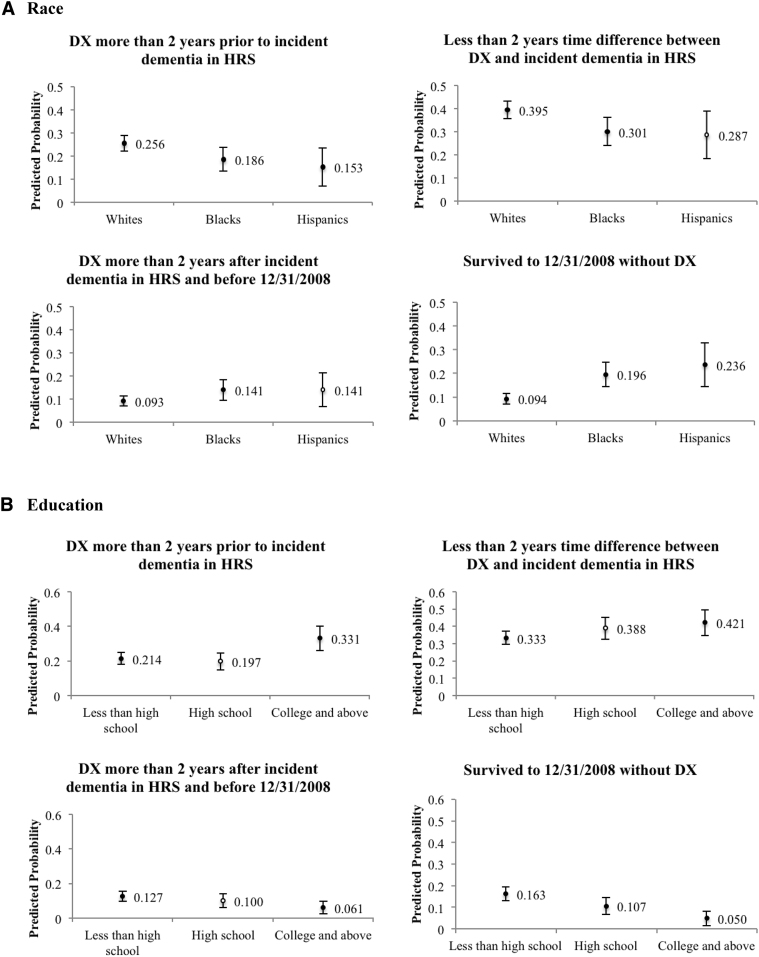
Introduction: Medicare claims data may be a rich data source for tracking population dementia rates. Insufficient understanding of completeness of diagnosis, and for whom, limits their use. Methods: We analyzed agreement in prevalent and incident dementia based on cognitive assessment from the Health and Retirement Study for persons with linked Medicare claims from 2000 to 2008 (N = 10,450 persons). Multinomial logistic regression identified sociodemographic factors associated with disagreement. Results: Survey‐based cognitive tests and claims‐based dementia diagnosis yielded equal prevalence estimates, yet only half were identified by both measures. Race and education were associated with disagreement. Eighty‐five percent of respondents with incident dementia measured by cognitive decline received a diagnosis or died within the study period, with lower odds among blacks and Hispanics than among whites. Discussions: Claims data are valuable for tracking dementia in the US population and improve over time. Delayed diagnosis may underestimate rates within black and Hispanic populations.
Overview
The claims and statistics of this paper haven’t been checked yet.
Run the check — free, no account needed. It reads the open-access text and checks the sources it cites.
Integrity signals
Registry
Cites
Statistics
Figures
Verification
Claims the paper makes
The claims and statistics of this paper haven’t been checked yet.
Run the check — free, no account needed. It reads the open-access text and checks the sources it cites.
Claims other papers make about this one
Each is checked against this paper’s own text: does it say what the citing paper says it does?
The cited source says what the claim attributes to it.
In the citing paper
“Some studies indicate that underdiagnosis is higher in Black and Hispanic older adults.”
From 2024 Alzheimer's disease facts and figures (2024) · cites this paper as [261]
Self-check
Percentages, sums and reported differences re-computed from the paper’s own numbers.
The self-check needs the paper’s full text.
Citations
Cites
Population-Based Norms for the Mini-Mental State Examination by Age and Educational Level
Crum, R. M. (1993) · JAMA · doi:10.1001/jama.1993.03500180078038 · Cited by 2,958
Crimmins, E. M., Kim, J. K., Langa, K. M., & Weir, D. R. (2011) · The Journals of Gerontology Series B · doi:10.1093/geronb/gbr048 · Cited by 1,062
Self-citationClinical epidemiology of Alzheimer’s disease: assessing sex and gender differences
Mielke, M., Vemuri, P., & Rocca, W. (2014) · Clinical Epidemiology · doi:10.2147/clep.s37929 · Cited by 1,021
Missed and Delayed Diagnosis of Dementia in Primary Care: Prevalence and Contributing Factors
Bradford, A., Kunik, M. E., Schulz, P., Williams, S. P., & Singh, H. (2009) · Alzheimer Disease & Associated Disorders · doi:10.1097/wad.0b013e3181a6bebc · Cited by 969
A Comparison of the Prevalence of Dementia in the United States in 2000 and 2012
Langa, K. M., Larson, E. B., Crimmins, E. M., Faul, J. D., Levine, D. A., Kabeto, M. U., & Weir, D. R. (2017) · JAMA Internal Medicine · doi:10.1001/jamainternmed.2016.6807 · Cited by 910
Self-citationCognitive Reserve and Alzheimer Disease
Stern, Y. (2006) · Alzheimer Disease & Associated Disorders · doi:10.1097/01.wad.0000213815.20177.19 · Cited by 838
Incidence of AD in African-Americans, Caribbean Hispanics, and Caucasians in northern Manhattan
Tang, M. ‐., Cross, P. S., Andrews, H., Jacobs, D. M., Small, S. A., Bell, K., Merchant, C., Lantigua, R., Costa, R., Stern, Y., et al. (2001) · Neurology · doi:10.1212/wnl.56.1.49 · Cited by 721
Gender differences in the incidence of AD and vascular dementia: The EURODEM Studies
Andersen, K., Launer, L. J., Dewey, M. E., Letenneur, L., Ott, A., Copeland, J. R. M., Dartigues, J.-F., Kragh–Sorensen, P., Baldereschi, M., Brayne, C., et al. (1999) · Neurology · doi:10.1212/wnl.53.9.1992 · Cited by 650
Rate of memory decline in AD is related to education and occupation: Cognitive reserve?
Stern, Y., Albert, S., Tang, M.-X., & Tsai, W.-Y. (1999) · Neurology · doi:10.1212/wnl.53.9.1942 · Cited by 557
The Detection of Dementia in the Primary Care Setting
Valcour, V., Masaki, K., Curb, J. D., & Blanchette, P. L. (2000) · Archives of Internal Medicine · doi:10.1001/archinte.160.19.2964 · Cited by 507
Research works printed but not linked: 1
- 10.1097/00002093-200607001-00010 · DOI · Paper page
Cited by
Sorted by citations
2024 Alzheimer's disease facts and figures
(2024) · Alzheimer's & Dementia · doi:10.1002/alz.13809 · Cited by 2,536
2025 Alzheimer's disease facts and figures
(2025) · Alzheimer s & Dementia · doi:10.1002/alz.70235 · Cited by 642
Impact of dementia: Health disparities, population trends, care interventions, and economic costs
Aranda, M., Kremer, I. N., Hinton, L., Zissimopoulos, J., Whitmer, R. A., Hummel, C. H., Trejo, L., & Fabius, C. D. (2021) · Journal of the American Geriatrics Society · doi:10.1111/jgs.17345 · Cited by 430
Self-citationDementia Diagnosis Disparities by Race and Ethnicity
Lin, P.-J., Daly, A. T., Olchanski, N., Cohen, J. T., Neumann, P. J., Faul, J. D., Fillit, H. M., & Freund, K. M. (2021) · Medical Care · doi:10.1097/mlr.0000000000001577 · Cited by 239
Validation of Claims Algorithms to Identify Alzheimer’s Disease and Related Dementias
McCarthy, E. P., Chang, C., Tilton, N., Kabeto, M. U., Langa, K. M., & Bynum, J. (2021) · The Journals of Gerontology Series A · doi:10.1093/gerona/glab373 · Cited by 150
Grodstein, F., Chang, C.-H., Capuano, A. W., Power, M. C., Marquez, D. X., Barnes, L. L., Bennett, D. A., James, B. D., & Bynum, J. P. W. (2022) · The Journals of Gerontology: Series A · doi:10.1093/gerona/glab377 · Cited by 132
Can Hearing Aids Delay Time to Diagnosis of Dementia, Depression, or Falls in Older Adults?
Mahmoudi, E., Basu, T., Langa, K. M., McKee, M. M., Zazove, P., Alexander, N. B., & Kamdar, N. S. (2019) · Journal of the American Geriatrics Society · doi:10.1111/jgs.16109 · Cited by 123
Identifying Medicare beneficiaries with dementia
Moura, L. M. V. R., Festa, N., Price, M., Volya, M., Benson, N. M., Zafar, S. F., Weiss, M., Blacker, D., Normand, S. T., Newhouse, J. P., et al. (2021) · Journal of the American Geriatrics Society · doi:10.1111/jgs.17183 · Cited by 98
Mapping racial and ethnic healthcare disparities for persons living with dementia: A scoping review
Hinton, L., Tran, D., Peak, K., Meyer, O. L., & Quiñones, A. R. (2024) · Alzheimer s & Dementia · doi:10.1002/alz.13612 · Cited by 95
Dhana, K., Beck, T., Desai, P., Wilson, R. S., Evans, D. A., & Rajan, K. B. (2023) · Alzheimer's & Dementia · doi:10.1002/alz.13081 · Cited by 90
Pharmaceutical Treatment for Alzheimer’s Disease and Related Dementias: Utilization and Disparities
Barthold, D., Joyce, G., Ferido, P., Drabo, E. F., Marcum, Z. A., Gray, S. L., & Zissimopoulos, J. (2020) · Journal of Alzheimer s Disease · doi:10.3233/jad-200133 · Cited by 85
Self-citationSuicide risk in first year after dementia diagnosis in older adults
Schmutte, T. J., Olfson, M., Maust, D. T., Xie, M., & Marcus, S. C. (2021) · Alzheimer s & Dementia · doi:10.1002/alz.12390 · Cited by 82
Jacobson, M., Thunell, J. A., & Zissimopoulos, J. (2020) · Health Affairs · doi:10.1377/hlthaff.2019.01795 · Cited by 77
Self-citationSex, Race, and Age Differences in Prevalence of Dementia in Medicare Claims and Survey Data
Zhu, Y., Chen, Y., Crimmins, E. M., & Zissimopoulos, J. (2020) · The Journals of Gerontology Series B · doi:10.1093/geronb/gbaa083 · Cited by 72
Self-citationLin, P.-J., Zhu, Y., Olchanski, N., Cohen, J. T., Neumann, P. J., Faul, J. D., Fillit, H. M., & Freund, K. M. (2022) · JAMA Network Open · doi:10.1001/jamanetworkopen.2022.16260 · Cited by 71
Chen, Z., Ho, M. M., & Chau, P. H. (2022) · Journal of Cachexia Sarcopenia and Muscle · doi:10.1002/jcsm.12933 · Cited by 70
Lim, U., Wang, S., Park, S., Bogumil, D. D., Wu, A. H., Cheng, I. C., Haiman, C. A., Marchand, L. L., Wilkens, L. R., White, L. R., et al. (2021) · Alzheimer s & Dementia · doi:10.1002/alz.12528 · Cited by 69
Gillis, C., Montenigro, P. H., Nejati, M., & Maserejian, N. N. (2022) · Alzheimer s & Dementia · doi:10.1002/alz.12822 · Cited by 51
Charpignon, M., Vakulenko‐Lagun, B., Zheng, B., Magdamo, C., Su, B., Evans, K. E., Rodriguez, S., Sokolov, A., Boswell, S. A., Sheu, Y.-H., et al. (2022) · Nature Communications · doi:10.1038/s41467-022-35157-w · Cited by 56
Racial and Ethnic Differences in Knowledge About One's Dementia Status
Lin, P., Emerson, J. G., Faul, J. D., Cohen, J. T., Neumann, P. J., Fillit, H. M., Daly, A. T., Margaretos, N. M., & Freund, K. M. (2020) · Journal of the American Geriatrics Society · doi:10.1111/jgs.16442 · Cited by 47
White, L. L. Y., Ingraham, B. C., Larson, E. B., Fishman, P. A., Park, S., & Coe, N. B. (2021) · Journal of General Internal Medicine · doi:10.1007/s11606-021-07169-7 · Cited by 50
Time to dementia diagnosis by race: A retrospective cohort study
Davis, M. A., Lee, K. A., Harris, M., Ha, J., Langa, K. M., Bynum, J., & Hoffman, G. J. (2022) · Journal of the American Geriatrics Society · doi:10.1111/jgs.18078 · Cited by 40
2026 Alzheimer's disease facts and figures
(2026) · Alzheimer s & Dementia · doi:10.1002/alz.71345 · Cited by 69
Yang, J. J., Keohane, L. M., Pan, X.-F., Qu, R., Shu, X.-O., Lipworth, L., Braun, K., Steinwandel, M. D., Dai, Q., Shrubsole, M., et al. (2022) · Neurology · doi:10.1212/wnl.0000000000200774 · Cited by 39
Cognitive measures lacking in EHR prior to dementia or Alzheimer's disease diagnosis
Maserejian, N. N., Krzywy, H., Eaton, S., & Galvin, J. E. (2021) · Alzheimer s & Dementia · doi:10.1002/alz.12280 · Cited by 36
Correlates of missed or late versus timely diagnosis of dementia in healthcare settings
Chen, Y., Power, M. C., Grodstein, F., Capuano, A. W., Lange‐Maia, B. S., Moghtaderi, A., Stapp, E. K., Bhattacharyya, J., Shah, R. C., Barnes, L. L., et al. (2024) · Alzheimer s & Dementia · doi:10.1002/alz.14067 · Cited by 38
Self-citationMedicare spending associated with a dementia diagnosis among older adults
Hoffman, G. J., Maust, D. T., Harris, M., Ha, J., & Davis, M. A. (2022) · Journal of the American Geriatrics Society · doi:10.1111/jgs.17835 · Cited by 35
Rawat, P., Sehar, U., Bisht, J., Reddy, A. P., & Reddy, P. H. (2023) · Ageing Research Reviews · doi:10.1016/j.arr.2023.102178 · Cited by 36
Park, S.-Y., Setiawan, V. W., Crimmins, E. M., White, L. R., Wu, A. H., Cheng, I., Darst, B. F., Haiman, C. A., Wilkens, L. R., Le Marchand, L., et al. (2024) · Neurology · doi:10.1212/wnl.0000000000208116 · Cited by 33
Self-citationChen, Y., Crimmins, E. M., Ferido, P., & Zissimopoulos, J. (2022) · The Lancet Regional Health - Americas · doi:10.1016/j.lana.2021.100179 · Cited by 33
Self-citationMedicare's Annual Wellness Visit and diagnoses of dementias and cognitive impairment
Thunell, J. A., Jacobson, M., Joe, E., & Zissimopoulos, J. (2022) · Alzheimer s & Dementia Diagnosis Assessment & Disease Monitoring · doi:10.1002/dad2.12357 · Cited by 32
Self-citationMcGrath, R., Robinson‐Lane, S. G., Clark, B. C., Suhr, J. A., Giordani, B., & Vincent, B. M. (2021) · Journal of Alzheimer s Disease · doi:10.3233/jad-201212 · Cited by 31
Patients living with dementia have worse outcomes when undergoing high‐risk procedures
Shah, S. K., Adler, R., Xiang, L., Clark, C. J., Cooper, Z. R., Finlayson, E. V. A., Kim, D. H., Lin, K. J., Lipsitz, S. R., & Weissman, J. S. (2022) · Journal of the American Geriatrics Society · doi:10.1111/jgs.17893 · Cited by 32
Zacher, M. L., Brady, S., & Short, S. E. (2023) · The Journals of Gerontology Series B · doi:10.1093/geronb/gbad045 · Cited by 30
Out‐of‐pocket costs attributable to dementia: A longitudinal analysis
Oney, M., White, L., & Coe, N. B. (2022) · Journal of the American Geriatrics Society · doi:10.1111/jgs.17746 · Cited by 29
Diagnosed prevalence of Alzheimer's disease and related dementias in Medicare Advantage plans
Jutkowitz, E., Bynum, J., Mitchell, S. L., Cocoros, N. M., Shapira, O., Haynes, K., Nair, V. P., McMahill‐Walraven, C. N., Platt, R. G., & McCarthy, E. P. (2020) · Alzheimer s & Dementia Diagnosis Assessment & Disease Monitoring · doi:10.1002/dad2.12048 · Cited by 29
Trends in US Medicare Decedents’ Diagnosis of Dementia From 2004 to 2017
Davis, M. A., Chang, C.-H., Simonton, S., & Bynum, J. P. W. (2022) · JAMA Health Forum · doi:10.1001/jamahealthforum.2022.0346 · Cited by 28
Noori, A., Magdamo, C., Liu, X., Tyagi, T., Li, Z., Kondepudi, A., Alabsi, H. S., Rudmann, E. A., Wilcox, D. R., Brenner, L. N., et al. (2022) · Journal of Medical Internet Research · doi:10.2196/40384 · Cited by 26
Associations between dementia diagnosis and end‐of‐life care utilization
Luth, E. A., Manful, A., Prigerson, H. G., Xiang, L., Reich, A. J., Semco, R. S., & Weissman, J. S. (2022) · Journal of the American Geriatrics Society · doi:10.1111/jgs.17952 · Cited by 28
Using Medicare claims in identifying Alzheimer's disease and related dementias
Jain, S., Rosenbaum, P. R., Reiter, J. G., Hoffman, G. J., Small, D. S., Ha, J., Hill, A. S., Wolk, D. A., Gaulton, T. G., Neuman, M. D., et al. (2020) · Alzheimer s & Dementia · doi:10.1002/alz.12199 · Cited by 26
Grossman, H. T., Sano, M. C., Aloysi, A. S., Elder, G. A., Neugroschl, J. A., Schimming, C., Soleimani, L., & Zhu, C. W. (2021) · Alzheimer s & Dementia Diagnosis Assessment & Disease Monitoring · doi:10.1002/dad2.12169 · Cited by 32
Regional variation in U.S dementia trends from 2000-2012
Ailshire, J., Walsemann, K. M., & Fisk, C. E. (2022) · SSM - Population Health · doi:10.1016/j.ssmph.2022.101164 · Cited by 25
Qian, Y., Chen, X., Tang, D., Kelley, A. S., & Li, J. (2021) · The Journals of Gerontology: Series A · doi:10.1093/gerona/glab043 · Cited by 23
Bhattacharyya, J., Barnes, L. L., Chen, Y., Gianattasio, K. Z., Grodstein, F., James, B. D., Márquez, D. X., Moghtaderi, A., Prather, C. P., Rein, D. B., et al. (2025) · Alzheimer s & Dementia · doi:10.1002/alz.70200 · Cited by 26
Self-citationImplications of the Use of Algorithmic Diagnoses or Medicare Claims to Ascertain Dementia
Power, M. C., Gianattasio, K. Z., & Ciarleglio, A. (2020) · Neuroepidemiology · doi:10.1159/000510753 · Cited by 21
Benzodiazepine use and the risk of dementia
Joyce, G., Ferido, P., Thunell, J. A., Tysinger, B., & Zissimopoulos, J. (2022) · Alzheimer s & Dementia Translational Research & Clinical Interventions · doi:10.1002/trc2.12309 · Cited by 26
Self-citationBynum, J., Benloucif, S., Martindale, J., O’Malley, A. J., & Davis, M. A. (2024) · Alzheimer s & Dementia · doi:10.1002/alz.14092 · Cited by 23
Blass, B., Ford, C. B., Soneji, S. S., Zepel, L., Rosa, T. D., Kaufman, B. G., Mantri, S., Fan, L., Grory, B. M., Xian, Y., et al. (2025) · BMJ · doi:10.1136/bmj-2024-083034 · Cited by 24
Jacobson, M., Ferido, P., & Zissimopoulos, J. (2023) · Journal of the American Geriatrics Society · doi:10.1111/jgs.18570 · Cited by 21
Self-citationBeydoun, M. A., Weiss, J., Beydoun, H. A., Kuczmarski, M. F., Hossain, S. A., El‐Hajj, Z. W., Evans, M. K., & Zonderman, A. B. (2022) · Alzheimer s & Dementia Translational Research & Clinical Interventions · doi:10.1002/trc2.12275 · Cited by 19
Doblhammer, G., Fritze, T., Reinke, C., & Fink, A. (2022) · Journal of Population Ageing · doi:10.1007/s12062-022-09365-7 · Cited by 18
Yan, D., Wang, S., Temkin‐Greener, H., & Cai, S. (2021) · Journal of Applied Gerontology · doi:10.1177/07334648211048187 · Cited by 17
How good are medical and death records for identifying dementia?
Schliep, K. C., Ju, S., Foster, N. L., Smith, K. R., Varner, M. W., Østbye, T., & Tschanz, J. T. (2021) · Alzheimer s & Dementia · doi:10.1002/alz.12526 · Cited by 17
Life-Sustaining Treatments Among Medicare Beneficiaries with and without Dementia at the End of Life
Zhu, Y., Olchanski, N., Cohen, J. T., Freund, K. M., Faul, J. D., Fillit, H. M., Neumann, P. J., & Lin, P.-J. (2023) · Journal of Alzheimer’s Disease · doi:10.3233/jad-230692 · Cited by 16
Dinesh, D., Shao, Q., Palnati, M., McDannold, S. E., Zhang, Q., Monfared, A. A. T., Jasuja, G. K., Davila, H. W., Xia, W., Moo, L. R., et al. (2023) · Alzheimer s & Dementia · doi:10.1002/alz.13071 · Cited by 17
Zhu, C. W., Schneider, L. S., Elder, G. A., Soleimani, L., Grossman, H., Aloysi, A., Schimming, C., & Sano, M. (2024) · The American journal of geriatric psychiatry · doi:10.1016/j.jagp.2024.06.005 · Cited by 15
Rakuša, E., Fink, A., Tamgüney, G., Heneka, M. T., & Doblhammer, G. (2023) · Journal of Alzheimer s Disease · doi:10.3233/jad-221153 · Cited by 14
Keohane, L. M., Nikpay, S., Braun, K., Cheng, A. K., Stevenson, D. G., Buntin, M. B., Yu, D., Blot, W. J., & Lipworth, L. P. (2022) · Journal of Applied Gerontology · doi:10.1177/07334648221142851 · Cited by 14
Potentially Inappropriate Medication Use in Community-Dwelling Older Adults Living with Dementia
Bae‐Shaaw, Y. H., Shier, V., Sood, N., Seabury, S. A., & Joyce, G. (2023) · Journal of Alzheimer s Disease · doi:10.3233/jad-221168 · Cited by 15
The importance of education for understanding variability of dementia onset in the United States
Cha, H., Farina, M. P., Chiu, C., & Hayward, M. D. (2024) · Demographic Research · doi:10.4054/demres.2024.50.26 · Cited by 14
Luth, E. A., Pan, C. X., Viola, M., & Prigerson, H. G. (2021) · American Journal of Hospice and Palliative Medicine® · doi:10.1177/1049909121989020 · Cited by 12
Kreft, D., & Doblhammer, G. (2022) · Journal of Alzheimer s Disease · doi:10.3233/jad-215030 · Cited by 12
Grodstein, F., James, B. D., Chen, Y., Capuano, A. W., Power, M. C., Bennett, D. A., Bynum, J. P. W., & Barnes, L. L. (2024) · The Journals of Gerontology: Series A · doi:10.1093/gerona/glad235 · Cited by 11
Self-citationPark, S., Setiawan, V. W., Crimmins, E. M., White, L. R., Haiman, C. A., Wilkens, L. R., Marchand, L. L., & Lim, U. (2025) · American Journal of Clinical Nutrition · doi:10.1016/j.ajcnut.2025.07.020 · Cited by 11
Self-citationGotanda, H., Zhang, J. J., Reuben, D. B., Walling, A. M., Xu, H., Jena, A. B., Gross, N., & Tsugawa, Y. (2023) · Journal of the American Geriatrics Society · doi:10.1111/jgs.18510 · Cited by 11
Dementia severity at incident diagnosis in a population representative sample of older Americans
Xu, S., Nashta, N. F., Chen, Y., & Zissimopoulos, J. (2024) · Alzheimer s & Dementia Translational Research & Clinical Interventions · doi:10.1002/trc2.12491 · Cited by 11
Self-citationHua, C. L., Thomas, K. S., Bunker, J., Gozalo, P. L., Bélanger, E., Mitchell, S. L., & Teno, J. M. (2021) · Journal of the American Geriatrics Society · doi:10.1111/jgs.17564 · Cited by 11
Olchanski, N., Zhu, Y., Liang, L., Cohen, J. T., Faul, J. D., Fillit, H. M., Freund, K. M., & Lin, P. (2024) · Journal of the American Geriatrics Society · doi:10.1111/jgs.18822 · Cited by 10
Estimating prevalence of early symptomatic Alzheimer's disease in the United States
Spargo, D., Zur, R., Lin, P., Synnott, P., Klein, E., & Hartry, A. (2023) · Alzheimer's & Dementia: Diagnosis, Assessment & Disease Monitoring · doi:10.1002/dad2.12497 · Cited by 9
Bélanger, E., Rosendaal, N. T. A., Gutman, R., Lake, D. T., Santostefano, C. M., Meyers, D. J., & Gozalo, P. L. (2023) · Journal of the American Geriatrics Society · doi:10.1111/jgs.18487 · Cited by 9
Coe, N. B., Miller, K. E. M., Sun, C., Taggert, E., Gross, A. L., Jones, R. N., Felix, C., Albert, M., Rebok, G. W., Marsiske, M., et al. (2026) · Alzheimer s & Dementia Translational Research & Clinical Interventions · doi:10.1002/trc2.70197 · Cited by 10
Barriers to seeking care for memory problems: A vignette study
Jacobson, M., Joe, E., & Zissimopoulos, J. (2022) · Alzheimer s & Dementia Translational Research & Clinical Interventions · doi:10.1002/trc2.12238 · Cited by 9
Self-citationA multinational cohort study of trends in survival following dementia diagnosis
Luo, H., Koponen, M., Roethlein, C., Becker, C., Bell, J. S., Beyene, K. A., Chai, Y., Chan, A. H. Y., Chui, C. S. L., Haenisch, B., et al. (2025) · Communications Medicine · doi:10.1038/s43856-025-00923-6 · Cited by 10
Beam, C. R., Luczak, S. E., Panizzon, M. S., Reynolds, C. A., Christensen, K., Aslan, A. K. D., Elman, J. A., Franz, C. E., Kremen, W. S., Lee, T., et al. (2022) · Journal of Alzheimer s Disease · doi:10.3233/jad-220472 · Cited by 8
Deardorff, W. J., Diaz‐Ramirez, L. G., Boscardin, W. J., Smith, A. K., & Lee, S. J. (2023) · Journal of the American Geriatrics Society · doi:10.1111/jgs.18704 · Cited by 8
Cognitive activity at work and the risk of dementia
Martin‐Bassols, N., de New, S. C., Johnston, D. W., & Shields, M. A. (2023) · Health Economics · doi:10.1002/hec.4679 · Cited by 7
Chyr, L., Wolff, J. L., Zissimopoulos, J., & Drabo, E. F. (2024) · Alzheimer s & Dementia · doi:10.1002/alz.13758 · Cited by 7
Self-citationCharpignon, M., Vakulenko‐Lagun, B., Zheng, B., Magdamo, C., Su, B., Evans, K. E., Rodriguez, S., Sokolov, A., Boswell, S. A., Sheu, Y.-H., et al. (2021) · medRxiv · doi:10.1101/2021.08.10.21261747 · Cited by 7
Haye, S., Jacobson, M., Joyce, G., & Zissimopoulos, J. (2025) · Health Affairs · doi:10.1377/hlthaff.2024.00723 · Cited by 6
Self-citationUsing dynamic microsimulation to project cognitive function in the elderly population
Wei, Y., Heun‐Johnson, H., & Tysinger, B. (2022) · PLoS ONE · doi:10.1371/journal.pone.0274417 · Cited by 6
Self-citationZhu, C. W., Gu, Y., Cosentino, S., Kociolek, A. J., Hernandez, M., & Stern, Y. (2023) · Journal of Alzheimer s Disease · doi:10.3233/jad-230584 · Cited by 6
Rebok, G. W., Gellert, A. R., Coe, N. B., Clay, O. J., Wallace, G., Parisi, J. M., Aiken‐Morgan, A. T., Crowe, M. G., Ball, K., Thorpe, R. J., et al. (2023) · Journal of Aging and Health · doi:10.1177/08982643231203755 · Cited by 6
Arellanes, I., Mirsafian, L., Wang, Y., & Jacobson, M. (2024) · Journal of the American Geriatrics Society · doi:10.1111/jgs.18958 · Cited by 6
Cognitive impairment among medicare home health patients: comparing available measures
Burgdorf, J. G., & Amjad, H. (2021) · Home Health Care Services Quarterly · doi:10.1080/01621424.2021.2009392 · Cited by 6
Gallini, A., Jegou, D., Lapeyre‐Mestre, M., Couret, A., Bourrel, R., Ousset, P., Fabre, D., Andrieu, S., & Gardette, V. (2021) · Current Alzheimer Research · doi:10.2174/1567205018666210416094639 · Cited by 6
Thunell, J. A., Ferido, P., & Zissimopoulos, J. (2023) · Journal of the American Geriatrics Society · doi:10.1111/jgs.18230 · Cited by 6
Self-citationKarway, G. K., Krzyzanowski, B., Killion, J. A., Faust, I. M., Laurido-Soto, O., Sabbagh, M. N., & Racette, B. A. (2025) · Alzheimer s & Dementia · doi:10.1002/alz.70199 · Cited by 7
Sheets, K. M., Fink, H. A., Langsetmo, L., Kats, A. M., Schousboe, J. T., Yaffe, K. S., & Ensrud, K. E. (2025) · The Journals of Gerontology Series A · doi:10.1093/gerona/glaf030 · Cited by 7
Hua, C. L., Thomas, K. S., Bunker, J., Gozalo, P. L., & Teno, J. M. (2021) · Journal of the American Geriatrics Society · doi:10.1111/jgs.17201 · Cited by 4
Trends in antipsychotic prescribing among community-dwelling older adults with dementia, 2010-2018
Yang, A. W., Leng, M., Arbanas, J. C., Tseng, C., Fendrick, A. M., Sarkisian, C. A., Damberg, C. L., Harawa, N. T., & Mafi, J. N. (2025) · Health Affairs Scholar · doi:10.1093/haschl/qxaf021 · Cited by 3
The financial consequences of undiagnosed memory disorders
Gresenz, C. R., Mitchell, J. M., Rodriguez, B., Wang, C., Turner, R. S., & van der Klaauw, W. (2025) · Journal of Financial Economics · doi:10.1016/j.jfineco.2025.104149 · Cited by 8
Characterizing financial risk from out‐of‐pocket expenditures across dementia stages
Synnott, P. G., Zhu, Y., Rodday, A. M., & Lin, P. (2025) · Alzheimer s & Dementia · doi:10.1002/alz.70666 · Cited by 3
Chen, Y., Chen, A., Power, M. C., Grodstein, F., Kapasi, A., Capuano, A. W., Lange‐Maia, B. S., Moghtaderi, A., Stapp, E. K., Bhattacharyya, J., et al. (2026) · Neurology · doi:10.1212/wnl.0000000000218352 · Cited by 3
Self-citationFaktor yang Berhubungan dengan Kejadian Demensia : Literature Review
Adwinda, R. N., & Syahrul, F. (2023) · Media Publikasi Promosi Kesehatan Indonesia (MPPKI) · doi:10.56338/mppki.v6i1.2856 · Cited by 3
Knox, S., Aghamoosa, S., Heider, P. M., Cutty, M. E., Wright, A., Scherbakov, D., Hood, G., Nolin, S. A., & Obeid, J. S. (2025) · Alzheimer s & Dementia Translational Research & Clinical Interventions · doi:10.1002/trc2.70089 · Cited by 5
Regional differences in the incidence of Alzheimer’s disease and related dementias in South Carolina
Amoatika, D. A., Miller, M. C., Adams, R. J., & Milano, N. J. (2025) · Frontiers in Neurology · doi:10.3389/fneur.2025.1584127 · Cited by 3
Effects of Medicare predictors in health disparities in the risk of Alzheimer's disease
Akushevich, I. V., Yashkin, A. P., & Kravchenko, J. S. (2025) · Alzheimer s & Dementia Translational Research & Clinical Interventions · doi:10.1002/trc2.70078 · Cited by 2
Zhang, J. J., Reuben, D. B., Walling, A. M., Zingmond, D. S., Damberg, C. L., Wenger, N. S., Xu, H., Ikesu, R., Kaneshiro, G. S., Klomhaus, A. M., et al. (2025) · JAMA Health Forum · doi:10.1001/jamahealthforum.2025.0731 · Cited by 2
Faul, J. D., Collins, S. D., Smith, T., Klopack, E. T., Mitchell, C. M., Crimmins, E. M., & Farina, M. P. (2026) · Clinical Epigenetics · doi:10.1186/s13148-026-02142-9 · Cited by 6
Self-citationThe cost of dementia in the United States in 2026
Thunell, J. A., Tysinger, B., Baumgart, M., Carrillo, M., Crimmins, E. M., Goldman, D. P., Heun‐Johnson, H., Jacobson, M., Joyce, G., Leaf, D. E., et al. (2026) · Alzheimer s & Dementia · doi:10.1002/alz.71480 · Cited by 2
Self-citation
Metadata
- Authors
- Chen, Y., Tysinger, B., Crimmins, E., & Zissimopoulos, J. M.
- Affiliations
- University of Southern California (US)
- Corresponding author
- Zissimopoulos, Julie M.
- Venue
- Alzheimer's & Dementia: Translational Research & Clinical Interventions
- Publisher
- Wiley
- Published
- 2019-01
- Volume
- 5
- Issue
- 1
- Pages
- 197-207
- ISSN
- 2352-8737 (ISSN-L)
- PMC
- PMC6556828
- OpenAlex
- W2954918532
- Cited by
- 129
- References
- 49
- Citations by year
- 2026: 19 · 2025: 22 · 2024: 17 · 2023: 19 · 2022: 24 · 2021: 20 · 2020: 7 · 2019: 1
- FWCI
- 10.36
- Type
- journal article
- Language
- en
- Open access
- gold
- doi.org
- Licence
- Locations
- Alzheimer s & Dementia Translational Research & Clinical Interventions (publishedVersion, cc-by-nc-nd)
- PubMed Central (publishedVersion, cc-by-nc-nd)
- PubMed (publishedVersion)
- DOAJ (DOAJ: Directory of Open Access Journals) (submittedVersion)
- Funders
- National Institutes of Health
- National Institute on Aging (1R01AG055401)
- Topics
- Health Sciences › Medicine › Psychiatry and Mental health › Dementia and Cognitive Impairment Research
- Health Sciences › Health Professions › Health Information Management › Medical Coding and Health Information
- Social Sciences › Economics, Econometrics and Finance › Economics and Econometrics › Health Systems, Economic Evaluations, Quality of Life
- Keywords
- dementia, Medicare claims data, prevalence estimates, incident dementia, cognitive assessment, Health and Retirement Study, racial disparities, Hispanic population, Black population, delayed diagnosis, sociodemographic factors
About these checks
Registry, retraction, Cites and statistics results are computed, not judged, with one exception: a printed reference that no index lists is read once by a model before it counts as a citation error. Claims are extracted by a model and kept only when their quote appears verbatim in the text; each cited source is then checked, with a model’s help, for whether it says what the claim relies on. Those verdicts can be wrong — read the claim’s quote and the cited source before relying on one.
Statistics and arithmetic are recomputed, not judged.
Confidence bands are shown only for fields calibrated on our annotated test set. None is calibrated yet, so no band is shown.
What counts as a claim ›How we measure confidence ›How we check this ›
Are you an author, or do you see a problem with this page? Request a review
