

The DOI matches its Crossref record; 31 of the 32 references it cites were found in a registry or an index.
Advanced siRNA Designs Further Improve In Vivo Performance of GalNAc-siRNA Conjugates
Open accessAbstract
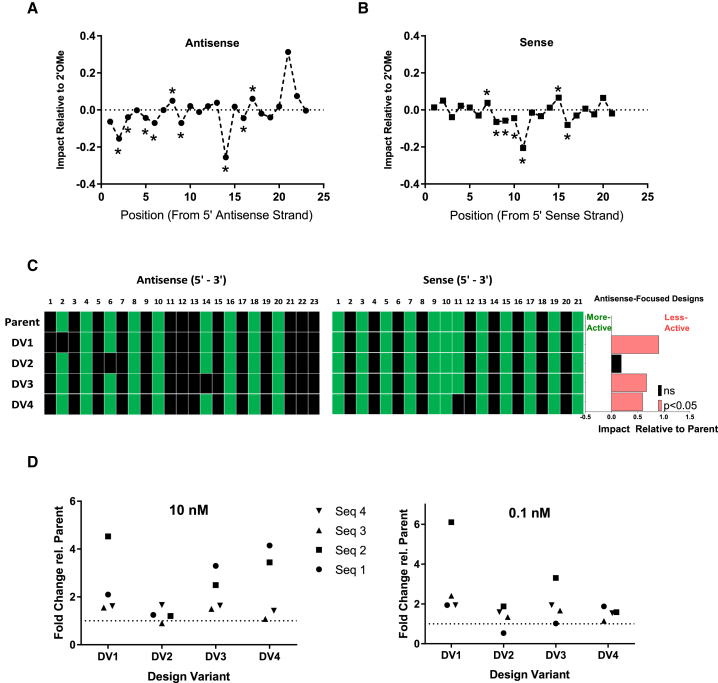
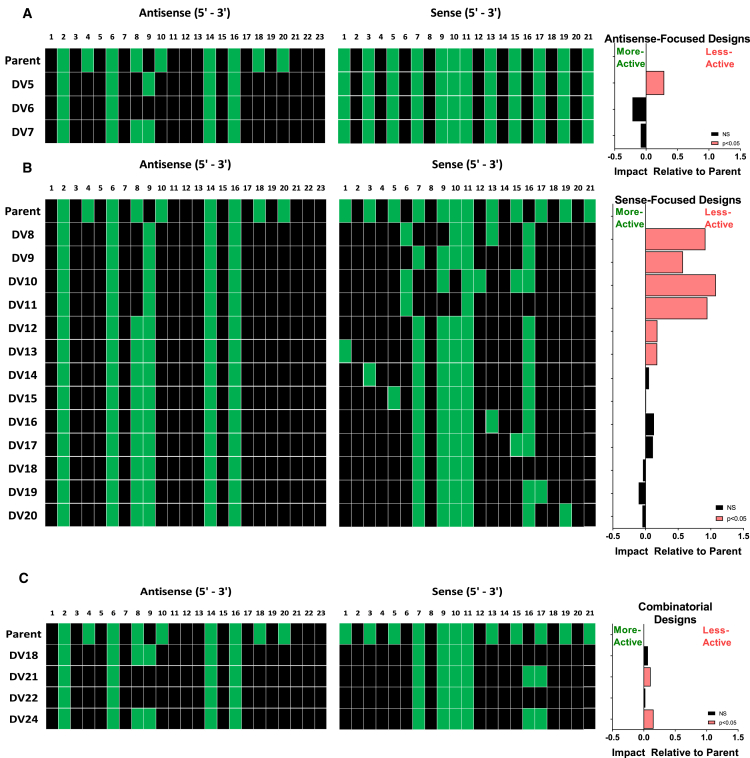
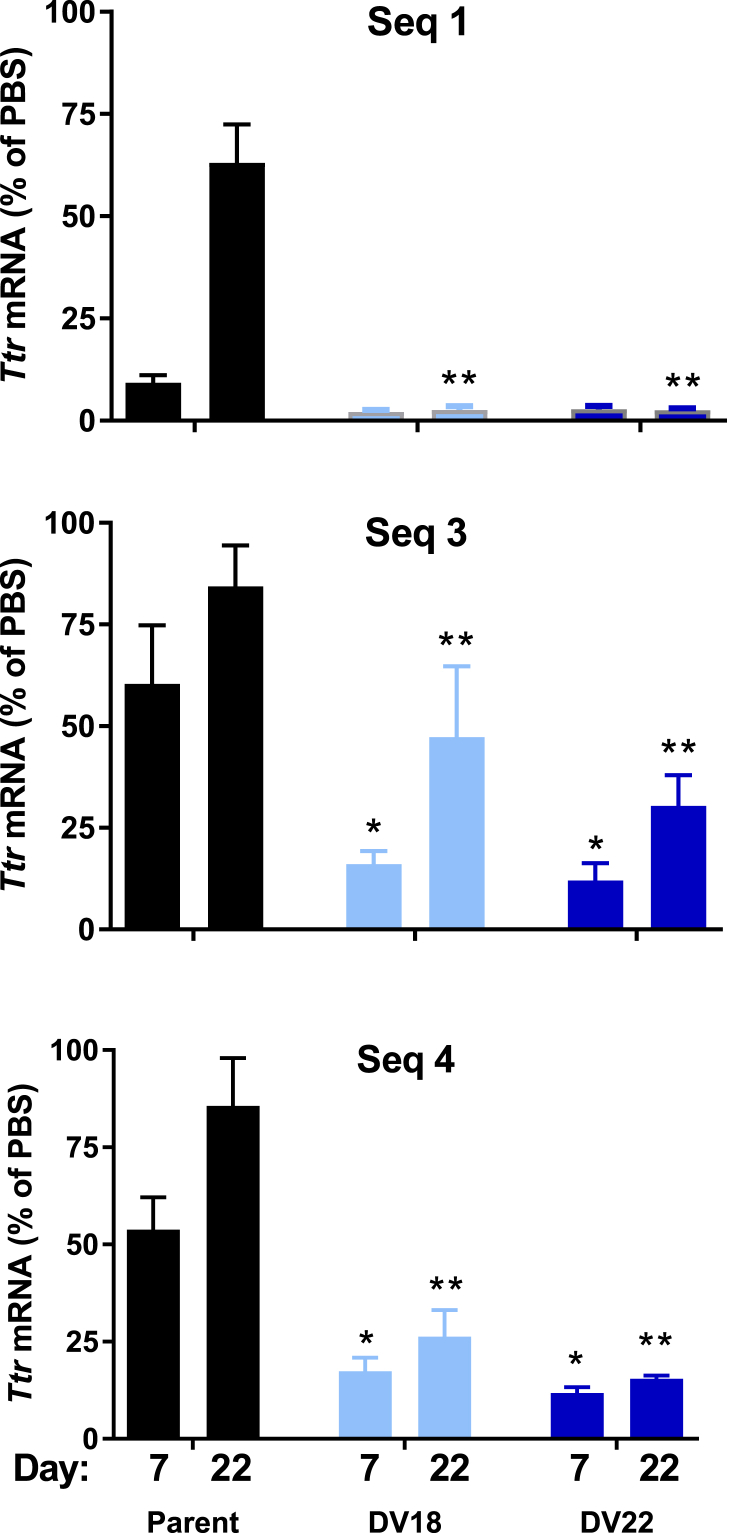
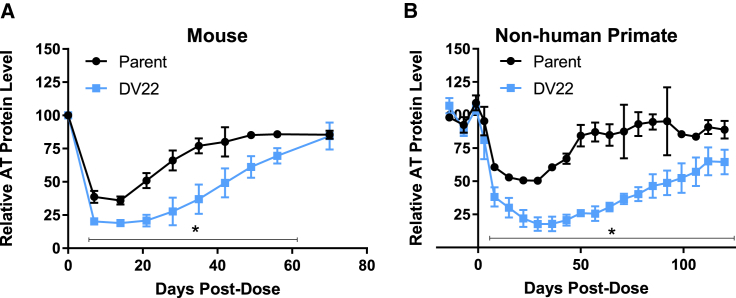
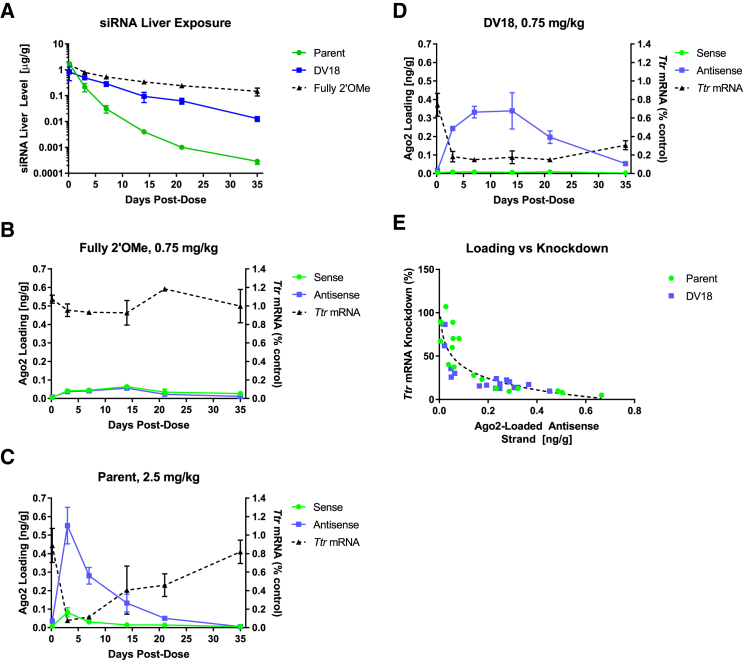
Significant progress has been made in the advancement of RNAi therapeutics by combining a synthetic triantennary N-acetylgalactosamine ligand targeting the asialoglycoprotein receptor with chemically modified small interfering RNA (siRNA) designs, including the recently described Enhanced Stabilization Chemistry. This strategy has demonstrated robust RNAi-mediated gene silencing in liver after subcutaneous administration across species, including human. Here we demonstrate that substantial efficacy improvements can be achieved through further refinement of siRNA chemistry, optimizing the positioning of 2'-deoxy-2'-fluoro and 2'-O-methyl ribosugar modifications across both strands of the double-stranded siRNA duplex to enhance stability without compromising intrinsic RNAi activity. To achieve this, we employed an iterative screening approach across multiple siRNAs to arrive at advanced designs with low 2'-deoxy-2'-fluoro content that yield significantly improved potency and duration in preclinical species, including non-human primate. Liver exposure data indicate that the improvement in potency is predominantly due to increased metabolic stability of the siRNA conjugates.
Overview
The claims and statistics of this paper haven’t been checked yet.
Run the check — free, no account needed. It reads the open-access text and checks the sources it cites.
Integrity signals
Registry
Cites
Statistics
Figures
Verification
Claims the paper makes
The claims and statistics of this paper haven’t been checked yet.
Run the check — free, no account needed. It reads the open-access text and checks the sources it cites.
Claims other papers make about this one
Each is checked against this paper’s own text: does it say what the citing paper says it does?
The source backs part of the claim, not all of it — or backs it for a different population, condition or comparison.
In the citing paper
“The naturally occurring RNAi pathway can also be harnessed in extrahepatic organs by building on nearly two decades of efforts on liver siRNA design optimization [9][10][11][12] ; however, novel delivery approaches are needed.”
From Expanding RNAi therapeutics to extrahepatic tissues with lipophilic conjugates (2022) · cites this paper as [9]
Experimental — accuracy not yet measuredThe source backs part of the claim, not all of it — or backs it for a different population, condition or comparison.
In the citing paper
“Next, we evaluated other siRNA design elements and con rmed that full chemical modi cation with strategic placement of 2'-uoro and 2'-O-methyl modi cations 9 is required for robust siRNA activity in the CNS.”
From Expanding RNAi therapeutics to extrahepatic tissues with lipophilic conjugates (2022) · cites this paper as [9]
Experimental — accuracy not yet measuredThe source backs part of the claim, not all of it — or backs it for a different population, condition or comparison.
In the citing paper
“2'-O-C16 was well tolerated across both strands, with potency similar to the unconjugated siRNA, except for a few positions known to be sensitive to sterically demanding 2'-modi cations 9 .”
From Expanding RNAi therapeutics to extrahepatic tissues with lipophilic conjugates (2022) · cites this paper as [9]
Experimental — accuracy not yet measured
Self-check
Percentages, sums and reported differences re-computed from the paper’s own numbers.
The self-check needs the paper’s full text.
Citations
Cites
Potent and specific genetic interference by double-stranded RNA in Caenorhabditis elegans
Fire, A., Xu, S., Montgomery, M. K., Kostas, S. A., Driver, S. E., & Mello, C. C. (1998) · Nature · doi:10.1038/35888 · Cited by 15,429
Duplexes of 21-nucleotide RNAs mediate RNA interference in cultured mammalian cells
Elbashir, S. M., Harborth, J., Lendeckel, W., Yalcin, A., Weber, K., & Tuschl, T. (2001) · Nature · doi:10.1038/35078107 · Cited by 9,456
Hannon, G. J. (2002) · Nature · doi:10.1038/418244a · Cited by 3,651
Nair, J. K., Willoughby, J. L. S., Chan, A., Charisse, K., Alam, M. R., Wang, Q., Hoekstra, M., Kandasamy, P., Kel’in, A. V., Milstein, S., et al. (2014) · Journal of the American Chemical Society · doi:10.1021/ja505986a · Cited by 1,141
Self-citationSafety and efficacy of RNAi therapy for transthyretin amyloidosis
Coelho, T., Adams, D., Silva, A., Lozeron, P., Hawkins, P. N., Mant, T., Perez, J., Chiesa, J., Warrington, S., Tranter, E., et al. (2013) · New England Journal of Medicine · doi:10.1056/nejmoa1208760 · Cited by 971
Self-citationsiRNA function in RNAi: A chemical modification analysis
Chiu, Y., & Rana, T. M. (2003) · RNA · doi:10.1261/rna.5103703 · Cited by 863
Knocking down disease: a progress report on siRNA therapeutics
Wittrup, A., & Lieberman, J. (2015) · Nature Reviews Genetics · doi:10.1038/nrg3978 · Cited by 827
A highly durable RNAi therapeutic inhibitor of PCSK9
Fitzgerald, K., White, S., Borodovsky, A., Bettencourt, B. R., Strahs, A., Clausen, V., Wijngaard, P., Horton, J. D., Taubel, J., Brooks, A., et al. (2017) · New England Journal of Medicine · doi:10.1056/nejmoa1609243 · Cited by 768
Frank-Kamenetsky, M. D., Grefhorst, A., Anderson, N. N., Racie, T., Bramlage, B., Akinc, A., Butler, D., Charissé, K., Dorkin, J. R., Fan, Y., et al. (2008) · Proceedings of the National Academy of Sciences · doi:10.1073/pnas.0805434105 · Cited by 645
Self-citationFitzgerald, K. J., Frank-Kamenetsky, M. D., Shulga‐Morskaya, S., Liebow, A., Bettencourt, B. R., Sutherland, J. E., Hutabarat, R. M., Clausen, V. A., Karsten, V., Cehelsky, J. E., et al. (2013) · The Lancet · doi:10.1016/s0140-6736(13)61914-5 · Cited by 586
Cited by
Sorted by citations
Items 201–300 of 327
Kajino, R., Sakamoto, S., & Ueno, Y. (2022) · RSC Advances · doi:10.1039/d2ra00705c · Cited by 7
Moreno, P. M. D., Cortinhas, J., Martins, A. S. G., & Pêgo, A. P. (2022) · ACS Applied Materials & Interfaces · doi:10.1021/acsami.2c15086 · Cited by 6
A Facile and General Tandem Oligonucleotide Synthesis Methodology for DNA and RNA
Saraya, J. S., & O’Flaherty, D. K. (2024) · ChemBioChem · doi:10.1002/cbic.202300870 · Cited by 7
Broc, B., Varini, K., Sonnette, R., Pecqueux, B., Benoist, F., Thomas, M., Masse, M., Mechioukhi, Y., Ferracci, G., David, M., et al. (2024) · Pharmaceutics · doi:10.3390/pharmaceutics16040548 · Cited by 8
Mansouri, M., Mansouri, K., Taheri, Z., Alhashemi, S. H., & Dehshahri, A. (2025) · BioDrugs · doi:10.1007/s40259-025-00711-7 · Cited by 10
Liu, Y., Quan, Y., Mao, Q., Xu, R., & Tai, W. (2025) · Bioconjugate Chemistry · doi:10.1021/acs.bioconjchem.5c00212 · Cited by 6
Complexing the Pre-assembled Brush-like siRNA with Poly(β-amino ester) for Efficient Gene Silencing
Liu, X., Ding, F., Guo, Y., Jiang, K., Fu, Y., Zhu, L., Li, M., Zhu, X., & Zhang, C. (2022) · ACS Applied Bio Materials · doi:10.1021/acsabm.1c01182 · Cited by 6
Craig, K. P., Abrams, M. T., & Amiji, M. M. (2022) · Nucleic Acid Therapeutics · doi:10.1089/nat.2022.0038 · Cited by 6
GalNAc- or Mannose-PEG-Functionalized Polyplexes Enable Effective Lectin-Mediated DNA Delivery
Steffens, R. C., Folda, P., Fendler, N. L., Höhn, M., Bücher, K. S., Kempter, S., Snyder, N. L., Hartmann, L., Wagner, E., & Berger, S. (2024) · Bioconjugate Chemistry · doi:10.1021/acs.bioconjchem.3c00546 · Cited by 7
Cholesterol-Modified Anti-Il6 siRNA Reduces the Severity of Acute Lung Injury in Mice
Chernikov, I. V., Bachkova, I. K., Васильевна, С. А., Meschaninova, M. I., Savin, I. A., Vlassov, V. V., Аркадьевна, З. М., & Chernolovskaya, E. L. (2024) · Cells · doi:10.3390/cells13090767 · Cited by 7
Controlling Protein Expression by Delivery of RNA Therapeutics Using Lipid Nanoparticles
Lin, P. J. C., & Tam, Y. K. (2019) · Elsevier eBooks · doi:10.1016/b978-0-12-814470-1.00009-5 · Cited by 6
Mechanistic Insights into Hybridization-Based Off-Target Activity of GalNAc-siRNA Conjugates
Agarwal, S., Taft, E., Gauthier, M., Darcy, J., Buckowing, K., Berman, D., Davis, W. P., Rogers, A. B., & Janas, M. M. (2025) · Nucleic Acid Therapeutics · doi:10.1089/nat.2024.0090 · Cited by 6
Ueda, K., Yamada, Y., Tanaka, H., Sato, T., Sasaki, J., Sakamoto, S., Minomi, K., Yamada, H., & Sugimoto, M. (2025) · Molecular Therapy — Nucleic Acids · doi:10.1016/j.omtn.2025.102768 · Cited by 6
Titze‐de‐Almeida, R., Gomes, G. D. M. O., dos Santos, T. C., & Titze-de-Almeida, S. S. (2025) · Pharmaceuticals · doi:10.3390/ph19010026 · Cited by 5
Schwarzmueller, L., Adam, R., Moreno, L. F., Nijman, L. E., Logiantara, A., Eleonora, S., Bril, O., Vromans, S. P. J. M., de Groot, N. E., Giugliano, F. P., et al. (2024) · Gut · doi:10.1136/gutjnl-2024-332752 · Cited by 7
Self-citationEvolution of Lipo-Xenopeptide Carriers for siRNA Delivery: Interplay of Stabilizing Subunits
Yazdi, M., Burghardt, T., Seidl, J., Lächelt, U., & Wagner, E. (2025) · Bioconjugate Chemistry · doi:10.1021/acs.bioconjchem.5c00096 · Cited by 5
Chemoprevention of hepatocellular carcinoma using N-acetylgalactosamine-conjugated siRNAs
Maggiore, G., Hsieh, M.-H., Bellary, A., Gopal, P., Li, L., Guo, J., Hsiehchen, D., Dadali, T., Broom, W. J., Maier, M. A., et al. (2025) · Disease Models & Mechanisms · doi:10.1242/dmm.052370 · Cited by 6
Self-citationLiver-targeted RNAi Therapeutics: Principles and Applications
Rajeev, K. G., & Manoharan, M. (2019) · Royal Society of Chemistry eBooks · doi:10.1039/9781788015714-00233 · Cited by 5
Self-citationLipophilic siRNA conjugates yield durable silencing in extrahepatic tissues
(2022) · Nature Biotechnology · doi:10.1038/s41587-022-01335-w · Cited by 5
Drug delivery breakthrough technologies – A perspective on clinical and societal impact
Bittner, B., Sánchez-Félix, M., Lee, D., Koynov, A. A., Horvath, J. D., Schumacher, F. F., & Matoori, S. (2023) · Journal of Controlled Release · doi:10.1016/j.jconrel.2023.06.034 · Cited by 5
Shubhra, Q. T. H., & Alam, A. K. M. M. (2023) · Molecular Therapy — Nucleic Acids · doi:10.1016/j.omtn.2023.06.005 · Cited by 5
Tsukimura, R., Kajino, R., Zhou, Y., Chandela, A., & Ueno, Y. (2021) · Results in Chemistry · doi:10.1016/j.rechem.2021.100231 · Cited by 5
Serotonin-induced miR-221/222 contribute to the activation of hepatic stellate cells
Xiang, Y., Ma, Y., Liu, J., Wu, Z., Wang, X., Liu, L., Wang, G., Fu, D., & Shi, W. (2020) · Biologia · doi:10.2478/s11756-019-00376-y · Cited by 5
Hariharan, V. N., Summers, A., Clipperton‐Allen, A. E., Caiazzi, J., Hildebrand, S. R., Reilly, D. O., Tang, Q., Kennedy, Z., Echeverria, D., McHugh, N., et al. (2025) · bioRxiv (Cold Spring Harbor Laboratory) · doi:10.1101/2025.03.26.645328 · Cited by 5
Targeting CIDEB alleviates liver steatosis and fibrosis in mouse MASH models
Lin, Y., Fan, F., Mo, Z., Huang, Z., Zhou, M., Ma, Y., Qian, C., Wang, Y., Qian, C., & Liu, X. (2025) · Molecular Therapy — Nucleic Acids · doi:10.1016/j.omtn.2025.102567 · Cited by 4
Qiu, Y., Bai, X. L., Gao, J.-N., Tang, B., Liu, M., Ding, J., & Liu, X. (2025) · International Journal of Biological Macromolecules · doi:10.1016/j.ijbiomac.2025.145580 · Cited by 4
Therapeutic siRNA: Mechanisms, challenges, strategies, and clinical translation
Jiang, Q., Fu, J., An, Y., & Liu, Y. (2026) · Chinese Medical Journal · doi:10.1097/cm9.0000000000004061 · Cited by 4
Therapeutic oligonucleotides revisited: Focus on siRNA and antisense technologies
Chen, L., Xu, J., Li, J., Liu, G., & Ma, H. (2026) · The Innovation Drug Discovery · doi:10.59717/j.xinn-drugdisc.2026.100007 · Cited by 6
Near Sequence Homology Does Not Guarantee siRNA Cross-Species Efficacy
Flores, I. V. R., Monopoli, K. R., Jackson, S., Echeverria, D., O’Reilly, D., Brown, R. H., & Khvorova, A. (2024) · Nucleic Acid Therapeutics · doi:10.1089/nat.2024.0030 · Cited by 4
Benzenberg, L. R., Vincent, M., Greis, K., Zimmermann, M., Oganesyan, I., Walles, M., Hall, J., Root, K., & Zenobi, R. (2025) · Analytical Chemistry · doi:10.1021/acs.analchem.5c03045 · Cited by 5
Huang, Z.-A., Yang, S., Ji, G.-S., Gao, Z.-C., Li, Z.-M., Wang, J., Yu, F., & Song, G.-S. (2025) · Molecular Therapy — Methods & Clinical Development · doi:10.1016/j.omtm.2025.101609 · Cited by 4
CMC and regulatory aspects of oligonucleotide therapeutics
Rupp, T. M., & Cramer, H. (2022) · Elsevier eBooks · doi:10.1016/b978-0-12-821595-1.00012-9 · Cited by 4
Effective carrier-free gene-silencing activity of sphingosine-modified siRNAs
Fernandez, C., Giorgees, I., Goss, E., & Desaulniers, J. (2023) · Organic & Biomolecular Chemistry · doi:10.1039/d2ob02099h · Cited by 4
Recent Advances in RNA Interference-Based Therapy for Hepatocellular Carcinoma: Emphasis on siRNA
Alzahrani, M. S., Almutairy, B. S., Althobaiti, Y. S., & Alsaab, H. O. (2024) · Cell Biochemistry and Biophysics · doi:10.1007/s12013-024-01395-6 · Cited by 4
Hong, Y., Liu, Y., Shen, H., Li, B., & Li, Q. (2025) · Journal of Translational Medicine · doi:10.1186/s12967-025-06344-2 · Cited by 5
2024 KSoLA Update on New Lipid-Lowering Agents: Inclisiran and Bempedoic Acid
Kim, H., Cha, J., & Lee, S. (2025) · Journal of Lipid and Atherosclerosis · doi:10.12997/jla.2025.14.2.135 · Cited by 6
O’Reilly, D., Furgal, R., Hariharan, V. N., Lochmann, C., Cooper, D., Echeverria, D., & Khvorova, A. (2025) · Nucleic Acid Therapeutics · doi:10.1089/nat.2024.0077 · Cited by 5
N-acetylgalactosamine (GalNAc)-conjugates: Delivering oligonucleotide drugs to the liver
Sharma, V., Olety, B., & Prasad, A. K. (2020) · Elsevier eBooks · doi:10.1016/b978-0-12-816675-8.00016-6 · Cited by 4
Molecular elements: novel approaches for molecular building
Wang, R., Wang, X., Xie, S., Zhang, Y., Ji, D., Zhang, X., Cui, C., Jiang, J., & Tan, W. (2023) · Philosophical Transactions of the Royal Society B Biological Sciences · doi:10.1098/rstb.2022.0024 · Cited by 4
Tumor-Targeted Codelivery of CpG and siRNA by a Dual-Ligand-Functionalized Curdlan Nanoparticle
Bao, Q., Bao, M., Xiao, H. T., Ganbold, T., Han, S., & Baigude, H. (2024) · Biomacromolecules · doi:10.1021/acs.biomac.4c00025 · Cited by 4
MASAKI, Y., Yamamoto, K., Yoshida, K., Maruyama, A., Tomori, T., Iriyama, Y., Nakajima, H., Kanaki, T., & Seio, K. (2019) · Organic & Biomolecular Chemistry · doi:10.1039/c9ob00668k · Cited by 4
Potent and durable gene modulation in heart and muscle with chemically defined siRNAsPreprint
Fakih, H. H., Lochmann, C., Gagnon, R., Summers, A., Caiazzi, J., Buchwald, J. E., Tang, Q., Maru, B., Hildebrand, S. R., Abideen, M. Z. U., et al. (2024) · bioRxiv (Cold Spring Harbor Laboratory) · doi:10.1101/2024.10.01.616183 · Cited by 4
Design and Evaluation of RNA Aptamer–Mediated Delivery of C/EBP β siRNA for Oncological Therapy
Vasconcelos, D., Sodergren, M. H., Reebye, V., Vasara, J., Song, M., Holm, K. N., Khorsandi, S. E., Rossi, J. J., Habib, N. A., & Huang, K. (2025) · Journal of Nucleic Acids · doi:10.1155/jna/1461574 · Cited by 3
Brown, S., Malinowska, A. L., Bennett, M., Correa-Sánchez, A. F., Valencia, L. L. H., Lucignoli, A. P., Barton, A. K., Clark, L., Sluimer, J. C., Webster, S. P., et al. (2025) · JACC Basic to Translational Science · doi:10.1016/j.jacbts.2025.101364 · Cited by 4
Chickering, T., Harp, J. M., Jiang, Y., Qin, J., He, G., Hyde, S., Ihlefeld, A., Janas, M. M., O’Flaherty, D. K., Schofield, S., et al. (2026) · Nucleic Acids Research · doi:10.1093/nar/gkag345 · Cited by 3
Self-citationStructural basis for chaperone-guided assembly of RNA-induced silencing complex
Lee, Y.-Y., Jeong, M., Lee, H., Lee, D., Lee, J., Park, J., Kim, V. N., & Roh, S. (2026) · Nature · doi:10.1038/s41586-026-10640-2 · Cited by 4
Catalytic activation of human Argonaute 2 requires RNA duplex deformation
Sarkar, S., Gebert, L. F. R., & MacRae, I. J. (2026) · Nature Structural & Molecular Biology · doi:10.1038/s41594-026-01840-5 · Cited by 3
Chemical Modification and Delivery System of Small Interfering RNA Drugs★
Li, C., Si, X., Li, J., & Zhang, Y. (2023) · 化学学报 · doi:10.6023/a23040179 · Cited by 4
Aluri, K. C., Datta, D., Waldron, S., Taneja, N., Qin, J., Donnelly, D. P., Theile, C. S., Guenther, D. C., Li, L., Harp, J. M., et al. (2024) · Journal of the American Chemical Society · doi:10.1021/jacs.4c07902 · Cited by 4
Self-citationLi, Q., Dong, M., & Chen, P. (2024) · RSC Advances · doi:10.1039/d4ra03023k · Cited by 3
Amphipathic Octenyl‐Alanine Modified Peptides Mediate Effective siRNA Delivery
Lehto, T., Isakannu, M., Sork, H., Lorents, A., Bazaz, S., Wiklander, O. P. B., Andaloussi, S. E., & Lehto, T. (2025) · Journal of Peptide Science · doi:10.1002/psc.70054 · Cited by 4
Targeted delivery of nucleic acids using microfluidic systems
Hosseini, M., Rabiee, N., & Bagherzadeh, M. (2020) · Elsevier eBooks · doi:10.1016/b978-0-12-818791-3.00009-7 · Cited by 3
Nanobiotechnology and Its Application in Nanomedicine: An Overview
Deka, T., Das, M. K., Das, S., Singha, L. R., & Das, P. (2020) · Springer eBooks · doi:10.1007/978-981-15-6255-6_1 · Cited by 4
Mao, Q., Quan, Y., Chen, S., & Tai, W. (2025) · Molecular Therapy — Nucleic Acids · doi:10.1016/j.omtn.2025.102751 · Cited by 2
Wang, Y., Wu, S., He, Y., Zhang, J., Chen, Y.-J., Zhou, L., Li, X., & Yang, Y. (2025) · Biomaterials · doi:10.1016/j.biomaterials.2025.123882 · Cited by 2
Platform Assessment of Concentration–QTc Relationship Across GalNAc–siRNA Molecules
Badri, P. S., Kolachana, K., Duong, A., Lasko, M. J., Nandi, T., Mehrotra, N., & Robbie, G. J. (2025) · Clinical Pharmacokinetics · doi:10.1007/s40262-025-01606-0 · Cited by 2
Nesbitt, D. J., Mertz, K. L., Probasco, M. D., Peters-Clarke, T. M., Oman, T. J., Syka, J. E. P., Quarmby, S. T., & Coon, J. J. (2025) · Journal of the American Society for Mass Spectrometry · doi:10.1021/jasms.5c00345 · Cited by 2
Potent and durable gene modulation in heart and muscle with chemically defined lipophilic siRNAs
Fakih, H. H., Lochmann, C., Gagnon, R., Summers, A., Caiazzi, J., Buchwald, J. E., Tang, Q., Maru, B., Hildebrand, S. R., Abideen, M. Z. U., et al. (2025) · Nucleic Acids Research · doi:10.1093/nar/gkaf1374 · Cited by 2
Profiling RNA metabolism to understand tissue and subcellular clearance of therapeutic RNA
Andersen, H. M., Hill, R. C., Bell, A., Lowery, S., Murphy, A., Huskin, M., Mohutsky, M. A., & Wiethoff, C. M. (2026) · Drug Metabolism and Disposition · doi:10.1016/j.dmd.2026.100243 · Cited by 2
Precision medicine with pioneering RNAi therapeutics in ATTR amyloidosis: from bench to bedside
Malinverni, S., Vergaro, G., Verona, G., & Porcari, A. (2026) · European Journal of Internal Medicine · doi:10.1016/j.ejim.2026.106738 · Cited by 3
Parvathaneni, R. P., Krishnan, N., Hempel, N., Oommen, O. P., & Varghese, O. P. (2026) · JACS Au · doi:10.1021/jacsau.5c01765 · Cited by 2
Recent innovative approaches for drug delivery systems targeting cancer and CNS disorders
Anand, M. K., Premalatha, E., Moorthy, H., & Govindaraju, T. (2026) · Journal of Materials Chemistry B · doi:10.1039/d6tb00411c · Cited by 3
Quantitation of Diastereomer Content in PS-Modified Synthetic Oligonucleotides using cIMS-MS
O’Keefe, S., Sharon, E. M., Grassmyer, K. T., Raab, S. A., Maloney, T. D., & Clemmer, D. E. (2026) · Analytical Chemistry · doi:10.1021/acs.analchem.6c00816 · Cited by 2
Gene Silencing Therapeutics in Cardiology: A Review Article
Jay, P. Y., Maier, M. A., Saltonstall, L., Duarte, L., Antonino, I., & Vest, J. (2021) · International Journal of Cardiovascular Sciences · doi:10.36660/ijcs.20200306 · Cited by 2
Self-citationTO MARKET, TO MARKET–2022: MACROMOLECULAR THERAPEUTICS
Lim, S. A., Agard, N. J., Kelly, R. L., Bell, B. N., Chen, S.-J., Gram, A. M., Merritt, J. R., Moench, I., Pance, K., & Petojevic, T. (2023) · Medicinal chemistry reviews · doi:10.1021/mc-2023-vol58.ch25 · Cited by 2
A Guide to Chemical Considerations for the Pre-Clinical Development of Oligonucleotides
O’Reilly, D., van Roon‐Mom, W., Aartsma-Rus, A. M., & Collaborative, O. B. O. T. N. =. 1. (2024) · Nucleic Acid Therapeutics · doi:10.1089/nat.2024.0031 · Cited by 2
RNAi drugs: Next generation drugs?
Yan, B., Mi, Y., Cui, Q., Tong, Z., Janefrancis, A. I., & Gao, S. (2020) · Chinese Science Bulletin (Chinese Version) · doi:10.1360/tb-2019-0211 · Cited by 2
Medicinal Chemistry of Oligonucleotide Drugs - Milestones of the Past and Visions for the Future
Hall, J., Ashkinadze, A., Becker, J. P., Łaski, A., Manz, E.-M., Moravčík, Š., Sjöström, S., & Vincent, M. (2022) · CHIMIA International Journal for Chemistry · doi:10.2533/chimia.2022.466 · Cited by 2
Nanotechnology for DNA and RNA delivery
Sands, I., Lee, J., & Chen, Y. (2023) · Elsevier eBooks · doi:10.1016/b978-0-12-818627-5.00008-7 · Cited by 3
Hayashi, J., Ochi, Y., Senpuku, K., Wada, S., Wada, F., Harada‐Shiba, M., & Urata, H. (2024) · Bioorganic & Medicinal Chemistry · doi:10.1016/j.bmc.2024.117693 · Cited by 1
Advanced drug delivery systems for enhancing the efficacy of RNA-based therapeutics
Alhabib, N. A., Almaniea, M. A., Alehaidib, S. M., Almansour, M. A., Aldosary, M. S., Almegbel, M. T., Alsubaie, S. A., & Alzahrani, A. M. (2022) · International Journal of Health Sciences · doi:10.53730/ijhs.v6ns10.15029 · Cited by 1
Huang, R., Du, H., Cheng, L., Zhao, N., Zhang, P., Meng, F., & Zhong, Z. (2024) · Chemistry of Materials · doi:10.1021/acs.chemmater.4c02335 · Cited by 1
Application of small interfering RNA technology in cytochrome P450 gene modulation
Jiang, W., Sang, R., Zhang, C., Yin, R., Ouyang, Z., & Yuan, W. (2025) · Drug Metabolism and Disposition · doi:10.1016/j.dmd.2025.100040 · Cited by 1
Pu, Y., Wang, Q., Pan, Y., Wang, X., Guan, Z., Zhu, Y., & Yang, Z. (2025) · Molecular Pharmaceutics · doi:10.1021/acs.molpharmaceut.4c01318 · Cited by 1
Tumor Microenvironment Self-Propelled Nanoreactors for Synergistic Cancer Chemodynamic–Gene Therapy
Liu, Y., Qian, Y., Chen, W., Xia, J., Li, J., & Lu, X. (2025) · ACS Applied Nano Materials · doi:10.1021/acsanm.5c04709 · Cited by 1
In vivo base editing of Asgr1 reduces blood lipids in mice
Agrahari, G., Nguyen, N. T. K., Li, M., Zhang, C., Xu, J., Zhang, J., Chen, Y. E., & Han, R. (2026) · Molecular Therapy · doi:10.1016/j.ymthe.2026.05.020 · Cited by 1
Nucleic Acid Therapeutics for “Undruggable” Cancer Targets: Mechanisms, Challenges, and Prospects
Xu, F., Wang, K. J., 卢开忠, Hou, T., Chen, Y., Wang, X., & Jin, H. (2026) · Advanced Science · doi:10.1002/advs.75837 · Cited by 3
Accelerating drug discovery with mass spectrometry-driven bioanalytical innovations and beyond
Mwangi, J. N., Hill, R. C., Runnebohm, A. M., Czerwieniec, G. A., & Berna, M. J. (2026) · Bioanalysis · doi:10.1080/17576180.2026.2687591 · Cited by 1
Kim, J., Min, S., Yum, M., Park, S., Park, S., Shin, D., Park, S. W., Park, S., Do, Y., Park, J. H., et al. (2026) · Molecular Therapy · doi:10.1016/j.ymthe.2026.06.036 · Cited by 2
Li, Y., Liu, X. D., Zhang, F., Fu, R., Zhao, D., Ye, L., & Zhu, Y. Z. (2026) · Journal of Hematology & Oncology · doi:10.1186/s13045-026-01824-4 · Cited by 1
Burton, K., & Dellinger, K. (2026) · Molecules · doi:10.3390/molecules31152588 · Cited by 1
Pan, Y., Wang, Q., & Ma, Y. (2024) · Interdisciplinary cancer research · doi:10.1007/16833_2024_285 · Cited by 1
Mekonnen, N., Seo, M.-R., Yang, H., Chelakkot, C., Choi, J. Y., Hong, S., Song, K., & Shin, Y. K. (2024) · Biomolecules & Therapeutics · doi:10.4062/biomolther.2024.071 · Cited by 1
Godinho, B. M. D. C., Coles, A. H., & Khvorova, A. (2019) · Royal Society of Chemistry eBooks · doi:10.1039/9781788015714-00206 · Cited by 1
mRNA Structuring for Stabilizing mRNA Nanocarriers and Improving Their Delivery Efficiency
Uchida, S., Koji, K., Yoshinaga, N., Mochida, Y., Hong, T., & Cabral, H. (2020) · International Online Conference on Nanomaterials (IOCN) · doi:10.3390/iocn2020-07789 · Cited by 1
Recent Advances in Nanocarriers Used for Selective Gene Silencing Therapy
Praça, F. S. G., Borgheti-Cardoso, L. N., de Araújo, M. M., & Bentley, M. V. L. B. (2021) · Nanomedicine and nanotoxicology · doi:10.1007/978-3-030-63389-9_9
Synthetic Technology of Noncoding RNAs Used in Bone Disease Research and Therapeutics
Tian, Y. E., Yin, C., Yang, C., Ji, M., Chu, X., & Qian, A. (2021) · Springer eBooks · doi:10.1007/978-981-16-2402-5_7
Chemical engineering of therapeutic siRNAs for allele-specific gene silencing in vivo in CNSPreprint
Conroy, F., Miller, R., Alterman, J. F., Hassler, M. R., Echeverria, D., Godinho, B. M. D. C., Knox, E. G., Sapp, E., Sousa, J., Yamada, K., et al. (2022) · bioRxiv (Cold Spring Harbor Laboratory) · doi:10.1101/2022.06.29.498088
Nucleic Acid Pharmaceutical Agents
Kohnken, R. A., Harbison, C. E., Klein, S., & Engelhardt, J. A. (2023) · Elsevier eBooks · doi:10.1016/b978-0-12-821047-5.00017-8
The SARS-CoV-2 targeted siRNA-nanoparticle therapy for COVID-19
Wang, J., & Zhang, X. (2023) · International Conference on Modern Medicine and Global Health (ICMMGH) · doi:10.1117/12.2692598
Halami, B., W#, K., Ye, Z., Neupane, N., Bawazir, N., Zhang, G., Simonenko, V., Lü, P., & Evans, D. M. (2024) · Journal of Oncology Research and Therapy · doi:10.29011/2574-710x.10218
Advances in Nucleic Acid Drug Delivery Systems for Liver Cancer Treatment
Liu, W., Li, D., Deng, K., Liu, J., Zhang, J., & Zhang, C. Y. (2024) · 化学学报 · doi:10.6023/a24090258
Effect of pH-Responsive Ligands on mRNA Knockdown in EGFR-Targeting Ligand-Conjugated siRNAs
Harumoto, T., Kawai, R., Motosawa, K., Iwano, J., Koda, Y., Hirata, Y., & Uehara, K. (2025) · ACS Chemical Biology · doi:10.1021/acschembio.4c00507
Targeted delivery of BACE1 siRNA for synergistic treatment of Alzheimer's diseasePreprint
Li, Z., Yang, J., Li, J., Zhao, S., Jiang, S., Liu, W., Li, X., Zhang, S.-M., Du, H., Ni, J., et al. (2025) · Research Square · doi:10.21203/rs.3.rs-5825677/v1
Motosawa, K., Iwano, J., Harumoto, T., Yabuuchi, H., Hatanaka, K., Koda, Y., Kubo, T., Kodaira, H., & Uehara, K. (2025) · ACS Omega · doi:10.1021/acsomega.4c11519
New modalities: Drugging the undruggable GPCR targets
Zawadzki, P., Graczyk, P. P., & Staroń, J. (2025) · Elsevier eBooks · doi:10.1016/b978-0-443-29808-0.00030-3
Development of siRNA therapeutics to combat microbial infections: a bibliometric analysis
He, Y., Yuan, Y., Zhou, M., Li, M., Li, L., Li, C., Liang, X., Liu, P., Wang, W., & Deng, Z. (2025) · Frontiers in Cellular and Infection Microbiology · doi:10.3389/fcimb.2025.1697880
Gallo, G., Tocci, G., Ricci, M., Volterrani, M., Rubattu, S., & Volpe, M. (2025) · High Blood Pressure & Cardiovascular Prevention · doi:10.1007/s40292-025-00759-0
Li, Y., & Meng, X. (2026) · Chinese Chemical Letters · doi:10.1016/j.cclet.2026.112501
Kou, S., Zhang, Y., Qian, Y., Ding, X., Jin, J., & Yang, Z. (2026) · Nucleosides Nucleotides & Nucleic Acids · doi:10.1080/15257770.2026.2640829
Metadata
- Authors
- Foster, D. J., Brown, C. R., Shaikh, S., Trapp, C., Schlegel, M. K., Qian, K., Sehgal, A., Rajeev, K. G., Jadhav, V., Manoharan, M., Kuchimanchi, S., Maier, M. A., & Milstein, S.
- Affiliations
- Alnylam Pharmaceuticals (United States) (US)
- Corresponding author
- Milstein, Stuart
- ORCID
- Venue
- Molecular Therapy
- Publisher
- Elsevier BV
- Published
- 2018-03
- Volume
- 26
- Issue
- 3
- Pages
- 708-717
- ISSN
- 1525-0016 (ISSN-L)
- PMC
- PMC5910670
- OpenAlex
- W2781906140
- Cited by
- 325
- References
- 32
- Citations by year
- 2026: 41 · 2025: 46 · 2024: 49 · 2023: 34 · 2022: 34 · 2021: 37 · 2020: 43 · 2019: 24 · 2018: 17
- FWCI
- 10.76
- Type
- journal article
- Language
- en
- Open access
- hybrid
- doi.org
- Licence
- Locations
- Molecular Therapy (publishedVersion, cc-by)
- Europe PMC (PubMed Central) (publishedVersion, cc-by)
- PubMed Central (publishedVersion, cc-by)
- PubMed (publishedVersion)
- Topics
- Life Sciences › Biochemistry, Genetics and Molecular Biology › Molecular Biology › RNA Interference and Gene Delivery
- Life Sciences › Biochemistry, Genetics and Molecular Biology › Molecular Biology › DNA and Nucleic Acid Chemistry
- Life Sciences › Biochemistry, Genetics and Molecular Biology › Molecular Biology › RNA and protein synthesis mechanisms
- Keywords
- siRNA design, RNAi therapeutics, asialoglycoprotein receptor, siRNA stability, non-human primates, subcutaneous administration
- MeSH terms
- Acetylgalactosamine, Animals, Gene Expression Regulation, Liver, Male, Mice, Transgenic, RNA, Messenger, Gene Silencing, Hepatocytes, RNA Interference, RNA, Small Interfering, Mice, Argonaute Proteins
About these checks
Registry, retraction, Cites and statistics results are computed, not judged, with one exception: a printed reference that no index lists is read once by a model before it counts as a citation error. Claims are extracted by a model and kept only when their quote appears verbatim in the text; each cited source is then checked, with a model’s help, for whether it says what the claim relies on. Those verdicts can be wrong — read the claim’s quote and the cited source before relying on one.
Statistics and arithmetic are recomputed, not judged.
Confidence bands are shown only for fields calibrated on our annotated test set. None is calibrated yet, so no band is shown.
What counts as a claim ›How we measure confidence ›How we check this ›
Are you an author, or do you see a problem with this page? Request a review
