Cited by 14

The DOI matches its Crossref record; 3 of the 3 references it cites were found in a registry or an index.

Regulated turnover of a cell surface-associated pool of newly synthesized apolipoprotein E in HepG2 cells

Schmitt, Matthias, Grand-Perret, Thierry·1999·Journal of Lipid Research

Overview

The claims and statistics of this paper haven’t been checked yet.

Run the check — free, no account needed. It reads the open-access text and checks the sources it cites.

A few free checks a day · papers already verified open instantly · results are public

Integrity signals

Registry

Crossref · 10.1016/s0022-2275(20)33337-x

Cites

3 of 3 references verified0 citation errors · 0 not checkable

Statistics

Figures

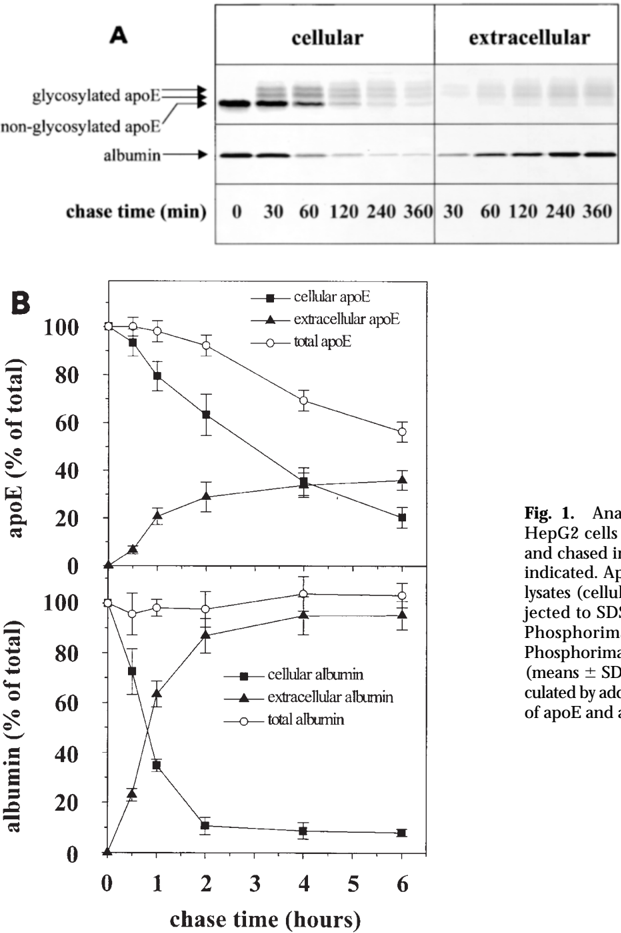
Fig. 1 Analysis of apoE and albumin secretion by HepG2 cells. HepG2 cells were radiolabeled with [ 35 S]methionine for 10 min and chased in the presence of unlabeled methionine for the times indicated. ApoE and albumin were immunoprecipitated from cell lysates (cellular) and culture supernatants (extracellular) and subjected to SDS-PAGE as described in Materials and Methods. (A) Phosphorimager analysis of representative SDS-PAGE gels. (B) Phosphorimager quantification of four independent experiments (means 6 SD). All apoE bands were quantified. The totals were calculated by addition of cellular and extracellular material. The amounts of apoE and albumin after the pulse were set to 100%.
Fig. 1 Analysis of apoE and albumin secretion by HepG2 cells. HepG2 cells were radiolabeled with [ 35 S]methionine for 10 min and chased in the presence of unlabeled methionine for the times indicated. ApoE and albumin were immunoprecipitated from cell lysates (cellular) and culture supernatants (extracellular) and subjected to SDS-PAGE as described in Materials and Methods. (A) Phosphorimager analysis of representative SDS-PAGE gels. (B) Phosphorimager quantification of four independent experiments (means 6 SD). All apoE bands were quantified. The totals were calculated by addition of cellular and extracellular material. The amounts of apoE and albumin after the pulse were set to 100%.CC-BY · From the PDF
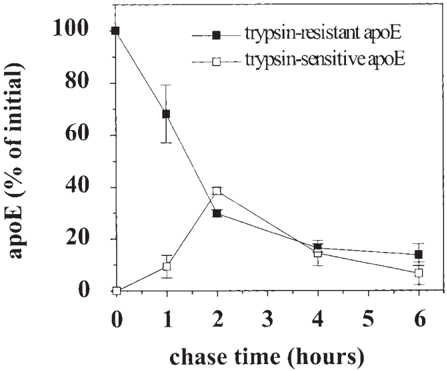
Fig. 2 Transient accumulation of newly synthesized apoE on the cell surface. HepG2 cells were radiolabeled with [ 35 S]methionine for 10 min and chased in the presence of unlabeled methionine for the times indicated. After the chase, cells were biotinylated and treated with 200 m g/ml trypsin as described in Materials and Methods. ApoE was immunoprecipitated from cell lysates of trypsintreated and non-trypsin-treated cells as described in Materials and Methods. Samples were subjected to SDS-PAGE and quantified by phosphorimager analysis. The figure shows means 6 SD of three independent experiments. Trypsin-sensitive apoE was calculated as the difference between apoE immunoprecipitations of trypsintreated and non-trypsin-treated cells. The amount of apoE after the pulse was set to 100%.
Fig. 2 Transient accumulation of newly synthesized apoE on the cell surface. HepG2 cells were radiolabeled with [ 35 S]methionine for 10 min and chased in the presence of unlabeled methionine for the times indicated. After the chase, cells were biotinylated and treated with 200 m g/ml trypsin as described in Materials and Methods. ApoE was immunoprecipitated from cell lysates of trypsintreated and non-trypsin-treated cells as described in Materials and Methods. Samples were subjected to SDS-PAGE and quantified by phosphorimager analysis. The figure shows means 6 SD of three independent experiments. Trypsin-sensitive apoE was calculated as the difference between apoE immunoprecipitations of trypsintreated and non-trypsin-treated cells. The amount of apoE after the pulse was set to 100%.CC-BY · From the PDF
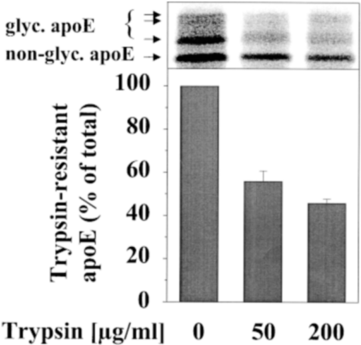
Fig. 3 Cell-associated apoE is localized predominantly on the cell surface. HepG2 cells were radiolabeled with [ 35 S]methionine for 48 h in RPMI-medium in the absence of serum. Afterwards, cells were treated with the indicated concentrations of trypsin as described in Materials and Methods. Cells were lysed and apoE was immunoprecipitated as described in Materials and Methods. The figure shows the phosphorimager analysis of a representative gel (upper panel) and the phosphorimager quantification of duplicate samples (means 6 SD; lower panel). Similar results were obtained when cells were radiolabeled in the presence of 10% fetal bovine serum.
Fig. 3 Cell-associated apoE is localized predominantly on the cell surface. HepG2 cells were radiolabeled with [ 35 S]methionine for 48 h in RPMI-medium in the absence of serum. Afterwards, cells were treated with the indicated concentrations of trypsin as described in Materials and Methods. Cells were lysed and apoE was immunoprecipitated as described in Materials and Methods. The figure shows the phosphorimager analysis of a representative gel (upper panel) and the phosphorimager quantification of duplicate samples (means 6 SD; lower panel). Similar results were obtained when cells were radiolabeled in the presence of 10% fetal bovine serum.CC-BY · From the PDF
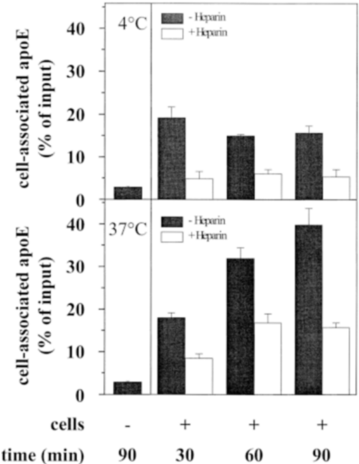
Fig. 4 Heparin-sensitive binding of apoE to HepG2 cells. HepG2 cells were radiolabeled with [ 35 S]methionine for 15 min and chased in the presence of unlabeled methionine for 2 h. Chase media containing radiolabeled secreted proteins were incubated with unlabeled HepG2 cells ( 1 cells) in the presence or absence of heparin (10 m g/ml) as described in Materials and Methods. In parallel, chase media containing radiolabeled secreted proteins were incubated in empty wells of the culture dishes to assay non-specific binding ( 2 cells). Incubations were performed either at 4 8 C (upper panel) or at 37 8 C (lower panel) for the times indicated. Afterwards, apoE was immunoprecipitated from cell lysates and culture supernatants and subjected to SDS-PAGE as described in Materials and Methods. Samples were quantified by phosphorimager analysis (means 6 SD of three independent experiments). The amount of radiolabeled apoE applied to each well of unlabeled cells was set to 100%.
Fig. 4 Heparin-sensitive binding of apoE to HepG2 cells. HepG2 cells were radiolabeled with [ 35 S]methionine for 15 min and chased in the presence of unlabeled methionine for 2 h. Chase media containing radiolabeled secreted proteins were incubated with unlabeled HepG2 cells ( 1 cells) in the presence or absence of heparin (10 m g/ml) as described in Materials and Methods. In parallel, chase media containing radiolabeled secreted proteins were incubated in empty wells of the culture dishes to assay non-specific binding ( 2 cells). Incubations were performed either at 4 8 C (upper panel) or at 37 8 C (lower panel) for the times indicated. Afterwards, apoE was immunoprecipitated from cell lysates and culture supernatants and subjected to SDS-PAGE as described in Materials and Methods. Samples were quantified by phosphorimager analysis (means 6 SD of three independent experiments). The amount of radiolabeled apoE applied to each well of unlabeled cells was set to 100%.CC-BY · From the PDF
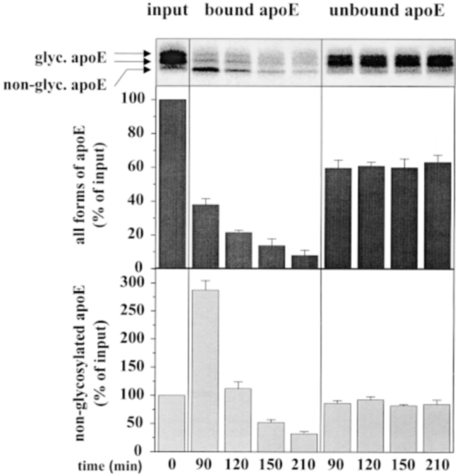
Fig. 5 Binding, deglycosylation, and degradation of apoE by HepG2 cells. HepG2 cells were radiolabeled with [ 35 S]methionine for 15 min and chased in the presence of unlabeled methionine for 2 h. Chase media containing radiolabeled secreted proteins were incubated with unlabeled HepG2 cells as described in Materials and Methods. Incubations were performed at 37 8 C for the times indicated. Afterwards, apoE was immunoprecipitated from cell lysates (bound apoE) and culture supernatants (unbound apoE) and subjected to SDS-PAGE as described in Materials and Methods. The upper panel shows the phosphorimager analysis of a representative SDS-PAGE gel. The middle panel shows the phosphorimager quantification of all bands of apoE, whereas the lower panel shows a quantification of the non-glycosylated, fastest migrating band of apoE (means 6 SD of three independent experiments). The amount of radiolabeled apoE applied to each well of unlabeled cells (left lane, input) was set to 100%.
Fig. 5 Binding, deglycosylation, and degradation of apoE by HepG2 cells. HepG2 cells were radiolabeled with [ 35 S]methionine for 15 min and chased in the presence of unlabeled methionine for 2 h. Chase media containing radiolabeled secreted proteins were incubated with unlabeled HepG2 cells as described in Materials and Methods. Incubations were performed at 37 8 C for the times indicated. Afterwards, apoE was immunoprecipitated from cell lysates (bound apoE) and culture supernatants (unbound apoE) and subjected to SDS-PAGE as described in Materials and Methods. The upper panel shows the phosphorimager analysis of a representative SDS-PAGE gel. The middle panel shows the phosphorimager quantification of all bands of apoE, whereas the lower panel shows a quantification of the non-glycosylated, fastest migrating band of apoE (means 6 SD of three independent experiments). The amount of radiolabeled apoE applied to each well of unlabeled cells (left lane, input) was set to 100%.CC-BY · From the PDF
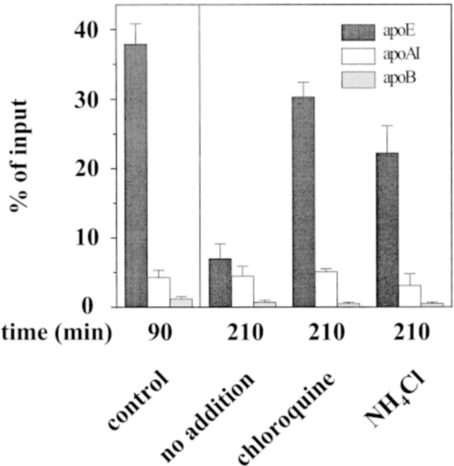
Fig. 6 Inhibition of apoE degradation by lysosomotropic agents. HepG2 cells were radiolabeled with [ 35 S]methionine for 15 min and chased in the presence of unlabeled methionine for 2 h. Chase media containing radiolabeled secreted proteins were incubated with unlabeled HepG2 cells as described in Materials and Methods. Incubations were performed at 37 8 C for the times indicated. After 90 min of incubation, either 100 m m chloroquine or 1 m m NH4Cl was added to the samples as indicated. ApoE, apoA-I, and apoB were immunoprecipitated from cell lysates and culture supernatants and subjected to SDS-PAGE as described in Materials and Methods. The figure shows the phosphorimager quantification of two independent experiments (means 6 SD). All apoE bands were quantified. The amount of radiolabeled apoE applied to each well of unlabeled cells was set to 100%.
Fig. 6 Inhibition of apoE degradation by lysosomotropic agents. HepG2 cells were radiolabeled with [ 35 S]methionine for 15 min and chased in the presence of unlabeled methionine for 2 h. Chase media containing radiolabeled secreted proteins were incubated with unlabeled HepG2 cells as described in Materials and Methods. Incubations were performed at 37 8 C for the times indicated. After 90 min of incubation, either 100 m m chloroquine or 1 m m NH4Cl was added to the samples as indicated. ApoE, apoA-I, and apoB were immunoprecipitated from cell lysates and culture supernatants and subjected to SDS-PAGE as described in Materials and Methods. The figure shows the phosphorimager quantification of two independent experiments (means 6 SD). All apoE bands were quantified. The amount of radiolabeled apoE applied to each well of unlabeled cells was set to 100%.CC-BY · From the PDF
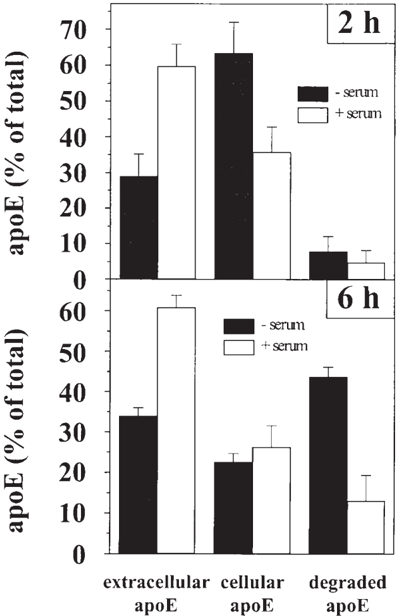
Fig. 7 Enhanced secretion and reduced degradation of apoE in the presence of human serum. HepG2 cells were radiolabeled with [ 35 S]methionine for 10 min and chased in the presence of unlabeled methionine for 2 h (upper panel) or 6 h (lower panel). ApoE was immunoprecipitated from cell lysates (cellular apoE) and culture supernatants (extracellular apoE) and subjected to SDS-PAGE as described in Materials and Methods. The figure shows the phosphorimager quantification of duplicate samples of a representative experiment (means 6 SD). All apoE bands were quantified. The degraded material (degraded apoE) represents the difference between the sum of cellular and secreted apoE after the chase and the amount of apoE after the pulse. The amount of apoE after the pulse was set to 100%.
Fig. 7 Enhanced secretion and reduced degradation of apoE in the presence of human serum. HepG2 cells were radiolabeled with [ 35 S]methionine for 10 min and chased in the presence of unlabeled methionine for 2 h (upper panel) or 6 h (lower panel). ApoE was immunoprecipitated from cell lysates (cellular apoE) and culture supernatants (extracellular apoE) and subjected to SDS-PAGE as described in Materials and Methods. The figure shows the phosphorimager quantification of duplicate samples of a representative experiment (means 6 SD). All apoE bands were quantified. The degraded material (degraded apoE) represents the difference between the sum of cellular and secreted apoE after the chase and the amount of apoE after the pulse. The amount of apoE after the pulse was set to 100%.CC-BY · From the PDF
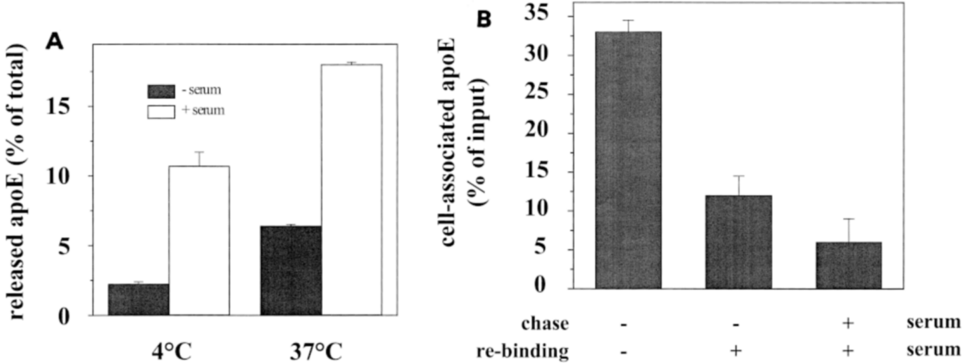
Fig. 8 Influence of human serum on apoE interaction with the cell surface. (A) HepG2 cells were radiolabeled with [ 35 S]methionine for 10 min and chased in the presence of unlabeled methionine for 2 h. Chase medium was discarded and cells were washed with Dulbecco's PBS. Subsequently, cells were chased for another 2 h in RPMI medium in the presence or absence of 10% human serum either at 4 8 C or 37 8 C. ApoE was immunoprecipitated from culture supernatants and subjected to SDS-PAGE as described in Materials and Methods. The figure shows the phosphorimager quantification of two independent experiments (means 6 SD). All apoE bands were quantified. The amount of apoE after the pulse was set to 100%. (B) HepG2 cells were radiolabeled with [ 35 S]methionine for 15 min and chased in the presence of unlabeled methionine for 2 h (chase), either in the presence or absence of 10% human serum. Chase media containing radiolabeled secreted proteins were incubated for 90 min with unlabeled HepG2 cells as described in Materials and Methods (re-binding). The second chase was performed either in the presence or absence of 10% human serum. ApoE immunoprecipitation and detection were performed as described in (A). The amount of radiolabeled apoE applied to each well of unlabeled cells was set to 100%.
Fig. 8 Influence of human serum on apoE interaction with the cell surface. (A) HepG2 cells were radiolabeled with [ 35 S]methionine for 10 min and chased in the presence of unlabeled methionine for 2 h. Chase medium was discarded and cells were washed with Dulbecco's PBS. Subsequently, cells were chased for another 2 h in RPMI medium in the presence or absence of 10% human serum either at 4 8 C or 37 8 C. ApoE was immunoprecipitated from culture supernatants and subjected to SDS-PAGE as described in Materials and Methods. The figure shows the phosphorimager quantification of two independent experiments (means 6 SD). All apoE bands were quantified. The amount of apoE after the pulse was set to 100%. (B) HepG2 cells were radiolabeled with [ 35 S]methionine for 15 min and chased in the presence of unlabeled methionine for 2 h (chase), either in the presence or absence of 10% human serum. Chase media containing radiolabeled secreted proteins were incubated for 90 min with unlabeled HepG2 cells as described in Materials and Methods (re-binding). The second chase was performed either in the presence or absence of 10% human serum. ApoE immunoprecipitation and detection were performed as described in (A). The amount of radiolabeled apoE applied to each well of unlabeled cells was set to 100%.CC-BY · From the PDF
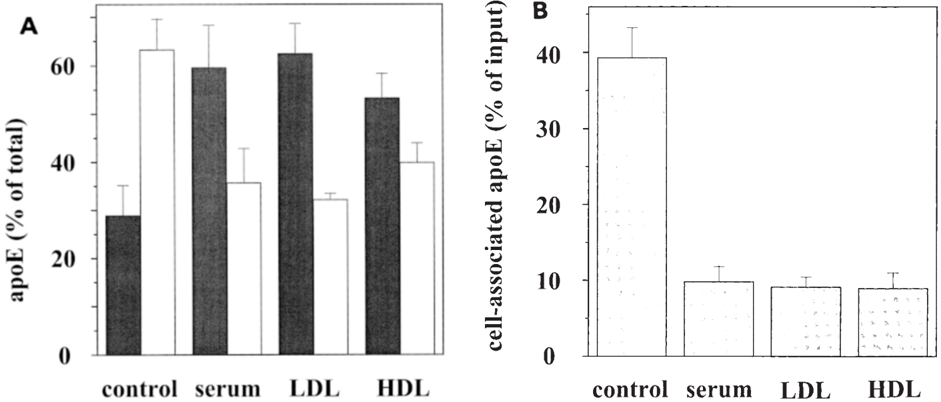
Fig. 9 The effect of isolated human LDL and HDL on apoE secretion and binding to HepG2 cells. (A) HepG2 cells were radiolabeled with [ 35 S]methionine for 10 min and chased in the presence of unlabeled methionine for 2 h in the presence or absence of either 10% human serum, 100 m g/ml isolated human LDL, or 10 m g/ml isolated human HDL. ApoE was immunoprecipitated from cell lysates (white bars) and culture supernatants (black bars) and subjected to SDS-PAGE as described in Materials and Methods. The figure shows the phosphorimager quantification of two independent experiments (means 6 SD). All apoE bands were quantified. The amount of apoE after the pulse was set to 100%. (B) HepG2 cells were radiolabeled with [ 35 S]methionine for 15 min and chased in the presence of unlabeled methionine for 2 h in the presence or absence of 10% human serum, 100 m g/ml isolated human LDL, or 10 m g/ml isolated human HDL. The obtained chase media containing radiolabeled secreted proteins were incubated for 90 min with unlabeled HepG2 cells as described in Materials and Methods. ApoE immunoprecipitation and detection were performed as described in (A). The amount of radiolabeled apoE applied to each well of unlabeled cells was set to 100%.
Fig. 9 The effect of isolated human LDL and HDL on apoE secretion and binding to HepG2 cells. (A) HepG2 cells were radiolabeled with [ 35 S]methionine for 10 min and chased in the presence of unlabeled methionine for 2 h in the presence or absence of either 10% human serum, 100 m g/ml isolated human LDL, or 10 m g/ml isolated human HDL. ApoE was immunoprecipitated from cell lysates (white bars) and culture supernatants (black bars) and subjected to SDS-PAGE as described in Materials and Methods. The figure shows the phosphorimager quantification of two independent experiments (means 6 SD). All apoE bands were quantified. The amount of apoE after the pulse was set to 100%. (B) HepG2 cells were radiolabeled with [ 35 S]methionine for 15 min and chased in the presence of unlabeled methionine for 2 h in the presence or absence of 10% human serum, 100 m g/ml isolated human LDL, or 10 m g/ml isolated human HDL. The obtained chase media containing radiolabeled secreted proteins were incubated for 90 min with unlabeled HepG2 cells as described in Materials and Methods. ApoE immunoprecipitation and detection were performed as described in (A). The amount of radiolabeled apoE applied to each well of unlabeled cells was set to 100%.CC-BY · From the PDF

Verification

Claims the paper makes

The claims and statistics of this paper haven’t been checked yet.

Run the check — free, no account needed. It reads the open-access text and checks the sources it cites.

A few free checks a day · papers already verified open instantly · results are public

Claims other papers make about this one

Each is checked against this paper’s own text: does it say what the citing paper says it does?

Self-check

Percentages, sums and reported differences re-computed from the paper’s own numbers.

The self-check needs the paper’s full text.

Citations

Cites

Research works printed but not linked: 60

  1. Mahley, 1988, Apolipoprotein E: cholesterol transport protein with expanding role in cell biology, Science, 240, 622, 10.1126/science.3283935 · DOI · Paper page
  2. St. Clair, 1997, What do all the apolipoprotein E receptors do?, Curr. Opin. Lipidol., 8, 243, 10.1097/00041433-199710000-00001 · DOI
  3. Gianturco, 1983, Apolipoprotein E mediates uptake of Sf 100–400 hypertriglyceridemic very low density lipoproteins by the low density lipoprotein receptor pathway in normal human fibroblasts, J. Biol. Chem., 258, 4526, 10.1016/S0021-9258(18)32655-3 · DOI
  4. Mahley, 1983, Lipoprotein receptors and cholesterol homeostasis, Biochim. Biophys. Acta., 737, 197, 10.1016/0304-4157(83)90001-1 · DOI
  5. Beisiegel, 1989, The LDL-receptor-related protein, LRP, is an apolipoprotein E-binding protein, Nature, 341, 162, 10.1038/341162a0 · DOI
  6. Jingami, 1995, The VLDL-receptor: wayward brother of the LDL-receptor, Curr. Opin. Lipidol., 6, 104, 10.1097/00041433-199504000-00008 · DOI
  7. Yamamoto, 1996, Close encounters with apoE receptors, Curr. Opin. Lipidol., 7, 298, 10.1097/00041433-199610000-00007 · DOI
  8. Wu, 1979, Relative contributions by liver and intestine to individual plasma apolipoproteins, J. Biol. Chem., 254, 7316, 10.1016/S0021-9258(18)50321-5 · DOI
  9. Williams, 1985, Synthesis of apolipoprotein E by peripheral tissues: potential functions in reverse cholesterol transport and cellular cholesterol metabolism, Ann. NY Acad. Sci., 454, 222, 10.1111/j.1749-6632.1985.tb11861.x · DOI
  10. Lin, 1986, Immunoreactive apolipoprotein E is a widely distributed cellular protein: immunohistochemical localization of apolipoprotein E in baboon tissues, J. Clin. Invest., 78, 947, 10.1172/JCI112685 · DOI
  11. Basu, 1983, Independent pathways for cholesterol and apolipoprotein E by macrophages, Science, 219, 871, 10.1126/science.6823554 · DOI
  12. Zannis, 1984, Synthesis, intracellular processing, and signal peptide of human apolipoprotein E, J. Biol. Chem., 259, 5495, 10.1016/S0021-9258(18)91039-2 · DOI
  13. Zannis, 1986, Intracellular modifications of human apolipoprotein E, J. Biol. Chem., 261, 13415, 10.1016/S0021-9258(18)67033-4 · DOI
  14. Zannis, 1986, Intra- and extracellular modifications of apolipoproteins, Methods Enzymol., 128, 690, 10.1016/0076-6879(86)28100-8 · DOI
  15. Dory, 1991, Regulation of apolipoprotein E secretion by high density lipoprotein3 in mouse macrophages, J. Lipid Res., 32, 783, 10.1016/S0022-2275(20)42030-9 · DOI
  16. Ye, 1992, Human plasma lipoproteins regulate apolipoprotein E secretion from a post-Golgi compartment, J. Biol. Chem., 267, 21961, 10.1016/S0021-9258(19)36706-7 · DOI
  17. Lilly-Stauderman, 1993, Heparin releases newly synthesized cell surface-associated apolipoprotein E from HepG2 cells, J. Lipid Res., 34, 190, 10.1016/S0022-2275(20)40746-1 · DOI
  18. Hamilton, 1990, Apolipoprotein E localization in rat hepatocytes by immunogold labeling of cryothin sections, J. Lipid Res., 31, 1589, 10.1016/S0022-2275(20)42343-0 · DOI · Paper page
  19. Leblond, 1993, Uptake of high density lipoprotein cholesterol ester by HepG2 cells involves apolipoprotein E localized on the cell surface, J. Biol. Chem., 268, 1670, 10.1016/S0021-9258(18)53904-1 · DOI
  20. Dahan, 1994, Concentration of intracellular hepatic apolipoprotein E in Golgi apparatus saccular distensions and endosomes, J. Cell Biol., 127, 1859, 10.1083/jcb.127.6.1859 · DOI
  21. Han, 1994, Apolipoprotein E is localized to the cytoplasm of human cortical neurons: a light and electron microscopic study, J. Neuropathol. Exp. Neurol., 53, 535, 10.1097/00005072-199409000-00013 · DOI · Paper page
  22. Ji, 1993, Role of heparan sulfate proteoglycans in the binding and uptake of apolipoprotein E-enriched remnant lipoproteins by cultured cells, J. Biol. Chem., 268, 10160, 10.1016/S0021-9258(18)82186-X · DOI · Paper page
  23. Rusinol, 1994, A unique mitochondria-associated membrane fraction from rat liver has a high capacity for lipid synthesis and contains pre-Golgi secretory proteins including nascent lipoproteins, J. Biol. Chem., 269, 27494, 10.1016/S0021-9258(18)47012-3 · DOI
  24. Shimano, 1994, Secretion–recapture process of apolipoprotein E in hepatic uptake of chylomicron remnants in transgenic mice, J. Clin. Invest., 93, 2215, 10.1172/JCI117218 · DOI
  25. Deng, 1995, Lysosomal degradation and sorting of apolipoprotein E in macrophages, J. Lipid Res., 36, 2129, 10.1016/S0022-2275(20)39197-5 · DOI
  26. Deng, 1997, Investigation of plasma membrane-associated apolipoprotein E in primary macrophages, J. Lipid Res., 38, 217, 10.1016/S0022-2275(20)37435-6 · DOI · Paper page
  27. Lucas, 1996, Cell surface proteoglycans modulate net synthesis and secretion of macrophage apolipoprotein E, J. Biol. Chem., 271, 13454, 10.1074/jbc.271.23.13454 · DOI
  28. Wong, 1989, Contribution of endosomes to intrahepatic distribution of apolipoprotein B and apolipoprotein E, J. Cell. Physiol., 141, 441, 10.1002/jcp.1041410227 · DOI
  29. Krisans, 1992, The role of peroxisomes in cholesterol metabolism, Am. J. Respir. Cell Mol. Biol., 7, 358, 10.1165/ajrcmb/7.4.358 · DOI
  30. Schwiegelshohn, 1995, Effects of apoprotein E on intracellular metabolism of model triglyceride-rich particles are distinct from effects on cell particle uptake, J. Biol. Chem., 270, 1761, 10.1074/jbc.270.4.1761 · DOI
  31. Mazzone, 1992, Post-translational regulation of macrophage apoprotein E production, J. Biol. Chem., 267, 1081, 10.1016/S0021-9258(18)48398-6 · DOI
  32. Ye, 1993, Inhibition of apolipoprotein E degradation in a post-Golgi compartment by a cysteine protease inhibitor, J. Biol. Chem., 268, 8497, 10.1016/S0021-9258(18)52902-1 · DOI
  33. Duan, 1997, Degradation of macrophage apoE in a nonlysosomal compartment. Regulation by sterols, J. Biol. Chem., 272, 31156, 10.1074/jbc.272.49.31156 · DOI
  34. Brown, 1991, The low-density lipoprotein receptor-related protein: double agent or decoy?, Curr. Opin. Lipidol., 2, 65, 10.1097/00041433-199104000-00002 · DOI
  35. Mahley, 1991, Chylomicron and chylomicron remnant metabolism, Curr. Opin. Lipidol., 2, 170, 10.1097/00041433-199106000-00005 · DOI
  36. Mahley, 1994, Role of heparan sulfate proteoglycans and the LDL-receptor-related protein in remnant lipoprotein metabolism, Ann. NY Acad. Sci., 737, 39, 10.1111/j.1749-6632.1994.tb44300.x · DOI
  37. Cooper, 1997, Hepatic uptake of chylomicron remnants, J. Lipid Res., 38, 2173, 10.1016/S0022-2275(20)34932-4 · DOI · Paper page
  38. Willnow, 1997, Mechanisms of hepatic chylomicron remnant clearance, Diabetic Med., 14, 75, 10.1002/(SICI)1096-9136(199708)14:3+<S75::AID-DIA449>3.0.CO;2-9 · DOI
  39. Ji, 1994, Secretion–capture role for apolipoprotein E in remnant lipoprotein metabolism involving cell surface heparan sulfate proteoglycans, J. Biol. Chem., 269, 2764, 10.1016/S0021-9258(17)42009-6 · DOI
  40. Willnow, 1994, Inhibition of hepatic chylomicron remnant uptake by gene transfer of a receptor antagonist, Science, 264, 1471, 10.1126/science.7515194 · DOI
  41. Ji, 1995, Intravenous heparinase inhibits remnant lipoprotein clearance from the plasma and uptake by the liver: in vivo role of heparan sulfate proteoglycans, J. Lipid Res., 36, 583, 10.1016/S0022-2275(20)39892-8 · DOI
  42. Knowles, 1980, Human hepatocellular carcinoma cell lines secrete the major plasma proteins and hepatitis B surface antigen, Science, 209, 497, 10.1126/science.6248960 · DOI
  43. Laemmli, 1970, Cleavage of structural proteins during the assembly of the head of bacteriophage T4, Nature, 227, 680, 10.1038/227680a0 · DOI · Paper page
  44. Noel, 1979, Secretion of cholesterol-rich lipoproteins by perfused livers of hypercholesterolemic rats, J. Clin. Invest., 64, 674, 10.1172/JCI109508 · DOI
  45. Krul, 1981, Secretion of nascent lipoproteins by isolated rat hepatocytes, Can. J. Biochem., 59, 676, 10.1139/o81-094 · DOI
  46. Davis, 1989, Increased translatable mRNA and decreased lipogenesis are responsible for the augmented secretion of lipid-deficient apolipoprotein E by hepatocytes from fasted rats, J. Biol. Chem., 264, 8970, 10.1016/S0021-9258(18)81889-0 · DOI
  47. Tam, 1992, The effect of 25-hydroxycholesterol on the regulation of apolipoprotein E mRNA levels and secretion in the human hepatoma HepG2, Atherosclerosis, 95, 137, 10.1016/0021-9150(92)90017-B · DOI
  48. Fazio, 1992, Synthesis and secretion of apolipoprotein E occur independently of synthesis and secretion of apolipoprotein B-containing lipoproteins in HepG2 cells, J. Biol. Chem., 267, 6941, 10.1016/S0021-9258(19)50519-1 · DOI
  49. Brown, 1986, A receptor-mediated pathway for cholesterol homeostasis, Science, 232, 34, 10.1126/science.3513311 · DOI · Paper page
  50. Fuki, 1997, The syndecan family of proteoglycans. Novel receptors mediating internalization of atherogenic lipoproteins in vitro, J. Clin. Invest., 100, 1611, 10.1172/JCI119685 · DOI · Paper page
  51. Al-Haideri, 1997, Heparan sulfate proteoglycan-mediated uptake of apolipoprotein E–triglyceride-rich lipoprotein particles: a major pathway at physiological particle concentrations, Biochemistry, 36, 12766, 10.1021/bi9631024 · DOI
  52. Sasaki, 1990, Inhibitory effect of di- and tripeptidyl aldehydes on calpains and cathepsins, J. Enzyme Inhib., 3, 195, 10.3109/14756369009035837 · DOI
  53. Rock, 1994, Inhibitors of the proteasome block the degradation of most cell proteins and the generation of peptides presented on MHC class I molecules, Cell, 78, 761, 10.1016/S0092-8674(94)90462-6 · DOI · Paper page
  54. Goldstein, 1974, Binding and degradation of low density lipoproteins by cultured human fibroblasts. Comparison of cells from a normal subject and from a patient with homozygous familial hypercholesterolemia, J. Biol. Chem., 249, 5153, 10.1016/S0021-9258(19)42341-7 · DOI · Paper page
  55. Benoist, 1997, Co-translational degradation of apolipoprotein B-100 by the proteasome is prevented by microsomal triglyceride transfer protein. Synchronized translation studies on HepG2 cells treated with an inhibitor of microsomal triglyceride transfer protein, J. Biol. Chem., 272, 20435, 10.1074/jbc.272.33.20435 · DOI
  56. Fisher, 1997, The degradation of apolipoprotein B-100 is mediated by the ubiquitin-proteasome pathway and involves heat shock protein 70, J. Biol. Chem., 272, 20427, 10.1074/jbc.272.33.20427 · DOI
  57. Benoist, 1996, Microsomal triacylglycerol transfer protein prevents presecretory degradation of apolipoprotein B-100. A dithiothreitol-sensitive protease is involved, Eur. J. Biochem., 240, 713, 10.1111/j.1432-1033.1996.0713h.x · DOI
  58. Boisvert, 1995, Treatment of severe hypercholesteremia in apolipoprotein E-deficient mice by bone marrow transplantation, J. Clin. Invest., 96, 1118, 10.1172/JCI118098 · DOI
  59. Linton, 1995, Prevention of atherosclerosis in apoE-deficient mice by bone marrow transplantation, Science, 267, 1034, 10.1126/science.7863332 · DOI · Paper page
  60. Linton, 1998, Hepatic apoE expression is required for remnant lipoprotein clearance in the absence of the low density lipoprotein receptor, J. Clin. Invest., 101, 1726, 10.1172/JCI2181 · DOI · Paper page

Cited by

Sorted by citations

See all 14

Metadata

Authors
Schmitt, M., & Grand-Perret, T.
Venue
Journal of Lipid Research
Publisher
Elsevier BV
Published
1999-01
Volume
40
Issue
1
Pages
39-49
ISSN
0022-2275
Cited by
14
References
3
Language
en

About these checks

Registry, retraction, Cites and statistics results are computed, not judged, with one exception: a printed reference that no index lists is read once by a model before it counts as a citation error. Claims are extracted by a model and kept only when their quote appears verbatim in the text; each cited source is then checked, with a model’s help, for whether it says what the claim relies on. Those verdicts can be wrong — read the claim’s quote and the cited source before relying on one.

Statistics and arithmetic are recomputed, not judged.

Confidence bands are shown only for fields calibrated on our annotated test set. None is calibrated yet, so no band is shown.

What counts as a claim ›How we measure confidence ›How we check this ›

Are you an author, or do you see a problem with this page? Request a review