

The DOI matches its Crossref record; 271 of the 274 references it cites were found in a registry or an index.
High-quality health systems in the Sustainable Development Goals era: time for a revolution
Open accessAbstract
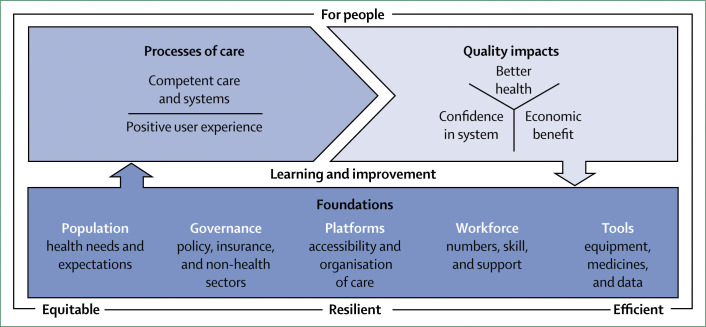
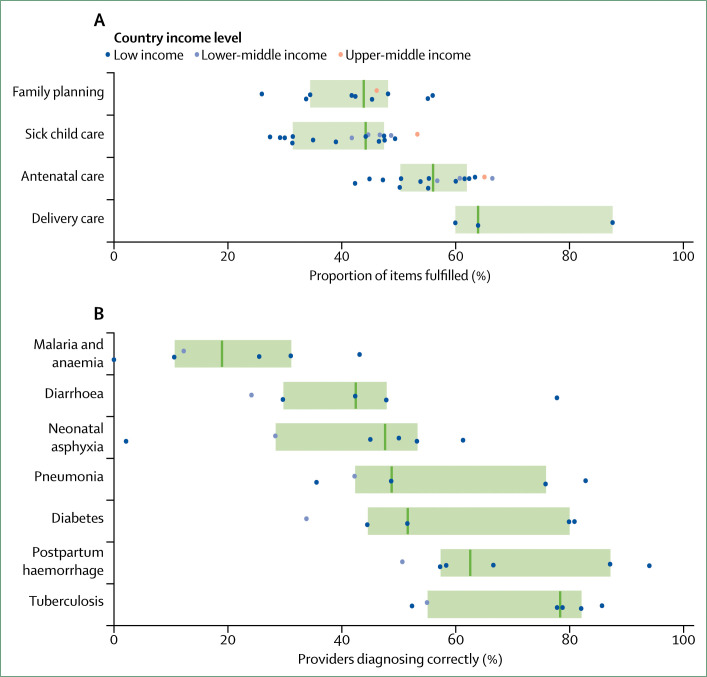
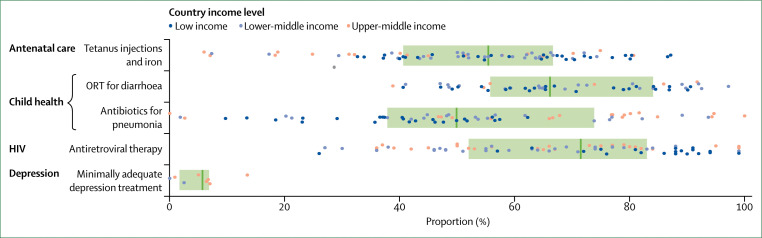
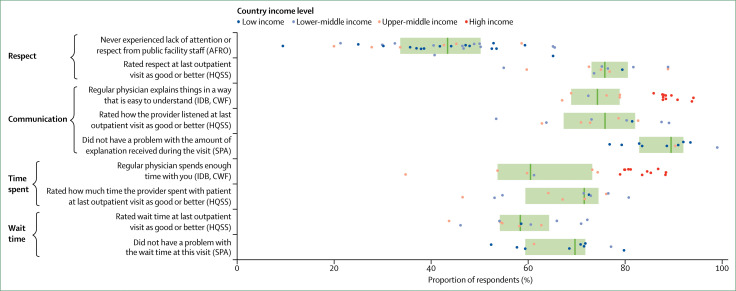
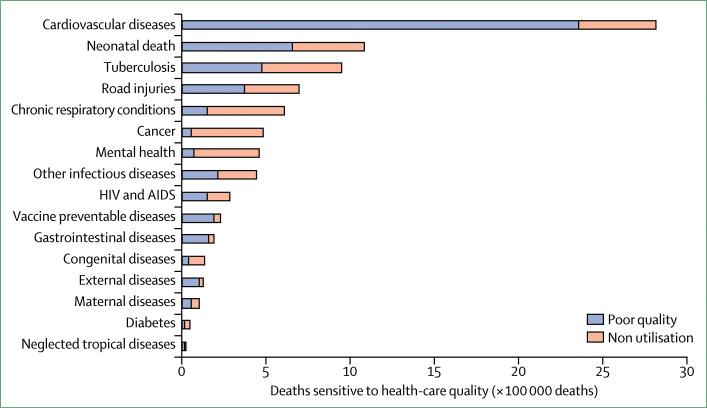
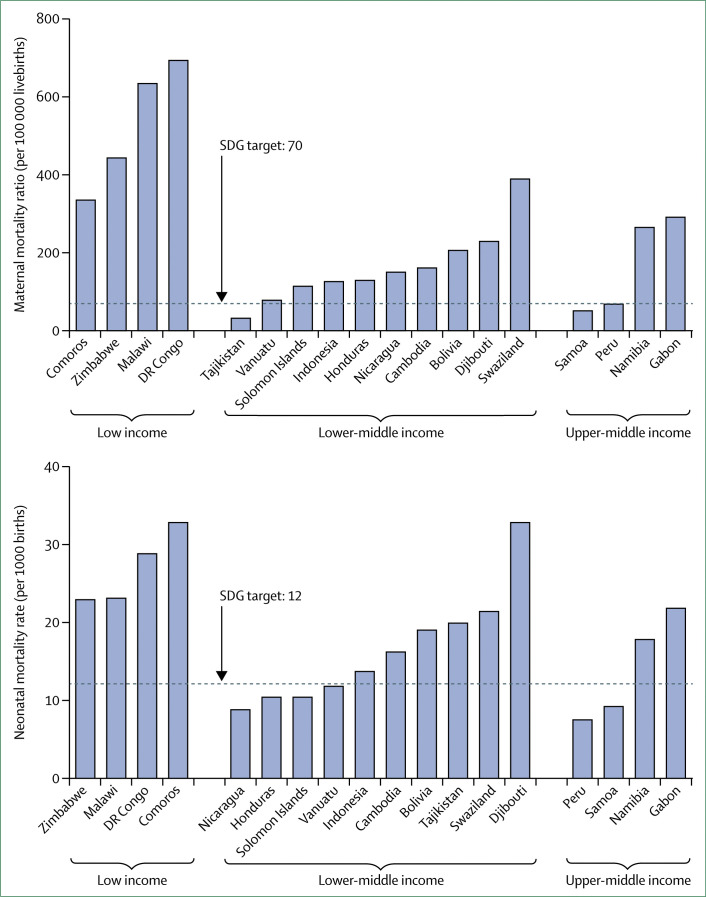
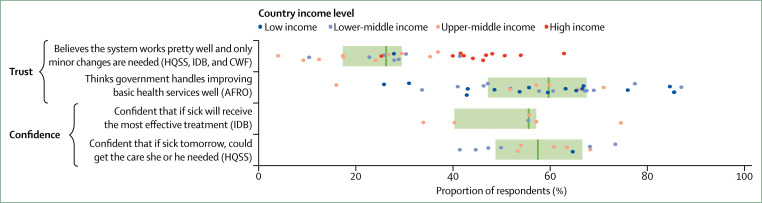
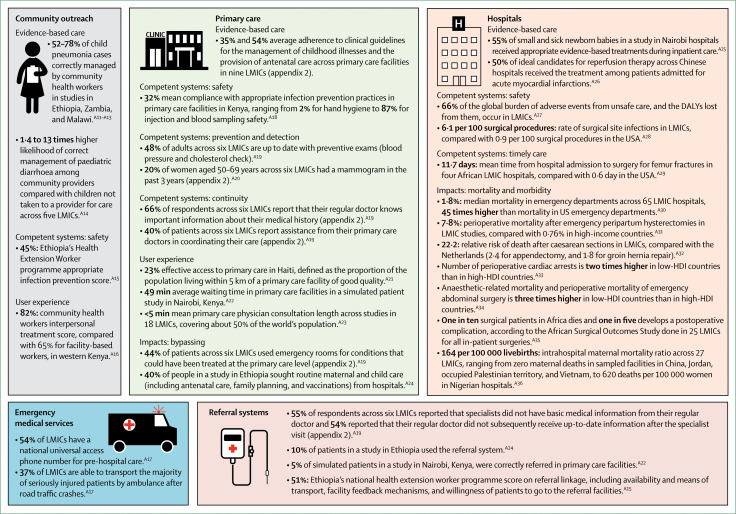
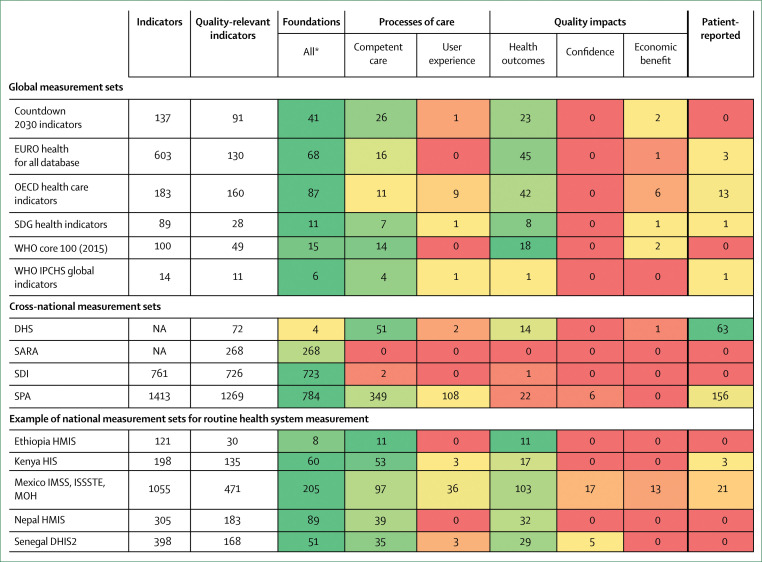
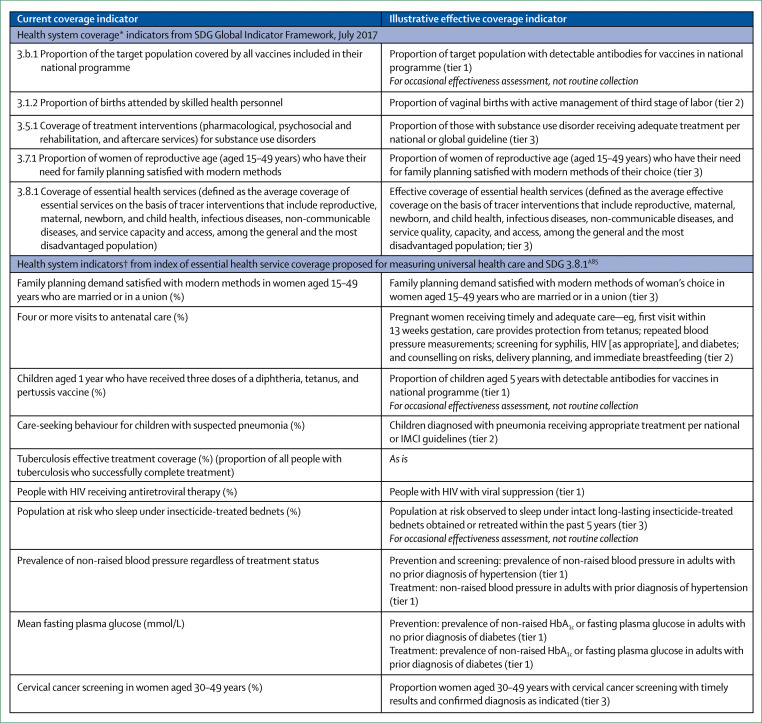
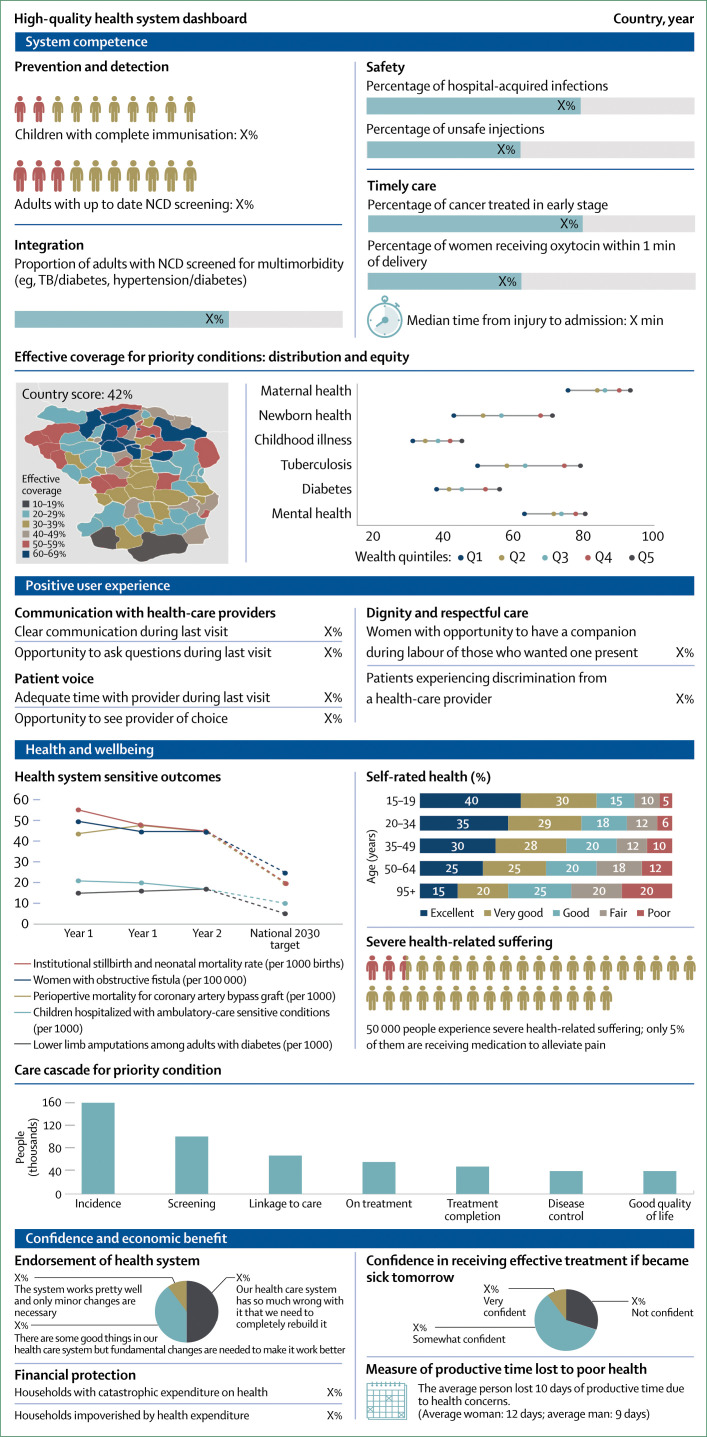
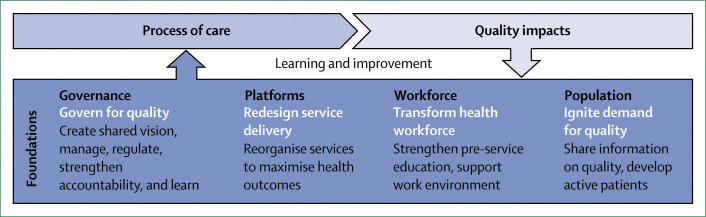
deaths from cardio vascular disease, 1 million newborn deaths, 900 000 deaths from tubercu losis, and half of all maternal deaths each year.Quality of care will become an even larger driver of population health as utilisation of health systems increases and as the burden of disease shifts to more complex conditions.The high mortality rates in LMICs for treatable causes, such as injuries and surgical con ditions, maternal and newborn complications, cardio vascular disease, and vaccine preventable diseases, illustrate the breadth and depth of the healthcare quality challenge.Poor-quality care can lead to other adverse outcomes, including un necessary health-related suffering, persistent symptoms, loss of function, and a lack of trust and confidence in health systems.Waste of resources and catastrophic expenditures are economic side effects of poor-quality health systems.As a result of this, only one-quarter of people in LMICs believe that their health systems work well. Health systems should measure and report what matters most to people, such as competent care, user experience, health outcomes, and confidence in the systemMeasurement is key to accountability and improvement, but available measures do not capture many of the processes and outcomes that matter most to people.At the same time, data systems generate many metrics that produce inadequate insight at a substantial cost in funds and health workers' time.For example, although inputs such as medicines and equipment are commonly counted in surveys, these are weakly related to the quality of care that people receive.Indicators such as proportion of births with skilled attendants do not reflect quality of childbirth care and might lead to false complacency about progress in maternal and newborn health.This Commission calls for fewer, but better, measures of health system quality to be generated and used at national and subnational levels.Countries should report health system performance to the public annually by use of a dashboard of key metrics (eg, health outcomes, people's confidence in the system, system competence, and user experience) along with measures of financial protection and equity.Robust vital registries and trust worthy routine health information systems are prerequi sites for good performance assessment.Countries need agile new surveys and real-time measures of health facilities and populations that reflect the health systems of today and not those of the past.To generate and interpret data, countries need to invest in national institutions and professionals with strong quantitative and analytical skills.Global develop ment partners can support the generation and testing of public goods for health system measurement (civil and vital registries, routine data systems, and routine health system surveys) and promote national and regional institutions and the training and mentoring of scientists. New research is crucial for the transformation of low-quality health systems to high-quality onesData on care quality in LMICs do not reflect the current disease burden.In many of these countries, we know little about quality of care for respiratory diseases, cancer, mental health, injuries, and surgery, as well as the care of adolescents and elderly people.There are vast blind spots in areas such as user experience, system competence, confidence in the system, and the wellbeing of people, including patient-reported outcomes.Measuring the quality of the health system as a whole and across the care continuum is essential, but not done.Filling in these gaps will require not only better routine health information systems for monitoring, but also new research, as proposed in the research agenda of this Commission.For example, research will be needed to rigorously evaluate the effects and costs of recommended improvement approaches on health, patient experience, and financial protection.Implementation science studies can help discern the contextual factors that promote or hinder reform.New data collection and research should be explicitly designed to build national and regional research capacity. Improving quality of care will require system-wide actionTo address the scale and range of quality deficits we documented in this Commission, reforming the foundations of the health system is required.Because health systems are complex adaptive systems that function at multiple interconnected levels, fixes at the micro-level (ie, health-care provider or clinic) alone are unlikely to alter the underlying performance of the whole system.However, we found that interventions aimed at changing provider behaviour dominate the improvement field, even though many of these interventions have a modest effect on provider performance and are difficult to scale and sustain over time.Achieving high-quality health systems requires expanding the space for improvement to structural reforms that act on the foundations of the system.This Commission endorses four universal actions to
Overview
The claims and statistics of this paper haven’t been checked yet.
Run the check — free, no account needed. It reads the open-access text and checks the sources it cites.
Integrity signals
Registry
Cites
Statistics
Figures
Verification
Claims the paper makes
The claims and statistics of this paper haven’t been checked yet.
Run the check — free, no account needed. It reads the open-access text and checks the sources it cites.
Claims other papers make about this one
Each is checked against this paper’s own text: does it say what the citing paper says it does?
The source backs part of the claim, not all of it — or backs it for a different population, condition or comparison.
In the citing paper
“Evidence has shown that a robust PHC system can improve population health outcomes, reduce all-cause mortality and is cost-effective in achieving UHC in LMICs [44–46].”
From Assessment of the compliance with minimum quality standards by public primary healthcare facilities in Nigeria (2024) · cites this paper as [46]
Experimental — accuracy not yet measuredThe cited source says what the claim attributes to it.
In the citing paper
“On the one hand, this sector is essential to the achievement of the United Nations Sustainable Development Goal (UNSDG) “Good health and well-being” and related goals [9].”
From Towards Green and Sustainable Healthcare: A Literature Review and Research Agenda for Green Leadership in the Healthcare Sector (2023) · cites this paper as [9]
The cited source says what the claim attributes to it.
In the citing paper
“The use of available health services results from the confluence of both demand (patient) and supply (health service) side factors [5].”
From Community and facility-level barriers to achieving UHC in Kono District, Sierra Leone and Maryland County, Liberia (2023) · cites this paper as [5]
In the citing paper
“Actions to promote and measure health system quality could be readily aligned and embedded within a modular approach.134”
From Global health 2050: the path to halving premature death by mid-century (2024) · cites this paper as [134]
In the citing paper
“However, changes in health care needs owing to increased mortality from complex NCDs require high-quality, longitudinal, and integrated care (6).”
From Artificial intelligence for global health (2019) · cites this paper as [6]
Self-check
Percentages, sums and reported differences re-computed from the paper’s own numbers.
The self-check needs the paper’s full text.
Citations
Cites
1 retracted
Li, J., Li, X., Wang, Q., Hu, S., Wang, Y., Masoudi, F. A., Spertus, J. A., Krumholz, H. M., & Jiang, L. (2014) · The Lancet · doi:10.1016/s0140-6736(14)60921-1 · Cited by 432
Self-citationRetractedInstitute of Medicine (2000) · National Academies Press eBooks · doi:10.17226/9728 · Cited by 14,390
Lozano, R., Naghavi, M., Foreman, K., Lim, S., Shibuya, K., Aboyans, V., Abraham, J., Adair, T., Aggarwal, R., Ahn, S. Y., et al. (2012) · The Lancet · doi:10.1016/s0140-6736(12)61728-0 · Cited by 14,070
Nudge: improving decisions about health, wealth, and happiness
(2008) · Choice Reviews Online · doi:10.5860/choice.46-0977 · Cited by 11,624
Crossing the Quality Chasm: A New Health System for the 21st Century
Baker, A. (2001) · BMJ · doi:10.1136/bmj.323.7322.1192 · Cited by 10,779
Allemani, C., Matsuda, T., Di Carlo, V., Harewood, R., Matz, M., Nikšić, M., Bonaventure, A., Valkov, M., Johnson, C. J., Estève, J., et al. (2018) · The Lancet · doi:10.1016/s0140-6736(17)33326-3 · Cited by 6,145
Evaluating the quality of medical care
DONABEDIAN, A. (2005) · The Milbank Quarterly · doi:10.1111/j.1468-0009.2005.00397.x · Cited by 6,102
Frenk, J., Chen, L., Bhutta, Z. A., Cohen, J., Crisp, N., Evans, T., Fineberg, H., Garcia, P., Ke, Y., Kelley, P., et al. (2010) · The Lancet · doi:10.1016/s0140-6736(10)61854-5 · Cited by 5,960
Porter, M. E. (2010) · New England Journal of Medicine · doi:10.1056/nejmp1011024 · Cited by 5,084
Evaluating the Quality of Medical Care
Donabedian, A. (1966) · The Milbank Memorial Fund Quarterly · doi:10.2307/3348969 · Cited by 4,418
Research works printed but not linked: 3
- Cisneros-González, 2016, Índice de amputaciones de extremidades inferiores en pacientes con diabetes, Rev Med Inst Mex Seguro Soc, 54, 472
- Jordan K, Marten R, Gureje O, Daelmans B, Kruk ME. Where is quality in health systems policy? A commentary on global policy documents. Lancet Glob Health (in press).
- Akhtar, 2011, Health care regulation in low-and middle income countries: a review of the literature, Health Policy and Health Finance Knowledge Hub: Working Paper Series
Cited by
Sorted by citations
Items 401–500 of 1,003
Okesanya, O. J., Amisu, B. O., Adigun, O. A., Ahmed, M. M., Agboola, A. O., Kab, T., Eshun, G., Ukoaka, B. M., Oso, T. A., Ogaya, J. B., et al. (2025) · Tropical Diseases Travel Medicine and Vaccines · doi:10.1186/s40794-024-00236-x · Cited by 33
An aspirational approach to planetary futures
Ellis, E. C., Malhi, Y. S., Ritchie, H., Montana, J., Díaz, S. M., Obura, D. O., Clayton, S., Leach, M., Pereira, L. M., Marris, E., et al. (2025) · Nature · doi:10.1038/s41586-025-09080-1 · Cited by 37
Howard, I. L., Cameron, P. A., Wallis, L. A., Castrén, M. K., & Lindström, V. (2019) · African Journal of Emergency Medicine · doi:10.1016/j.afjem.2019.07.003 · Cited by 36
Agins, B., Ikeda, D. J., Reid, M. J. A., Goosby, E., Pai, M., & Cattamanchi, A. (2019) · The Lancet Infectious Diseases · doi:10.1016/s1473-3099(19)30420-7 · Cited by 31
Oliwa, J. N., Gathara, D., Ogero, M. O., van Hensbroek, M. B., English, M., & Hoog, A. H. V. (2019) · PLoS ONE · doi:10.1371/journal.pone.0221145 · Cited by 30
Self-citationArsenault, C., English, M., Gathara, D., Malata, A. M., Mandala, W. L., & Kruk, M. E. (2019) · Tropical Medicine & International Health · doi:10.1111/tmi.13361 · Cited by 30
Self-citationHealth system quality in the time of COVID-19
Roder‐DeWan, S. (2020) · The Lancet Global Health · doi:10.1016/s2214-109x(20)30223-0 · Cited by 30
Self-citationWeldearegay, H. G., Kahsay, A. B., Medhanyie, A. A., Godefay, H., & Petrucka, P. M. (2020) · PLoS ONE · doi:10.1371/journal.pone.0234318 · Cited by 30
Jumbam, D. T., Menon, G., Lama, T. N., Lodge, W., Maongezi, S., Kapologwe, N., Citron, I., Barash, D. M., Varallo, J. E., Barringer, E., et al. (2020) · BMC Health Services Research · doi:10.1186/s12913-020-05559-x · Cited by 30
Networks of Care in Rural Madagascar for Achieving Universal Health Coverage in Ifanadiana District
Cordier, L., Kalaris, K., Rakotonanahary, R. J. L., Rakotonirina, L., Haruna, J., Mayfield, A., Marovavy, L., McCarty, M. G., Aina, A. T., Ratsimbazafy, B. N., et al. (2020) · Health Systems & Reform · doi:10.1080/23288604.2020.1841437 · Cited by 30
Ansbro, É., Homan, T., Prieto‐Merino, D., Jobanputra, K., Qasem, J., Shoaib, M., Fardous, T., & Perel, P. (2021) · PLoS Medicine · doi:10.1371/journal.pmed.1003279 · Cited by 31
Postabortion care availability, facility readiness and accessibility in Nigeria and Côte d’Ivoire
Bell, S. O., Shankar, M., Ahmed, S., OlaOlorun, F. M., Omoluabi, E., Guiella, G., & Moreau, C. (2021) · Health Policy and Planning · doi:10.1093/heapol/czab068 · Cited by 31
Kowalsky, T. O., Morilla, R., & Cerrillo, I. (2022) · Nutrients · doi:10.3390/nu14050928 · Cited by 30
Moller, A., Welsh, J., Ayebare, E. O., Chipeta, E. K., Groß, M. M., Houngbo, G., Hounkpatin, H., Kandeya, B., Mwilike, B. E., Nalwadda, G. K., et al. (2022) · PLOS Global Public Health · doi:10.1371/journal.pgph.0000605 · Cited by 30
White, M. C., Daya, L., Karel, F. K. B., White, G., Abid, S., Fitzgerald, A., Mballa, G. A. E., Sevdalis, N., & Leather, A. J. M. (2019) · Anesthesia & Analgesia · doi:10.1213/ane.0000000000004586 · Cited by 30
Towards high‐quality peri‐operative care: a global perspective
Santhirapala, V., Peden, C. J., Meara, J. G., Biccard, B. M., Gelb, A. W., Johnson, W. D., Lipnick, M. S., Makasa, E. M. M., Martin, J. E., Maswime, S., et al. (2020) · Anaesthesia · doi:10.1111/anae.14921 · Cited by 30
Self-citationMunar, W. A., Snilstveit, B., Aranda, L. E., Biswas, N., Baffour, T., & Stevenson, J. (2019) · BMJ Global Health · doi:10.1136/bmjgh-2019-001451 · Cited by 33
Beecher, C., Greene, R., O’Dwyer, L., Ryan, E., White, M., Beattie, M., & Devane, D. (2021) · Women and Birth · doi:10.1016/j.wombi.2020.05.002 · Cited by 29
Hennein, R., Ggita, J. M., Turimumahoro, P., Ochom, E., Gupta, A. J., Katamba, A., Armstrong-Hough, M. J., & Davis, J. L. (2022) · Implementation Science Communications · doi:10.1186/s43058-022-00279-1 · Cited by 34
Yakubu, K., Shanthosh, J., Adebayo, K. O., Peiris, D., & Joshi, R. (2023) · PLOS Global Public Health · doi:10.1371/journal.pgph.0000717 · Cited by 39
From Awareness to Action: A Review of Efforts to Reduce Disparities in Breast Cancer Screening
Nayyar, S., Chakole, S. V., Taksande, A. B., Prasad, R., Munjewar, P. K., & Wanjari, M. B. (2023) · Cureus · doi:10.7759/cureus.40674 · Cited by 29
Improving measurement of tuberculosis care cascades to enhance people-centred care
Faust, L., Naidoo, P., Caceres-Cardenas, G., Ugarte‐Gil, C., Muyoyeta, M., Kerkhoff, A. D., Nagarajan, K., Satyanarayana, S., Rakotosamimanana, N., Lapierre, S. G., et al. (2023) · The Lancet Infectious Diseases · doi:10.1016/s1473-3099(23)00375-4 · Cited by 29
Organizational Health Behavior Index (OHBI): A Tool for Measuring Organizational Health
Jaafari, M. A., Alzuman, A., Ali, Z., Tantry, A., & Ali, R. (2023) · Sustainability · doi:10.3390/su151813650 · Cited by 34
Exploring Sustainability and Efficiency Improvements in Healthcare: A Qualitative Study
Vasileiou, A., Sfakianaki, E., & Tsekouropoulos, G. (2024) · Sustainability · doi:10.3390/su16198306 · Cited by 38
Singha, C., Bhattacharjee, I., Sahoo, S., Abdelrahman, K. S., Uddin, M. G., Fnais, M. S., Govind, A., & Abioui, M. (2024) · Journal of Environmental Management · doi:10.1016/j.jenvman.2024.122721 · Cited by 29
AI-Driven Telerehabilitation: Benefits and Challenges of a Transformative Healthcare Approach
Calabrò, R. S., & Mojdehdehbaher, S. (2025) · AI · doi:10.3390/ai6030062 · Cited by 37
Mitigating inequitable access to appropriate antibiotics in low- and middle-income countries
Otaigbe, I. I. (2025) · JAC-Antimicrobial Resistance · doi:10.1093/jacamr/dlaf061 · Cited by 31
Quality gap in maternal and newborn healthcare: a cross-sectional study in Myanmar
Okawa, S., Win, H. H., Leslie, H. H., Nanishi, K., Shibanuma, A., Aye, P. P., & Jimba, M. (2019) · BMJ Global Health · doi:10.1136/bmjgh-2018-001078 · Cited by 29
Self-citationLiu, L., Leslie, H. H., Joshua, M., & Kruk, M. E. (2019) · BMJ Open · doi:10.1136/bmjopen-2019-029631 · Cited by 31
Self-citationPatient-experience during delivery in public health facilities in Uttar Pradesh, India
Montagu, D., Landrian, A. S., Kumar, V., Phillips, B. S., Singhal, S., Mishra, S., Singh, S., Cotter, S. Y., Singh, V. P., Kajal, F., et al. (2019) · Health Policy and Planning · doi:10.1093/heapol/czz067 · Cited by 29
García‐Elorrio, E., Arrieta, J., Arce, H. E., Delgado, P., Maria, M. A., Orrego, C., Sofia, R., Sarabia, O., Teresa, T., Hermida, J., et al. (2020) · International Journal for Quality in Health Care · doi:10.1093/intqhc/mzaa062 · Cited by 29
Self-citationGuo, W., Sylvia, S., Umble, K. E., Chen, Y., Zhang, X., & Yi, H. (2020) · The Lancet Regional Health - Western Pacific · doi:10.1016/j.lanwpc.2020.100026 · Cited by 30
Engaging culture and context in mhGAP implementation: fostering reflexive deliberation in practice
Gómez-Carrillo, A., Lencucha, R., Faregh, N., Veissière, S. P. L., & Kirmayer, L. J. (2020) · BMJ Global Health · doi:10.1136/bmjgh-2020-002689 · Cited by 32
Davies, J. I., Reddiar, S. K., Hirschhorn, L. R., Ebert, C. L., Marcus, M. E., Seiglie, J. A., Zhumadilov, Z. S., Supiyev, A., Sturua, L., Bahendeka, S., et al. (2020) · PLoS Medicine · doi:10.1371/journal.pmed.1003268 · Cited by 28
Self-citationAcharya, K. P., Thapa, R., Bhattarai, N., Bam, K., & Shrestha, B. (2020) · BMJ Open · doi:10.1136/bmjopen-2020-040918 · Cited by 29
Jithitikulchai, T., Feldhaus, I., Bauhoff, S., & Nagpal, S. (2020) · Health Policy and Planning · doi:10.1093/heapol/czaa151 · Cited by 29
Gage, A. D., & Bauhoff, S. (2020) · Health Policy and Planning · doi:10.1093/heapol/czaa191 · Cited by 29
Self-citationGuinsburg, R., Sañudo, A., Kiffer, C. R. V., Marinonio, A. S. S., Costa-Nobre, D. T., Areco, K. C. N., Kawakami, M. D., Miyoshi, M. H., Bandiera‐Paiva, P., Balda, R. D. C. X., et al. (2021) · BMC Pediatrics · doi:10.1186/s12887-021-02511-8 · Cited by 29
The Lancet Commission on cancer and health systems: harnessing synergies to achieve solutions
Knaul, F. M., Garcia, P. J., Gospodarowicz, M. K., Essue, B. M., Lee, N., & Horton, R. C. (2021) · The Lancet · doi:10.1016/s0140-6736(21)01895-x · Cited by 29
Khatri, R. B., Durham, J., & Assefa, Y. A. (2021) · Globalization and Health · doi:10.1186/s12992-021-00752-x · Cited by 31
Quality: The missing ingredient in TB care and control
Pai, M., & Temesgen, Z. (2018) · Journal of Clinical Tuberculosis and Other Mycobacterial Diseases · doi:10.1016/j.jctube.2018.12.001 · Cited by 29
Lewis, T. P., Kassa, M., Kapoor, N. R., Arsenault, C., Bazua-Lobato, R., Dayalu, R., Fink, G., Getachew, T., Jarhyan, P., Lee, H., et al. (2023) · The Lancet Global Health · doi:10.1016/s2214-109x(23)00495-3 · Cited by 28
Self-citationHuman resource challenges in health systems: evidence from 10 African countries
Sheffel, A., Andrews, K. G., Conner, R. O., Giorgio, L. D., Evans, D. K., Gatti, R. V., Lindelöw, M., Sharma, J., Svensson, J., Wane, W., et al. (2024) · Health Policy and Planning · doi:10.1093/heapol/czae034 · Cited by 28
Patient safety culture in resource-limited healthcare settings: A multicentre survey
Fekadu, G., Muir, R., Tobiano, G., Bime, A. E., Ireland, M. J., & Marshall, A. P. (2025) · PLoS ONE · doi:10.1371/journal.pone.0326320 · Cited by 28
An LLM chatbot to facilitate primary-to-specialist care transitions: a randomized controlled trial
Tao, X., Zhou, S., Ding, K., Li, S., Li, Y., Wu, B., Huang, Q., Chen, W., Shen, M., Meng, E., et al. (2026) · Nature Medicine · doi:10.1038/s41591-025-04176-7 · Cited by 40
Hategeka, C., Ruton, H., & Law, M. R. (2019) · Global Health Research and Policy · doi:10.1186/s41256-019-0098-y · Cited by 30
The rate and perioperative mortality of caesarean section in Sierra Leone
Holmer, H., Kamara, M. M., Bolkan, H. A., van Duinen, A. J., Conteh, S., Forna, F., Hailu, B., Hansson, S. R., Koroma, A. P., Koroma, M. M., et al. (2019) · BMJ Global Health · doi:10.1136/bmjgh-2019-001605 · Cited by 28
Self-citationAlidina, S., Kuchukhidze, S., Menon, G., Citron, I., Lama, T. N., Meara, J. G., Barash, D. M., Hellar, A. M., Kapologwe, N., Maina, E., et al. (2019) · BMJ Open · doi:10.1136/bmjopen-2019-031800 · Cited by 32
Self-citationAcharya, K., & Paudel, Y. R. (2019) · Journal of Global Health Reports · doi:10.29392/joghr.3.e2019057 · Cited by 30
Quality of Kangaroo Mother Care services in Ethiopia: Implications for policy and practice
Weldearegay, H. G., Medhanyie, A. A., Abrha, M. W., Taddesse, L., Tekle, E., Yakob, B., Girma, T., & Arsenault, C. (2019) · PLoS ONE · doi:10.1371/journal.pone.0225258 · Cited by 28
Self-citationPriorities for peri‐operative research in Africa
Biccard, B. M. (2020) · Anaesthesia · doi:10.1111/anae.14934 · Cited by 28
Cavallaro, F. L., Beňová, L., Dioukhane, E. H., Wong, K. L., Sheppard, P., Faye, A., Radovich, E., Dumont, A., Mbengue, A. S., Ronsmans, C., et al. (2020) · BMJ Global Health · doi:10.1136/bmjgh-2019-001915 · Cited by 28
Mayston, R., Ebhohimen, K., & Jacob, K. (2020) · Epidemiology and Psychiatric Sciences · doi:10.1017/s204579602000030x · Cited by 28
Gathara, D., Zosi, M., Serem, G., Nzinga, J., Murphy, G. A. V., Jackson, D., Brownie, S. M., & English, M. (2020) · Human Resources for Health · doi:10.1186/s12960-020-00470-2 · Cited by 28
Self-citationWade, C., Frazer, J. S., Qian, E., Davidson, L. M., Dash, S. R., Naudé, A. T. W., Ramakrishan, R., Aluvaala, J., Lakhoo, K., & English, M. (2020) · The Lancet Child & Adolescent Health · doi:10.1016/s2352-4642(20)30182-6 · Cited by 28
Self-citationCohen, J. L., Leslie, H. H., Saran, I., & Fink, G. (2020) · PLoS Medicine · doi:10.1371/journal.pmed.1003254 · Cited by 29
Self-citationAssessment of health facility quality improvements, United Republic of Tanzania
Gage, A. D., Yahya, T. A., Kruk, M. E., Eliakimu, E. S., Mohamed, M., Shamba, D., & Roder‐DeWan, S. (2020) · Bulletin of the World Health Organization · doi:10.2471/blt.20.258145 · Cited by 26
Self-citationNegero, M. G., Sibbritt, D. W., & Dawson, A. J. (2021) · Human Resources for Health · doi:10.1186/s12960-021-00601-3 · Cited by 33
Strong, J., Lattof, S. R., Maliqi, B., & Yaqub, N. O. (2021) · BMC Health Services Research · doi:10.1186/s12913-021-06905-3 · Cited by 27
Back and Forth on Sustainable Development: A Focus on Healthcare Organisations
Cavicchi, C., Oppi, C., & Vagnoni, E. (2022) · Sustainability · doi:10.3390/su14094958 · Cited by 32
Lestari, T., Fuady, A., Yani, F. F., Putra, I. W. G. A. E., Pradipta, I. S., Chaidir, L., Handayani, D., Fitriangga, A., Loprang, M. R., Pambudi, I., et al. (2023) · PLoS ONE · doi:10.1371/journal.pone.0281591 · Cited by 28
Lewis, T. P., Kapoor, N. R., Aryal, A., Bazua-Lobato, R., Carai, S., Clarke‐Deelder, E., Croke, K. G., Dayalu, R., Espinoza-Pajuelo, L., Fink, G., et al. (2023) · PLoS Medicine · doi:10.1371/journal.pmed.1004294 · Cited by 31
Self-citationKey factors associated with quality of postnatal care: a pooled analysis of 23 countries
Zhao, S., Zhang, Y., Xiao, A. Y., He, Q., & Tang, K. (2023) · EClinicalMedicine · doi:10.1016/j.eclinm.2023.102090 · Cited by 27
Karthikeyan, P. D., Tewari, N., O’Connell, A. C., Srivastav, S., Rajeswary, A., Upadhyay, A. D., Haldar, P., Rahul, M., Mathur, V. P., & Bansal, K. (2023) · Dental Traumatology · doi:10.1111/edt.12882 · Cited by 28
AlOtaibi, S., Almutairi, H. A., Alotaibi, M., Alharbi, K. N., & Bahari, G. (2024) · Risk Management and Healthcare Policy · doi:10.2147/rmhp.s446704 · Cited by 32
Rana, M. S., Alam, M. B., Khanam, S. J., Kabir, M. I., Khandaker, G., & Khan, M. N. (2024) · Scientific Reports · doi:10.1038/s41598-024-51678-4 · Cited by 27
Improving urban health through primary health care in south Asia
Rao, K. D., Bairwa, M. L., Mehta, A., Hyat, S., Ahmed, R., Rajapaksa, L. C., & Adams, A. M. (2024) · The Lancet Global Health · doi:10.1016/s2214-109x(24)00121-9 · Cited by 27
How digital technologies and AI contribute to achieving the health-related SDGs
Köbe, P. (2024) · International Journal of Information Management Data Insights · doi:10.1016/j.jjimei.2024.100298 · Cited by 27
The use of quality control parameters in the evaluation of herbal drugs. A review
Edo, G. I., Obasohan, P., Makia, R. S., the Department of Veterans Affairs Cooperative Study Group o, Umelo, E. C., Jikah, A. N., Yousif, E. A., Isoje, E. F., Igbuku, U. A., Opiti, R. A., et al. (2024) · Discover Medicine · doi:10.1007/s44337-024-00177-6 · Cited by 33
Larson, E., Mbaruku, G. M., Cohen, J., & Kruk, M. E. (2019) · International Journal for Quality in Health Care · doi:10.1093/intqhc/mzz126 · Cited by 28
Self-citationPhilipo, G. S., Nagraj, S., Bokhary, Z. M., & Lakhoo, K. (2020) · BMJ Global Health · doi:10.1136/bmjgh-2019-002118 · Cited by 29
Griffiths, F. E., Watkins, J. A., Huxley, C., Harris, B., Cave, J. A. K., Pemba, S., Chipwaza, B., Lilford, R. J., Ajisola, M. M., Arvanitis, T. N., et al. (2020) · Digital Health · doi:10.1177/2055207620919594 · Cited by 30
Assessing the quality of care in sick child services at health facilities in Ethiopia
Getachew, T., Abebe, S. M., Yitayal, M., Persson, L. Å., & Berhanu, D. (2020) · BMC Health Services Research · doi:10.1186/s12913-020-05444-7 · Cited by 27
Team-based primary health care for non-communicable diseases: complexities in South India
Lall, D., Engel, N., Devadasan, N., Horstman, K., & Criel, B. (2020) · Health Policy and Planning · doi:10.1093/heapol/czaa121 · Cited by 28
Zamboni, K., Singh, S., Tyagi, M., Hill, Z. E., Hanson, C., & Schellenberg, J. (2021) · Implementation Science · doi:10.1186/s13012-020-01058-z · Cited by 28
Appollis, T. M., Duby, Z., Jonas, K., Dietrich, J. J., Maruping, K., Abdullah, F., Slingers, N., & Mathews, C. (2021) · BMC Public Health · doi:10.1186/s12889-021-10462-z · Cited by 27
Respectful maternal and newborn care: measurement in one EN-BIRTH study hospital in Nepal
EN-BIRTH Study Group, Gurung, R., Ruysen, H., Sunny, A. K., Day, L. T., Penn‐Kekana, L., Målqvist, M., Ghimire, B., Singh, D., Basnet, O., et al. (2021) · BMC Pregnancy and Childbirth · doi:10.1186/s12884-020-03516-4 · Cited by 27
Hameed, W., Uddin, M., & Avan, B. I. (2021) · PLoS ONE · doi:10.1371/journal.pone.0249874 · Cited by 27
Hussey, H., Zinyakatira, N., Morden, E., Ismail, M., Paleker, M., Bam, J.-L., London, L., Boulle, A., & Davies, M.-A. (2021) · Gates Open Research · doi:10.12688/gatesopenres.13288.1 · Cited by 27
The continuing role of communities affected by HIV in sustained engagement in health and rights
Caswell, G., Dubula, V., Baptiste, S. L., Etya’ale, H., Syarif, O., & Barr, D. (2021) · Journal of the International AIDS Society · doi:10.1002/jia2.25724 · Cited by 27
Jin, J. Z., Akau'ola, S., Yip, C. H., Nthumba, P. M., Ameh, E. A., de Jonge, S. W., Meheš, M., Waiqanabete, H. I., Henry, J. C. A., Hill, A. G., et al. (2021) · World Journal of Surgery · doi:10.1007/s00268-021-06208-y · Cited by 27
King, J., Powell‐Jackson, T., Makungu, C., Spieker, N., Risha, P., Mkopi, A., & Goodman, C. A. (2021) · The Lancet Global Health · doi:10.1016/s2214-109x(21)00228-x · Cited by 30
Gaspar, R. S., Rossi, L., Hone, T., & Dornelles, A. Z. (2021) · The Lancet Regional Health - Americas · doi:10.1016/j.lana.2021.100042 · Cited by 28
MacPherson, E. E., Reynolds, J., Sanudi, E., Nkaombe, A., Phiri, C., Mankhomwa, J., Dixon, J., & Chandler, C. (2021) · Global Public Health · doi:10.1080/17441692.2021.2015615 · Cited by 27
Evaluations of effective coverage of maternal and child health services: A systematic review
Ferede, A., Dawson, A. J., & Hayen, A. D. (2022) · Health Policy and Planning · doi:10.1093/heapol/czac034 · Cited by 36
Cholera outbreak in some communities in North-East Nigeria, 2019: an unmatched case–control study
Fagbamila, I. O., Abdulkarim, M. A., Aworh, M. K., Uba, B. V., Balogun, M. S., Nguku, P., Gandi, A. Y., Abdullahi, I., Okolocha, E. C., Kwaga, J. K. P., et al. (2023) · BMC Public Health · doi:10.1186/s12889-023-15332-4 · Cited by 27
Onambele, L., Guillén-Aguinaga, S., Guillén-Aguinaga, L., Ortega-Leon, W., Montejo, R., Alas-Brun, R., Aguinaga-Ontoso, E., Aguinaga-Ontoso, I., & Guillén‐Grima, F. (2023) · Epidemiologia · doi:10.3390/epidemiologia4030032 · Cited by 27
Bagepally, B. S., Sajith Kumar, S., Sasidharan, A., Haridoss, M., & Venkataraman, K. (2023) · Scientific Reports · doi:10.1038/s41598-023-42623-y · Cited by 27
Wang, H., Lin, W.-Y., Zhou, C., Yang, Z., Kalpana, S., & Lebowitz, M. (2024) · Cancers · doi:10.3390/cancers16050862 · Cited by 31
Redesigning maternal health services: is centralisation the answer in low-resource settings?
Hanson, C., & Schellenberg, J. (2019) · BMJ Global Health · doi:10.1136/bmjgh-2019-001488 · Cited by 27
Yamey, G., Ogbuoji, O., & Nonvignon, J. (2019) · PLoS Medicine · doi:10.1371/journal.pmed.1002837 · Cited by 27
What kind of evidence do we need to strengthen primary healthcare in the 21st century?
Hirschhorn, L. R., Langlois, É. V., Bitton, A., & Ghaffar, A. (2019) · BMJ Global Health · doi:10.1136/bmjgh-2019-001668 · Cited by 27
Self-citationMakhado, L., Davhana–Maselesele, M., Lebese, R. T., & Maputle, S. M. (2020) · BMC Nursing · doi:10.1186/s12912-020-00470-6 · Cited by 26
Organizations matter in local governance: evidence from health sector decentralization in Honduras
Root, E. D., Zarychta, A., Tapia, B. A. B., Grillos, T., Andersson, K. P., & MENKEN, J. A. (2020) · Health Policy and Planning · doi:10.1093/heapol/czaa084 · Cited by 29
Barriers to Trauma Care in South and Central America: a systematic review
Kinder, F., Mehmood, S., Hodgson, H., Giannoudis, P. V., & Howard, A. (2021) · European Journal of Orthopaedic Surgery & Traumatology · doi:10.1007/s00590-021-03080-3 · Cited by 26
Baum, S. E., Jacobson, L., Ramírez, A. M., Katz, A. J., Grosso, B., Bercu, C., Pearson, E., Gebrehanna, E., Chakraborty, N. M., Dirisu, O., et al. (2023) · BMJ Open · doi:10.1136/bmjopen-2022-067513 · Cited by 26
Ji, S. H., Zhou, Y., Zhao, Q., Chen, R., & Su, Z. (2024) · Frontiers in Nutrition · doi:10.3389/fnut.2024.1426790 · Cited by 26
Engineering with Biomedical Sciences Changing the Horizon of Healthcare-A Review
Weerarathna, I. N., Kumar, P., Luharia, A. A., & Mishra, G. (2024) · Bioengineered · doi:10.1080/21655979.2024.2401269 · Cited by 29
Reducing outpatient wait times through telemedicine: a systematic review and quantitative analysis
Capodici, A., Noci, F., Nuti, S., Emdin, M., Dalmiani, S., Passino, C., Hernandez‐Boussard, T., & Giannoni, A. (2025) · BMJ Open · doi:10.1136/bmjopen-2024-088153 · Cited by 26
Metadata
- Authors
- Kruk, M. E., Gage, A. D., Arsenault, C., Jordan, K., Leslie, H. H., Roder-DeWan, S., Adeyi, O., Barker, P., Daelmans, B., Doubova, S. V., English, M., García-Elorrio, E., Guanais, F., Gureje, O., Hirschhorn, L. R., Jiang, L., Kelley, E., Lemango, E. T., Liljestrand, J., Malata, A., Marchant, T., Matsoso, M. P., Meara, J. G., Mohanan, M., Ndiaye, Y., Norheim, O. F., Reddy, K. S., Rowe, A. K., Salomon, J. A., Thapa, G., Twum-Danso, N. A. Y., & Pate, M.
- Affiliations
- Harvard University (US)
- New York University (US)
- World Bank (US)
- Institute for Healthcare Improvement (US)
- World Health Organization (CH)
- Mexican Social Security Institute (MX)
- Kenya Medical Research Institute (KE)
- Inter-American Development Bank (US)
- University of Ibadan (NG)
- Northwestern University (US)
- Federal Ministry of Health (ET)
- Gates Foundation (US)
- Malawi University of Science and Technology (MW)
- London School of Hygiene & Tropical Medicine (GB)
- Department of Health (ZA)
- Duke University (US)
- Ministère de la Santé Publique et Action Sociale (SN)
- University of Bergen (NO)
- Public Health Foundation of India (IN)
- Centers for Disease Control and Prevention (US)
- Stanford Medicine (US)
- Government of Nepal (NP)
- Corresponding author
- Kruk, Margaret E
- ORCID
- Kruk, Margaret E
- Gage, Anna D
- Arsenault, Catherine
- Jordan, Keely
- Leslie, Hannah H
- Adeyi, Olusoji
- Barker, Pierre
- Daelmans, Bernadette
- Doubova, Svetlana V
- English, Mike
- Guanais, Frederico
- Gureje, Oye
- Hirschhorn, Lisa R
- Jiang, Lixin
- Malata, Address
- Marchant, Tanya
- Meara, John G
- Mohanan, Manoj
- Norheim, Ole F
- Reddy, K Srinath
- Rowe, Alexander K
- Salomon, Joshua A
- Pate, Muhammad
- Venue
- The Lancet Global Health
- Publisher
- Elsevier BV
- Published
- 2018-11
- Volume
- 6
- Issue
- 11
- Pages
- e1196-e1252
- ISSN
- 2214-109X (ISSN-L)
- PMC
- PMC7734391
- OpenAlex
- W2891125414
- Semantic Scholar
- 13a6473d422ee5503822377a9c9072bceafe7270
- Cited by
- 4,057
- References
- 274
- Citations by year
- 2026: 704 · 2025: 696 · 2024: 682 · 2023: 600 · 2022: 408 · 2021: 394 · 2020: 329 · 2019: 213 · 2018: 28
- FWCI
- 44.62
- Type
- journal article
- Language
- en
- Open access
- gold
- doi.org
- Licence
- Locations
- The Lancet Global Health (publishedVersion, cc-by)
- PubMed Central (publishedVersion, cc-by)
- PubMed (publishedVersion)
- LSHTM Research Online (London School of Hygiene and Tropical Medicine) (acceptedVersion)
- Minerva Access (University of Melbourne) (submittedVersion, cc-by)
- CONICET Digital (CONICET) (submittedVersion, cc-by)
- Greater South Information System
- Funders
- Wellcome Trust
- Medical Research Council
- Bill and Melinda Gates Foundation
- Topics
- Health Sciences › Medicine › Public Health, Environmental and Occupational Health › Healthcare Quality and Management
- Health Sciences › Medicine › Public Health, Environmental and Occupational Health › Healthcare Systems and Reforms
- Health Sciences › Medicine › Public Health, Environmental and Occupational Health › Healthcare Systems and Practices
- Keywords
- health system quality, Sustainable Development Goals, low- and middle-income countries, health indicators, health outcomes, user experience, health system accountability, health information systems, health facility survey, healthcare workers, health care financing, health equity, health system transformation, health professions education, health workforce recruitment, health workforce distribution
- MeSH terms
- Sustainable Development, Delivery of Health Care, Developing Countries, Goals, Humans, Quality of Health Care
About these checks
Registry, retraction, Cites and statistics results are computed, not judged, with one exception: a printed reference that no index lists is read once by a model before it counts as a citation error. Claims are extracted by a model and kept only when their quote appears verbatim in the text; each cited source is then checked, with a model’s help, for whether it says what the claim relies on. Those verdicts can be wrong — read the claim’s quote and the cited source before relying on one.
Statistics and arithmetic are recomputed, not judged.
Confidence bands are shown only for fields calibrated on our annotated test set. None is calibrated yet, so no band is shown.
What counts as a claim ›How we measure confidence ›How we check this ›
Are you an author, or do you see a problem with this page? Request a review
