Cited by 108Adenosine and Purinergic SignalingStress Responses and CortisolNeurotransmitter Receptor Influence on Behavior

The DOI matches its Crossref record; 79 of the 80 references it cites were found in a registry or an index.

The absence of P2X7 receptors (P2rx7) on non-haematopoietic cells leads to selective alteration in mood-related behaviour with dysregulated gene expression and stress reactivity in mice

Open access

Abstract

The purpose of this study was to explore how genetic deletion and pharmacological antagonism of the P2X7 receptor (P2rx7) alter mood-related behaviour, gene expression and stress reactivity in the brain. The forced swim test (FST), tail suspension test (TST) and amphetamine-induced hyperlocomotion (AH) tests were used in wild-type (P2rx7+/+) and P2rx7-deficient (P2rx7−/−) mice. Biogenic amine levels were analysed in the amygdala and striatum, adrenocorticotropic hormone (ACTH) and corticosterone levels were measured in the plasma and pituitary after restraint stress. Chimeric mice were generated by bone marrow transplantation. A whole genome microarray analysis with real-time polymerase chain reaction validation was performed on the amygdala. In the absence of P2rx7s decreased behavioural despair in the FST, reduced immobility in the TST and attenuated amphetamine-induced hyperactivity were detected. Basal norepinephrine levels were elevated in the amygdala, whereas stress-induced ACTH and corticosterone responses were alleviated in P2rx7−/− mice. Sub-acute treatment with the selective P2rx7 antagonist, Brilliant Blue G, reproduced the effect of genetic deletion in the TST and AH test in P2rx7+/+ but not P2rx7−/− mice. No change in behavioural phenotype was observed in chimeras lacking the P2rx7 in their haematopoietic compartment. Whole genome microarray analysis indicated a widespread up- and down-regulation of genes crucial for synaptic function and neuroplasticity by genetic deletion. Here, we present evidence that the absence of P2rx7s on non-haematopoietic cells leads to a mood-stabilizing phenotype in several behavioural models and suggest a therapeutic potential of P2rx7 antagonists for the treatment of mood disorders.

Overview

The claims and statistics of this paper haven’t been checked yet.

Run the check — free, no account needed. It reads the open-access text and checks the sources it cites.

A few free checks a day · papers already verified open instantly · results are public

Integrity signals

Registry

Crossref · 10.1017/s1461145711001933

Cites

79 of 79 references verified0 citation errors · 0 not checkable

Statistics

Figures

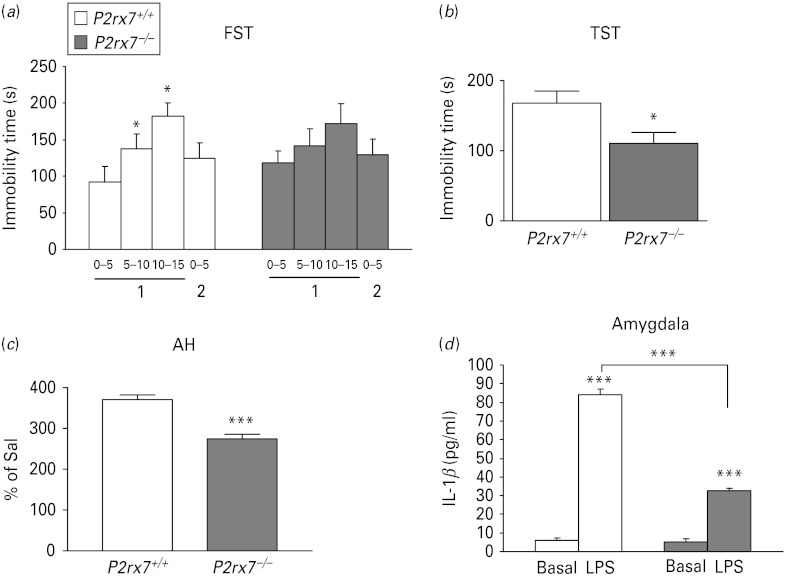
Fig. 1. Genetic deletion of P2rx7s in mice leads to an antidepressant-like phenotype in the forced swim test (FST) and tail suspension test (TST) and mood stabilizing-like phenotype in amphetamine-induced hyperlocomotion test (AH), but does not affect basal interleukin (IL)-1β levels in the amygdala. (a) P2rx7−/− mice failed to develop the depression-like behaviour typical to the FST. The time of immobility is expressed in seconds. * Indicates significant changes from immobility values observed during min 0–5 of the first day, n = 20/group; * p < 0.05. (b) Genetic disruption decreased basal immobility in the TST (n = 9–11, * p < 0.05 vs. P2rx7+/+, Student's t test). The immobility time is expressed in seconds. The total test period was 360 s. (c) Amphetamine-induced hyperactivity is significantly attenuated in P2rx7−/− mice. Mice were placed into the open field arena for a 30-min habituation period and then injected with i.p. saline (Sal) or d-amphetamine-sulfate (2.5 mg/kg). Locomotor activity was assessed for 90 min immediately after the injection and expressed as the percentage of Sal-treated mice, n = 9–10, *** p < 0.001 vs. P2rx7+/+, Student's t test. Drug- and test-naive male homozygous mice (P2rx7+/+ and P2rx7−/−, aged 2–3 months) weighing approximately 30 g were used in the experiments. (d) IL-1β protein level in the amygdala of P2rx7+/+ and P2rx7−/− mice after Sal and lipopolysaccharide (LPS) treatment. The IL-1β protein level was similar in the amygdalae of Sal-treated P2rx7+/+ and P2rx7−/− mice. Injection of LPS (E. coli; 250 μg/kg i.p.) significantly increased the level of IL-1β in the amygdalae of P2rx7+/+ mice 6 h after treatment. IL-1β protein level was less elevated in the amygdalae of P2rx7−/− mice in response to systemic endotoxin. The levels of IL-1β were quantified in the supernatants by ELISA. Data are given as the mean level of cytokines±s.e.m., expressed in pg/ml. * Indicates significant differences between Sal- and LPS-treated and between P2rx7+/+ and P2rx7−/− mice (n = 4 per group, *** p < 0.001, two-way analysis of variance).
Fig. 1. Genetic deletion of P2rx7s in mice leads to an antidepressant-like phenotype in the forced swim test (FST) and tail suspension test (TST) and mood stabilizing-like phenotype in amphetamine-induced hyperlocomotion test (AH), but does not affect basal interleukin (IL)-1β levels in the amygdala. (a) P2rx7−/− mice failed to develop the depression-like behaviour typical to the FST. The time of immobility is expressed in seconds. * Indicates significant changes from immobility values observed during min 0–5 of the first day, n = 20/group; * p < 0.05. (b) Genetic disruption decreased basal immobility in the TST (n = 9–11, * p < 0.05 vs. P2rx7+/+, Student's t test). The immobility time is expressed in seconds. The total test period was 360 s. (c) Amphetamine-induced hyperactivity is significantly attenuated in P2rx7−/− mice. Mice were placed into the open field arena for a 30-min habituation period and then injected with i.p. saline (Sal) or d-amphetamine-sulfate (2.5 mg/kg). Locomotor activity was assessed for 90 min immediately after the injection and expressed as the percentage of Sal-treated mice, n = 9–10, *** p < 0.001 vs. P2rx7+/+, Student's t test. Drug- and test-naive male homozygous mice (P2rx7+/+ and P2rx7−/−, aged 2–3 months) weighing approximately 30 g were used in the experiments. (d) IL-1β protein level in the amygdala of P2rx7+/+ and P2rx7−/− mice after Sal and lipopolysaccharide (LPS) treatment. The IL-1β protein level was similar in the amygdalae of Sal-treated P2rx7+/+ and P2rx7−/− mice. Injection of LPS (E. coli; 250 μg/kg i.p.) significantly increased the level of IL-1β in the amygdalae of P2rx7+/+ mice 6 h after treatment. IL-1β protein level was less elevated in the amygdalae of P2rx7−/− mice in response to systemic endotoxin. The levels of IL-1β were quantified in the supernatants by ELISA. Data are given as the mean level of cytokines±s.e.m., expressed in pg/ml. * Indicates significant differences between Sal- and LPS-treated and between P2rx7+/+ and P2rx7−/− mice (n = 4 per group, *** p < 0.001, two-way analysis of variance).CC BY-NC-SA · PubMed Central
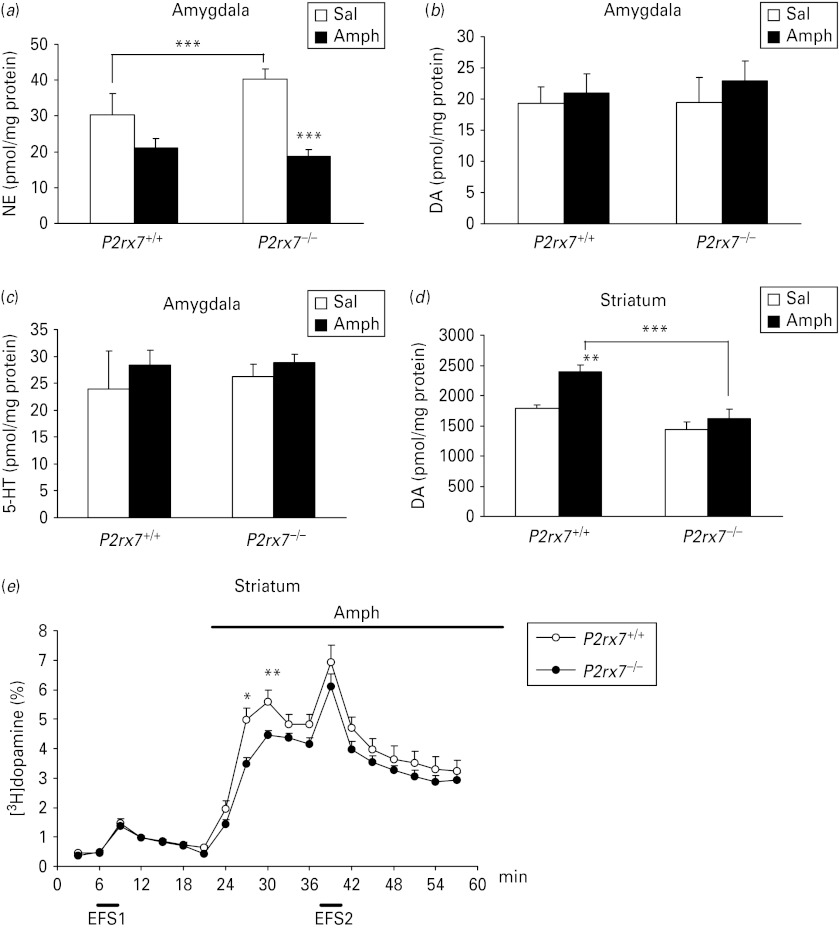
Fig. 2. Changes in the content of norepinephrine (NE) (a), dopamine (DA) (b), 5-HT (c) in the amygdala; dopamine content in the striatum (d) and release of [3H]dopamine (e) in acute striatal slices in the absence of P2rx7. (a–d) P2rx7+/+ and P2rx7−/− mice were treated with saline (Sal) or amphetamine (Amph, 2.5 mg/kg i.p.) and 30 min after the treatment were decapitated. NE, DA and 5-HT levels were analysed by high performance liquid chromatography in the amygdala and striatum and are expressed in pmol/mg protein. * Indicates significant differences between P2rx7+/+ and P2rx7−/− mice and between Sal- and Amph-treated groups, as indicated (n = 7–8/group, ** p < 0.01, *** p < 0.001, two-way analysis of variance followed by Fischer's LSD test). (e) Basal, electrical field stimulation (EFS)- and Amph-induced [3H]dopamine efflux from striatal slices of P2rx7+/+ and P2rx7−/− mice. Striatal slices were incubated with [3H]dopamine and superfused with Krebs’ solution. EFS (20 V, 2 Hz, 240 shocks) and Amph (30 μm) were applied as indicated by the horizontal bars. The efflux of [3H]dopamine is expressed as fractional release, which represents the tritium content in a sample as a percentage of the actual total tritium content. Amph-induced [3H]dopamine release was significantly decreased in striatal slices of P2rx7−/− mice, whereas basal and electrical stimulation-induced efflux remained unchanged. n = 8/group, * p < 0.05, ** p < 0.01, Student's t test.
Fig. 2. Changes in the content of norepinephrine (NE) (a), dopamine (DA) (b), 5-HT (c) in the amygdala; dopamine content in the striatum (d) and release of [3H]dopamine (e) in acute striatal slices in the absence of P2rx7. (a–d) P2rx7+/+ and P2rx7−/− mice were treated with saline (Sal) or amphetamine (Amph, 2.5 mg/kg i.p.) and 30 min after the treatment were decapitated. NE, DA and 5-HT levels were analysed by high performance liquid chromatography in the amygdala and striatum and are expressed in pmol/mg protein. * Indicates significant differences between P2rx7+/+ and P2rx7−/− mice and between Sal- and Amph-treated groups, as indicated (n = 7–8/group, ** p < 0.01, *** p < 0.001, two-way analysis of variance followed by Fischer's LSD test). (e) Basal, electrical field stimulation (EFS)- and Amph-induced [3H]dopamine efflux from striatal slices of P2rx7+/+ and P2rx7−/− mice. Striatal slices were incubated with [3H]dopamine and superfused with Krebs’ solution. EFS (20 V, 2 Hz, 240 shocks) and Amph (30 μm) were applied as indicated by the horizontal bars. The efflux of [3H]dopamine is expressed as fractional release, which represents the tritium content in a sample as a percentage of the actual total tritium content. Amph-induced [3H]dopamine release was significantly decreased in striatal slices of P2rx7−/− mice, whereas basal and electrical stimulation-induced efflux remained unchanged. n = 8/group, * p < 0.05, ** p < 0.01, Student's t test.CC BY-NC-SA · PubMed Central
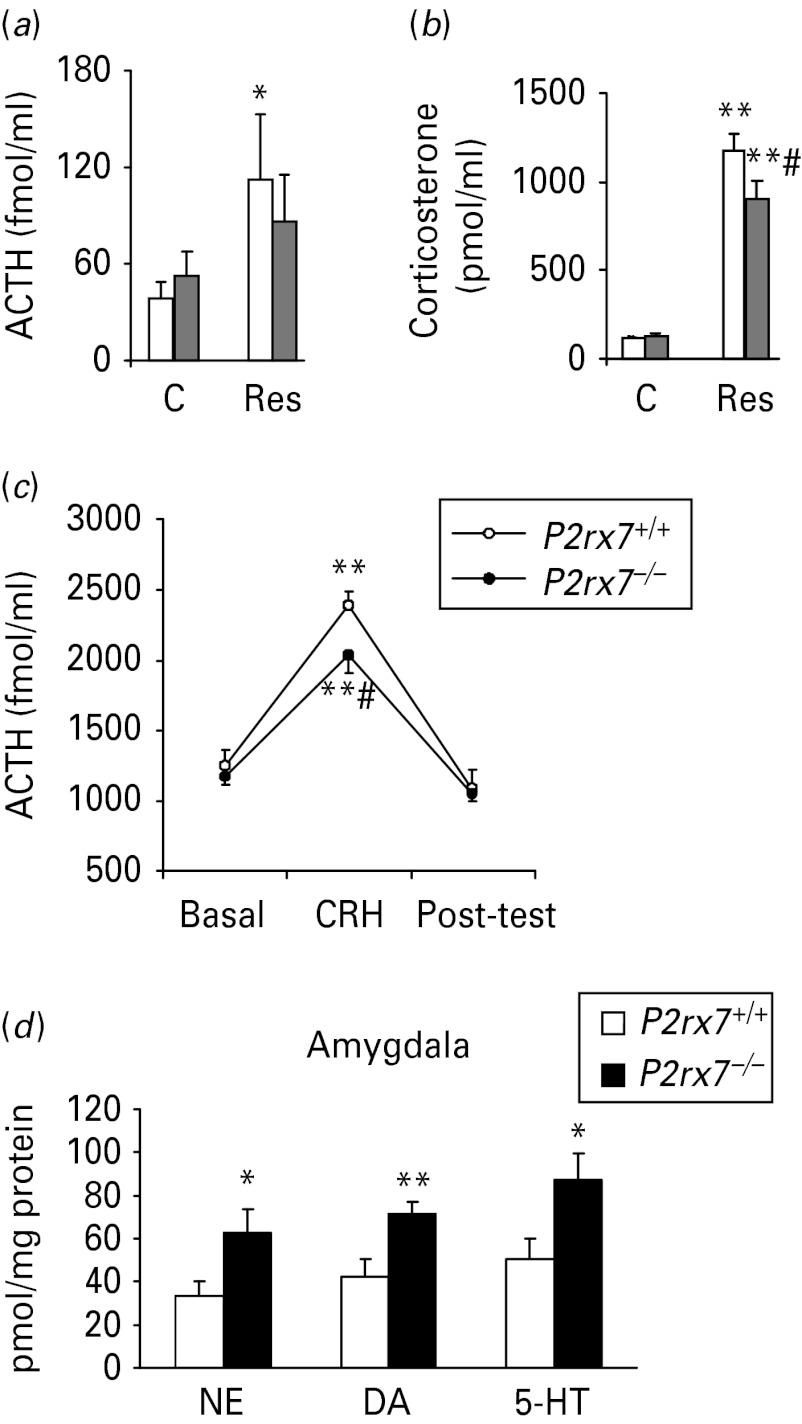
Fig. 3. P2rx7−/− mice [grey bars in (a) and (b)] respond with a decreased elevation of adrenocorticotropic hormone (ACTH) and corticosterone in the plasma (a, b) and pituitary (c) and increased norepinephrine (NE) level (d) in the amygdala to stress. Hormonal secretion was evaluated after 30 min of restraint. Plasma levels of ACTH (a) and corticosterone (b) were measured by radioimmunoassay of trunk blood (n = 9–10). The resting ACTH and corticosterone levels were not affected by genotype. Restraint significantly increased the level of both hormones, but the elevation of ACTH levels reached the level of significance in P2rx7+/+ animals (clear bars) only (p = 0.03). (c) The ACTH response to 5 × 10⁻⁸ m corticotropin-releasing hormone (CRH) was studied in vitro (n = 10 per group). Fifteen-min fractions were collected. CRH treatment significantly increased ACTH secretion. This effect was dependent on the genotype and there was a significantly smaller response in P2rx7−/− mice. C, control; Res, exposed to 30-min restraint. Post-hoc comparisons: * p < 0.05; ** p < 0.01 vs. control; #p < 0.05 vs. P2rx7+/+. (d) The level of NE, dopamine (DA) and 5-HT was analysed by high performance liquid chromatography in the amygdalae of P2rx7+/+ and P2rx7−/− mice after 30 min restraint. The results are expressed as pmol/mg protein. * Represents a significant difference between P2rx7+/+ and P2rx7−/− animals, n = 10–12/group, * p < 0.05, ** p < 0.01, Student's t test.
Fig. 3. P2rx7−/− mice [grey bars in (a) and (b)] respond with a decreased elevation of adrenocorticotropic hormone (ACTH) and corticosterone in the plasma (a, b) and pituitary (c) and increased norepinephrine (NE) level (d) in the amygdala to stress. Hormonal secretion was evaluated after 30 min of restraint. Plasma levels of ACTH (a) and corticosterone (b) were measured by radioimmunoassay of trunk blood (n = 9–10). The resting ACTH and corticosterone levels were not affected by genotype. Restraint significantly increased the level of both hormones, but the elevation of ACTH levels reached the level of significance in P2rx7+/+ animals (clear bars) only (p = 0.03). (c) The ACTH response to 5 × 10⁻⁸ m corticotropin-releasing hormone (CRH) was studied in vitro (n = 10 per group). Fifteen-min fractions were collected. CRH treatment significantly increased ACTH secretion. This effect was dependent on the genotype and there was a significantly smaller response in P2rx7−/− mice. C, control; Res, exposed to 30-min restraint. Post-hoc comparisons: * p < 0.05; ** p < 0.01 vs. control; #p < 0.05 vs. P2rx7+/+. (d) The level of NE, dopamine (DA) and 5-HT was analysed by high performance liquid chromatography in the amygdalae of P2rx7+/+ and P2rx7−/− mice after 30 min restraint. The results are expressed as pmol/mg protein. * Represents a significant difference between P2rx7+/+ and P2rx7−/− animals, n = 10–12/group, * p < 0.05, ** p < 0.01, Student's t test.CC BY-NC-SA · PubMed Central
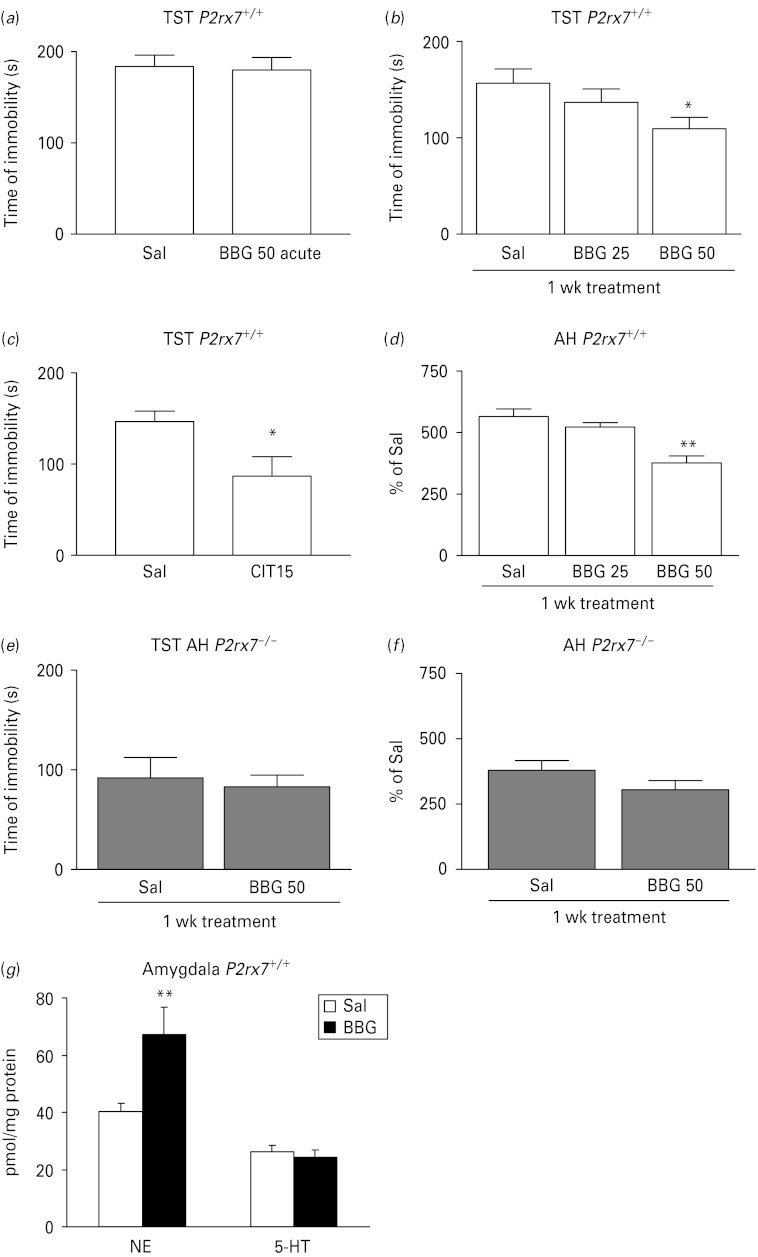
Fig. 4. The selective P2rx7 antagonist Brilliant Blue G (BBG) exhibits antidepressant-like activity in the tail suspension test (TST), decreases amphetamine-induced hyperactivity and elevates norepinephrine (NE) level in the amygdala in P2rx7+/+, but not P2rx7−/− mice. (a) The effect of acute BBG treatment on basal immobility in P2rx7+/+ mice (n = 13–15). (b) Effect of sub-acute, 1-wk treatment with BBG on basal immobility in P2rx7+/+ mice. Mice were treated with BBG for 7 d with the daily doses indicated on the abscissa or with saline (Sal) and then submitted to the TST (n = 13–15, * p < 0.05 vs. SAL, one-way analysis of variance (ANOVA), followed by Dunnett's test). (c) Citalopram (Cit; 15 mg/kg), the potent selective serotonin reuptake inhibitor antidepressant, decreased basal immobility in the TST in P2rx7+/+mice (n = 11/group, * p < 0.05 vs. Sal, Student's t test). (d) Effect of 1-wk daily treatment with BBG (25–50 mg/kg i.p.) or Sal on amphetamine induced hyperactivity in P2rx7+/+mice. (n = 10–12/group, ** p < 0.001 vs. Sal, one-way ANOVA followed by Dunnett's test). Citalopram and BBG were administered i.p. 30 min before testing at the doses (mg/kg) indicated on the abscissa. Sal-treated mice were injected with an equal volume of Sal. (e) Effect of sub-acute, 1-wk treatment with BBG (50 mg/kg i.p.) on basal immobility in P2rx7−/− mice. Mice were treated with BBG for 7 d or with Sal and then submitted to the TST (n = 8–10/group). (f) Effect of 1-wk daily treatment with BBG (50 mg/kg i.p.) or Sal on amphetamine-induced hyperactivity in P2rx7−/− mice (n = 10/group). Note that the basal immobility (e) and amphetamine-induced hyperactivity (f) is lower in Sal-treated P2rx7−/− mice than in Sal-treated P2rx7+/+ mice. (g) Sub-acute, 1-wk treatment with BBG (50 mg/kg i.p.) elevates NE, but not 5-HT levels in the amygdala in P2rx7+/+ mice, when compared to Sal-treated mice. Tissue content of NE and 5-HT were analysed by high performance liquid chromatography and are expressed in pmol/mg protein, n = 11–12, ** p < 0.01, Student's t test.
Fig. 4. The selective P2rx7 antagonist Brilliant Blue G (BBG) exhibits antidepressant-like activity in the tail suspension test (TST), decreases amphetamine-induced hyperactivity and elevates norepinephrine (NE) level in the amygdala in P2rx7+/+, but not P2rx7−/− mice. (a) The effect of acute BBG treatment on basal immobility in P2rx7+/+ mice (n = 13–15). (b) Effect of sub-acute, 1-wk treatment with BBG on basal immobility in P2rx7+/+ mice. Mice were treated with BBG for 7 d with the daily doses indicated on the abscissa or with saline (Sal) and then submitted to the TST (n = 13–15, * p < 0.05 vs. SAL, one-way analysis of variance (ANOVA), followed by Dunnett's test). (c) Citalopram (Cit; 15 mg/kg), the potent selective serotonin reuptake inhibitor antidepressant, decreased basal immobility in the TST in P2rx7+/+mice (n = 11/group, * p < 0.05 vs. Sal, Student's t test). (d) Effect of 1-wk daily treatment with BBG (25–50 mg/kg i.p.) or Sal on amphetamine induced hyperactivity in P2rx7+/+mice. (n = 10–12/group, ** p < 0.001 vs. Sal, one-way ANOVA followed by Dunnett's test). Citalopram and BBG were administered i.p. 30 min before testing at the doses (mg/kg) indicated on the abscissa. Sal-treated mice were injected with an equal volume of Sal. (e) Effect of sub-acute, 1-wk treatment with BBG (50 mg/kg i.p.) on basal immobility in P2rx7−/− mice. Mice were treated with BBG for 7 d or with Sal and then submitted to the TST (n = 8–10/group). (f) Effect of 1-wk daily treatment with BBG (50 mg/kg i.p.) or Sal on amphetamine-induced hyperactivity in P2rx7−/− mice (n = 10/group). Note that the basal immobility (e) and amphetamine-induced hyperactivity (f) is lower in Sal-treated P2rx7−/− mice than in Sal-treated P2rx7+/+ mice. (g) Sub-acute, 1-wk treatment with BBG (50 mg/kg i.p.) elevates NE, but not 5-HT levels in the amygdala in P2rx7+/+ mice, when compared to Sal-treated mice. Tissue content of NE and 5-HT were analysed by high performance liquid chromatography and are expressed in pmol/mg protein, n = 11–12, ** p < 0.01, Student's t test.CC BY-NC-SA · PubMed Central
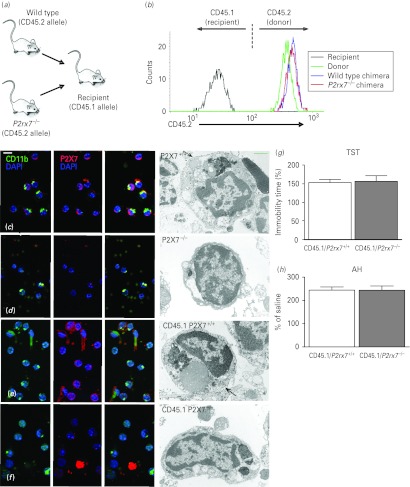
Fig. 5. Mood-stabilizing phenotype is not detectable in chimeric mice transplanted with the bone marrow of P2rx7−/− mice. (a) General scheme of bone marrow transplantation. (b) Flow cytometric analysis of the expression of the donor-specific CD45.2 allele on peripheral blood granulocytes of an intact C57BL/6J mouse (donor), a CD45.1-expressing congenic mouse (recipient) and bone marrow chimeras engrafted with P2rx7+/+ and P2rx7−/− bone marrow cells (P2rx7+/+ and P2rx7−/− chimeras, respectively). (c–f) Immunocytochemical demonstration of the P2rx7 in mouse microglial cells. Co-localization of P2rx7s (labelled red) with microglial labelling CD11b (green) was found in microglia cells retrieved from P2rx7+/+ mouse brain tissue (c) and in chimeras transplanted with P2rx7+/+ bone marrow [(e) CD45.1/ P2rx7+/+]. Microglial cells of P2rx7−/− animals (d) did not show P2rx7 immunoreactivity. In chimeras transplanted with P2rx7−/− bone marrow [(f), CD45.1/P2rx7−/−], the P2rx7 (labelled red) was not found on microglial cells (labelled green) but was in some unidentified cells and cell debris in the cell suspension/fraction. Electron microscopy supported this finding. The cell membrane of morphologically characterized microglial cells – dark nuclei, either oval or bean shaped, electron dense cytoplasm, long cisternae of granular endoplasmic reticulum and large inclusions of phagocytosed material in the cell bodies that are commonly found in old animals – were covered by diaminobenzidine precipitates, demonstrating P2rx7 immunoreactivity (c and e rows). Cell processes of unidentified cells also showed P2rx7 immunoreactivity (e). Microglial cells of P2rx7 gene knockout animals (d) or microglial cells from CD45.1/P2rx7−/− animals (f) were free of precipitate. (g, h) Basal immobility time in the tail suspension test (g) and amphetamine-induced hyperactivity (h) were not different in CD45.1/P2rx7+/+ and CD45.1/P2rx7−/− mice. Mice were submitted to behaviour tests 8 wk after engraftment (n = 13–14/group).
Fig. 5. Mood-stabilizing phenotype is not detectable in chimeric mice transplanted with the bone marrow of P2rx7−/− mice. (a) General scheme of bone marrow transplantation. (b) Flow cytometric analysis of the expression of the donor-specific CD45.2 allele on peripheral blood granulocytes of an intact C57BL/6J mouse (donor), a CD45.1-expressing congenic mouse (recipient) and bone marrow chimeras engrafted with P2rx7+/+ and P2rx7−/− bone marrow cells (P2rx7+/+ and P2rx7−/− chimeras, respectively). (c–f) Immunocytochemical demonstration of the P2rx7 in mouse microglial cells. Co-localization of P2rx7s (labelled red) with microglial labelling CD11b (green) was found in microglia cells retrieved from P2rx7+/+ mouse brain tissue (c) and in chimeras transplanted with P2rx7+/+ bone marrow [(e) CD45.1/ P2rx7+/+]. Microglial cells of P2rx7−/− animals (d) did not show P2rx7 immunoreactivity. In chimeras transplanted with P2rx7−/− bone marrow [(f), CD45.1/P2rx7−/−], the P2rx7 (labelled red) was not found on microglial cells (labelled green) but was in some unidentified cells and cell debris in the cell suspension/fraction. Electron microscopy supported this finding. The cell membrane of morphologically characterized microglial cells – dark nuclei, either oval or bean shaped, electron dense cytoplasm, long cisternae of granular endoplasmic reticulum and large inclusions of phagocytosed material in the cell bodies that are commonly found in old animals – were covered by diaminobenzidine precipitates, demonstrating P2rx7 immunoreactivity (c and e rows). Cell processes of unidentified cells also showed P2rx7 immunoreactivity (e). Microglial cells of P2rx7 gene knockout animals (d) or microglial cells from CD45.1/P2rx7−/− animals (f) were free of precipitate. (g, h) Basal immobility time in the tail suspension test (g) and amphetamine-induced hyperactivity (h) were not different in CD45.1/P2rx7+/+ and CD45.1/P2rx7−/− mice. Mice were submitted to behaviour tests 8 wk after engraftment (n = 13–14/group).CC BY-NC-SA · PubMed Central
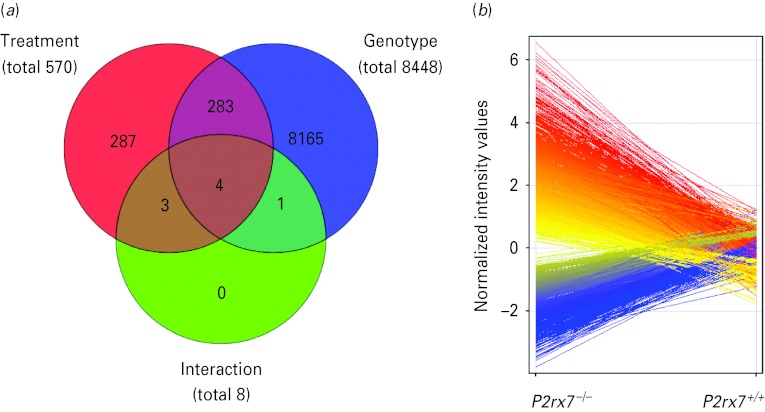
Fig. 6. Summary of results of the whole genome microarray analysis performed on amygdala samples of P2rx7+/+ and P2rx7−/− mice subjected to saline or lipopolysaccharide (LPS) treatments (n = 4/group). (a) Venn diagram represents the main effects of the two-way analysis of variance with Benjamini–Hochberg's multiple correction comparison test for unequal replications and using the selection filters of >2.0-fold change: LPS treatment (red circle), genotype (blue circle) and their interaction (green circle). Numbers inside the compartments represent the number of transcripts that are significant for that effect. The intersections of the sets represent significantly changed genes for each of the effects involved in the intersection. Significance threshold was 0.05 and the p value computation was asymptotic. In the primary microarray analysis, the expression of a total of 8739 transcripts was found to be significantly altered with the applied statistical filters. These 8739 genes sum up from the genes significantly affected by treatment independently from genotype (287 + 283 = 570, illustrated by the numbers in those areas of the red circle, which is covered only by the red area, and covered by the red and blue areas), by genotype independently from treatment (8165 + 283 = 8448, illustrated by the numbers in those areas of the blue circle, which is covered only by the blue area, and covered by the red and blue areas) and by their interaction (4, as illustrated by the numbers within the intersection of the red/blue and green circles), i.e. 287 + 283 + 8165 + 4=8739. The intersection of the red and green circles represents three transcripts, which were not only significantly affected by LPS treatment but may also be altered by genotype, whereas the intersection of the blue and green circles represents one transcript, which is not only significantly affected by knockout genotype but may also be altered by LPS treatment. (b) Deficiency of the P2rx7 had the most profound effect on the expression profile, changing the expression of 8448 transcripts. Among them, 3133 were increased (red) and 5315 were decreased (blue), as illustrated by the deviation of the lines according to the normalized intensity values.
Fig. 6. Summary of results of the whole genome microarray analysis performed on amygdala samples of P2rx7+/+ and P2rx7−/− mice subjected to saline or lipopolysaccharide (LPS) treatments (n = 4/group). (a) Venn diagram represents the main effects of the two-way analysis of variance with Benjamini–Hochberg's multiple correction comparison test for unequal replications and using the selection filters of >2.0-fold change: LPS treatment (red circle), genotype (blue circle) and their interaction (green circle). Numbers inside the compartments represent the number of transcripts that are significant for that effect. The intersections of the sets represent significantly changed genes for each of the effects involved in the intersection. Significance threshold was 0.05 and the p value computation was asymptotic. In the primary microarray analysis, the expression of a total of 8739 transcripts was found to be significantly altered with the applied statistical filters. These 8739 genes sum up from the genes significantly affected by treatment independently from genotype (287 + 283 = 570, illustrated by the numbers in those areas of the red circle, which is covered only by the red area, and covered by the red and blue areas), by genotype independently from treatment (8165 + 283 = 8448, illustrated by the numbers in those areas of the blue circle, which is covered only by the blue area, and covered by the red and blue areas) and by their interaction (4, as illustrated by the numbers within the intersection of the red/blue and green circles), i.e. 287 + 283 + 8165 + 4=8739. The intersection of the red and green circles represents three transcripts, which were not only significantly affected by LPS treatment but may also be altered by genotype, whereas the intersection of the blue and green circles represents one transcript, which is not only significantly affected by knockout genotype but may also be altered by LPS treatment. (b) Deficiency of the P2rx7 had the most profound effect on the expression profile, changing the expression of 8448 transcripts. Among them, 3133 were increased (red) and 5315 were decreased (blue), as illustrated by the deviation of the lines according to the normalized intensity values.CC BY-NC-SA · PubMed Central

Verification

Claims the paper makes

The claims and statistics of this paper haven’t been checked yet.

Run the check — free, no account needed. It reads the open-access text and checks the sources it cites.

A few free checks a day · papers already verified open instantly · results are public

Claims other papers make about this one

Each is checked against this paper’s own text: does it say what the citing paper says it does?

Self-check

Percentages, sums and reported differences re-computed from the paper’s own numbers.

The self-check needs the paper’s full text.

Citations

Cites

Show all 80 references

Cited by

Sorted by citations

See all 108

Metadata

Authors
Csölle, C., Andó, R. D., Kittel, Á., Gölöncsér, F., Baranyi, M., Soproni, K., Zelena, D., Haller, J., Németh, T., Mócsai, A., & Sperlágh, B.
Affiliations
  • Laboratory of Molecular Pharmacology, Institute of Experimental Medicine, Hungarian Academy of Sciences (IEM HAS), Budapest, Hungary
  • HUN-REN Institute of Experimental Medicine (HU)
  • Semmelweis University (HU)
Corresponding author
Sperlágh, Beáta
Venue
International Journal of Neuropsychopharmacology
Published
2013-02-01
Volume
16
Issue
1
Pages
213-233
ISSN
  • 1461-1457 (ISSN-L)
  • 1469-5111
OpenAlex
W2102853311
Cited by
108
References
80
Citations by year
2026: 4 · 2025: 5 · 2024: 7 · 2023: 4 · 2022: 9 · 2021: 9 · 2020: 5 · 2019: 13 · 2018: 13 · 2017: 7 · 2016: 6 · 2015: 8 · 2014: 11 · 2013: 4
FWCI
5.84
Type
journal article
Language
en
Open access
Licence
cc-by-nc-sa
Locations
  • The International Journal of Neuropsychopharmacology (publishedVersion, cc-by-nc-sa)
  • Europe PMC (PubMed Central) (publishedVersion, cc-by-nc-sa)
  • PubMed Central (publishedVersion, cc-by-nc-sa)
  • PubMed (publishedVersion)
  • Repository of the Academy's Library (Library of the Hungarian Academy of Sciences) (acceptedVersion)
  • Semmelweis University Repository (Semmelweis University) (submittedVersion)
Funders
Wellcome Trust (087782)
Topics
  • Life Sciences › Biochemistry, Genetics and Molecular Biology › Physiology › Adenosine and Purinergic Signaling
  • Life Sciences › Neuroscience › Behavioral Neuroscience › Stress Responses and Cortisol
  • Life Sciences › Neuroscience › Cellular and Molecular Neuroscience › Neurotransmitter Receptor Influence on Behavior
Keywords
P2X7 receptor, depression-like behavior, anxiety-like behavior, stress reactivity, Brilliant Blue G, P2X7 antagonists, norepinephrine, amygdala, striatum, ACTH, corticosterone, hematopoietic cells, gene expression, synaptic function, neuroplasticity, mood disorders
MeSH terms
Affect, Amygdala, Animals, Depression, Gene Expression Regulation, Male, Mice, Inbred C57BL, Stress, Psychological, Swimming, Microglia, Mice, Knockout, Mice, Receptors, Purinergic P2X7

About these checks

Registry, retraction, Cites and statistics results are computed, not judged, with one exception: a printed reference that no index lists is read once by a model before it counts as a citation error. Claims are extracted by a model and kept only when their quote appears verbatim in the text; each cited source is then checked, with a model’s help, for whether it says what the claim relies on. Those verdicts can be wrong — read the claim’s quote and the cited source before relying on one.

Statistics and arithmetic are recomputed, not judged.

Confidence bands are shown only for fields calibrated on our annotated test set. None is calibrated yet, so no band is shown.

What counts as a claim ›How we measure confidence ›How we check this ›

Are you an author, or do you see a problem with this page? Request a review