

The DOI matches its Crossref record; 2 of the 2 references it cites were found in a registry or an index.
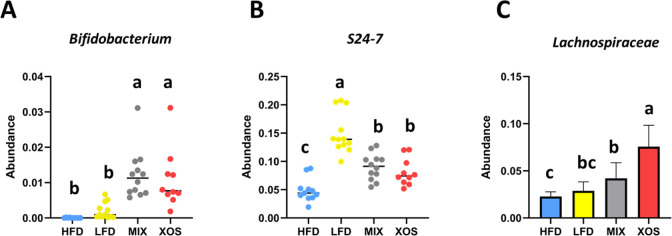
Xylooligosaccharides Increase Bifidobacteria and Lachnospiraceae in Mice on a High-Fat Diet, with a Concomitant Increase in Short-Chain Fatty Acids, Especially Butyric Acid
Overview
The claims and statistics of this paper haven’t been checked yet.
Run the check — free, no account needed. It reads the open-access text and checks the sources it cites.
Integrity signals
Registry
Cites
Statistics
Figures
Verification
Claims the paper makes
The claims and statistics of this paper haven’t been checked yet.
Run the check — free, no account needed. It reads the open-access text and checks the sources it cites.
Claims other papers make about this one
Each is checked against this paper’s own text: does it say what the citing paper says it does?
In the citing paper
“The blooming of Bifidobacterium caused by SCXN was associated with its prebiotic constituent, xylan, which has been widely known to promote Bifidobacterium growth41,42.”
From Combining gut microbiota modulation and chemotherapy by capecitabine-loaded prebiotic nanoparticle improves colorectal cancer therapy (2023) · cites this paper as [41]
Self-check
Percentages, sums and reported differences re-computed from the paper’s own numbers.
The self-check needs the paper’s full text.
Citations
Cites
Klindworth, A., Pruesse, E., Schweer, T., Peplies, J., Quast, C., Horn, M., & Glöckner, F. O. (2013) · Nucleic Acids Research · doi:10.1093/nar/gks808 · Cited by 8,850
Xylooligosaccharide increases bifidobacteria but not lactobacilli in human gut microbiota
Finegold, S. M., Li, Z., Summanen, P. H., Downes, J., Thames, G., Corbett, K., Dowd, S., Krak, M., & Heber, D. (2014) · Food & Function · doi:10.1039/c3fo60348b · Cited by 255
Research works printed but not linked: 43
- 10.1007/s10295-019-02203-4 · DOI
- 10.1016/j.tifs.2019.09.004 · DOI
- 10.1021/acs.jafc.9b04811 · DOI
- 10.1371/journal.pone.0080476 · DOI
- 10.1371/journal.pone.0127252 · DOI
- 10.1080/10408390903044768 · DOI
- 10.1111/j.1541-4337.2010.00135.x · DOI
- 10.22037/afb.v5i3.20212 · DOI
- 10.2903/j.efsa.2018.5361 · DOI
- 10.1021/jf502343v · DOI
- 10.1002/bmc.580 · DOI
- 10.1038/nmeth.f.303 · DOI · Paper page
- 10.1093/bioinformatics/btr026 · DOI
- 10.3389/fmicb.2018.02897 · DOI
- 10.1186/s12866-019-1494-7 · DOI
- 10.1038/ismej.2014.3 · DOI
- 10.1128/aem.02089-15 · DOI
- 10.3920/bm2009.0029 · DOI
- 10.3920/bm2009.0025 · DOI
- 10.3945/jn.112.172361 · DOI
- 10.1017/s0007114511007252 · DOI · Paper page
- 10.1017/s0007114513004261 · DOI
- 10.1128/aem.03065-18 · DOI
- 10.3390/nu10081105 · DOI
- 10.1128/aem.02853-13 · DOI
- Palframan R. J., 2003, Curr. Issues Intest. Microbiol., 4, 71
- 10.1038/srep30768 · DOI
- 10.1128/aem.71.10.6150-6158.2005 · DOI
- 10.3390/nu11102431 · DOI
- 10.1038/s41598-017-06447-x · DOI
- 10.1039/c8fo00209f · DOI
- 10.1021/acs.jafc.8b00829 · DOI
- 10.1074/jbc.m116.746438 · DOI
- 10.1111/j.1365-2621.2004.00814.x · DOI
- 10.1128/msystems.00130-17 · DOI
- 10.1111/jgh.14536 · DOI
- 10.1038/s41564-018-0132-8 · DOI · Paper page
- 10.1038/s41467-019-08812-y · DOI
- 10.1111/1462-2920.13589 · DOI · Paper page
- 10.3382/ps/pex297 · DOI
- 10.1111/j.1462-2920.2011.02533.x · DOI
- 10.3389/fmicb.2016.00979 · DOI
- 10.1016/j.jff.2019.103622 · DOI
Cited by
Sorted by citations
Lang, T., Zhu, R., Zhu, X., Yan, W., Li, Y., Zhai, Y., Wu, T., Huang, X., Yin, Q., & Li, Y. (2023) · Nature Communications · doi:10.1038/s41467-023-40439-y · Cited by 133
Song, Z., Chen, J., Ji, Y., Yang, Q., Chen, Y., Wang, F., & Wu, Z. (2023) · International Journal of Biological Macromolecules · doi:10.1016/j.ijbiomac.2023.124650 · Cited by 34
Metadata
- Authors
- Berger, K., Burleigh, S., Lindahl, M., Bhattacharya, A., Patil, P., Stålbrand, H., Nordberg Karlsson, E., Hållenius, F., Nyman, M., & Adlercreutz, P.
- Venue
- Journal of Agricultural and Food Chemistry
- Publisher
- American Chemical Society (ACS)
- Published
- 2021-03-16
- Volume
- 69
- Issue
- 12
- Pages
- 3617-3625
- ISSN
- 0021-8561
- 1520-5118
- PMC
- PMC8041301
- Cited by
- 97
- References
- 2
- Language
- en
- Funders
- Svenska Forskningsr?det Formas
- Crafoordska Stiftelsen
- Lunds Universitet
- Stiftelsen f?r?Strategisk Forskning
- Direkt?r?Albert P?hlssons Stiftelse
- EXODIAB
- Lawski foundation
About these checks
Registry, retraction, Cites and statistics results are computed, not judged, with one exception: a printed reference that no index lists is read once by a model before it counts as a citation error. Claims are extracted by a model and kept only when their quote appears verbatim in the text; each cited source is then checked, with a model’s help, for whether it says what the claim relies on. Those verdicts can be wrong — read the claim’s quote and the cited source before relying on one.
Statistics and arithmetic are recomputed, not judged.
Confidence bands are shown only for fields calibrated on our annotated test set. None is calibrated yet, so no band is shown.
What counts as a claim ›How we measure confidence ›How we check this ›
Are you an author, or do you see a problem with this page? Request a review
How to cite
Cite CoChat for the checks on this page, and the paper for its own findings.
- This page
- CoChat. (2026). Citation check: Xylooligosaccharides Increase Bifidobacteria and Lachnospiraceae in Mice on a High-Fat Diet, with a Concomitant Increase in Short-Chain Fatty Acids, Especially Butyric Acid. https://app.cochat.ai/papers/10.1021/acs.jafc.0c06279
- The paper
- Berger, K., Burleigh, S., Lindahl, M., Bhattacharya, A., Patil, P., Stålbrand, H., Nordberg Karlsson, E., Hållenius, F., Nyman, M., & Adlercreutz, P. (2021). Xylooligosaccharides Increase Bifidobacteria and Lachnospiraceae in Mice on a High-Fat Diet, with a Concomitant Increase in Short-Chain Fatty Acids, Especially Butyric Acid. Journal of Agricultural and Food Chemistry. https://doi.org/10.1021/acs.jafc.0c06279
