

Algorithm aversion: People erroneously avoid algorithms after seeing them err.
Open accessThe DOI matches its Crossref record; 23 of the 23 references it cites were found in a registry or an index; none of the 22 sources its claims cite is checked for support yet.
Abstract
Research shows that evidence-based algorithms more accurately predict the future than do human forecasters. Yet when forecasters are deciding whether to use a human forecaster or a statistical algorithm, they often choose the human forecaster. This phenomenon, which we call algorithm aversion, is costly, and it is important to understand its causes. We show that people are especially averse to algorithmic forecasters after seeing them perform, even when they see them outperform a human forecaster. This is because people more quickly lose confidence in algorithmic than human forecasters after seeing them make the same mistake. In 5 studies, participants either saw an algorithm make forecasts, a human make forecasts, both, or neither. They then decided whether to tie their incentives to the future predictions of the algorithm or the human. Participants who saw the algorithm perform were less confident in it, and less likely to choose it over an inferior human forecaster. This was true even among those who saw the algorithm outperform the human.
Overview
CoChat Summary
TL;DR
People become less willing to use a statistical algorithm after seeing it perform and make mistakes, even when it outperforms a human forecaster. This “algorithm aversion” is driven partly by people losing confidence in algorithms more quickly than in humans after observing errors.
Key findings
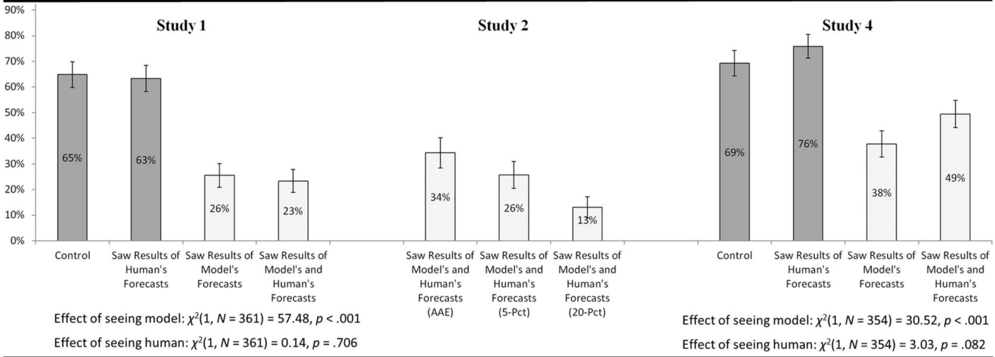
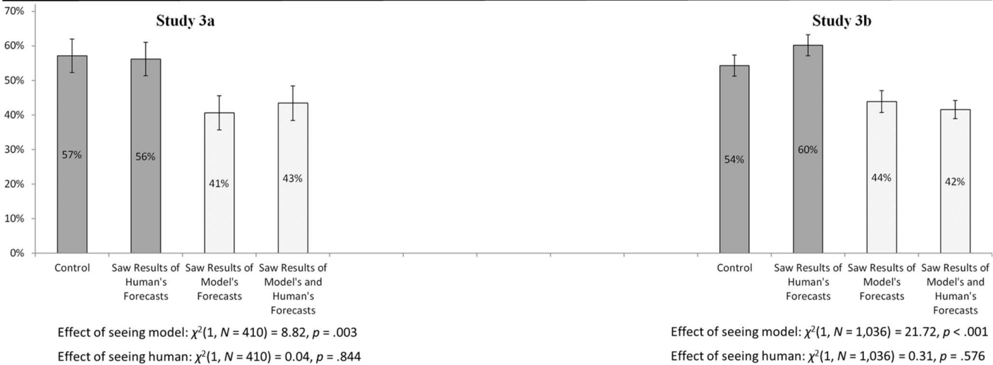
- Across five studies, seeing the algorithm perform reduced participants’ likelihood of choosing it over a human forecaster. In the model-and-human conditions, 610 of 741 participants (83%) saw the model outperform the human, yet these participants were among the least likely to choose the model.
- The model outperformed humans in all five studies. For example, bonuses if choosing model vs. human were Study 1: $1.78 vs. $1.38; Study 2: $1.77 vs. $1.09; Study 3a: $0.48 vs. $0.31; Study 3b: $0.49 vs. $0.30; Study 4: $1.79 vs. $1.38. Human forecasters produced 15–29% more error in the MBA task and 90–97% more error in the airline-passenger task.
- Seeing the model perform significantly decreased confidence in the model’s forecasts in all four studies where this was tested, whereas seeing the human perform significantly decreased confidence in the human only in Study 4. Confidence in the model’s forecasts significantly mediated the effect of seeing the model perform on choosing the model; confidence in the human did not.
- In Study 2, participants paid for forecasts within 20 percentiles were less likely to choose the model than those paid within 5 percentiles, χ²(1, N = 139) = 3.56, p = .059, and those paid by average absolute error, χ²(1, N = 136) = 8.56, p = .003; this effect was mediated by confidence in their own forecasts, not confidence in the model’s forecasts.
Methods
- Five studies had participants forecast real outcomes: MBA student success (Studies 1, 2, and 4) or U.S. state rank in airline passengers (Studies 3a and 3b). Participants were assigned to control, human, model, or model-and-human conditions, then chose whether to tie incentivized bonuses to the model or the human forecaster (themselves in Studies 1–3, another participant in Study 4).
- Final samples were Study 1: 361; Study 2: 206; Study 3a: 410; Study 3b: 1,036; Study 4: 354. Studies 1, 2, and 4 were run in the Wharton Behavioral Lab; Studies 3a and 3b used Amazon Mechanical Turk.
- Main analyses compared forecasting performance and choice rates, measured confidence and beliefs, and used binary mediation analyses with Preacher and Hayes’s bootstrapping procedure.
Limitations
- The paper states it did not explore all boundaries of the effect, including whether it would persist if algorithms were many times more accurate than humans, and whether results depend on features shared by the two forecasting tasks.
- The paper states it did not explore how algorithm variations—complexity, transparency, forecaster involvement in construction, and designer expertise—affect algorithm aversion.
- The paper states algorithm aversion is not entirely driven by seeing algorithms err, and it has little to say about how best to reduce aversion among those who have seen an algorithm err. The text also cautions that cross-experiment comparisons should be made cautiously.
Model-written summary. Check it against the paper before relying on it.
Integrity signals
Registry
Cites
Statistics
Figures
Verification
Claims the paper makes
0 Valid · 2 Not valid · 16 Not checked · 90 Own results and interpretations
A result the paper reports from its own data — it cites no other source for it, so there is none to check. The quote shows it is in the paper.
In the paper
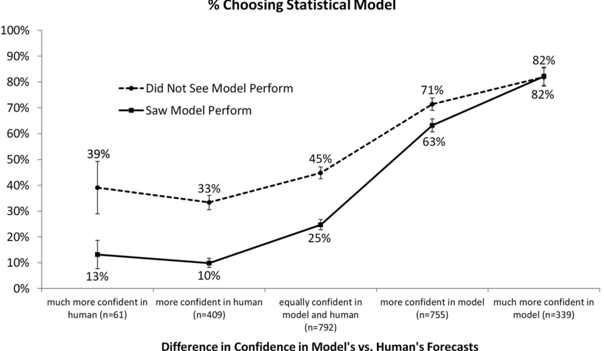
“the majority of people who were equally confident in the model's and human's forecasts chose to tie their bonuses to the human's forecasts, particularly when they had seen the model perform.”
plainstates an association- Asserted: passes — The authors put it forward as true.
- Checkable: passes — It can be checked against evidence.
- Load-bearing: passes — The paper’s conclusions depend on it.
- Based: passes — The paper gives a reason why it holds.
A result the paper reports from its own data — it cites no other source for it, so there is none to check. The quote shows it is in the paper.
In the paper
“Consistent with research on the adoption of decision aids (see Highhouse, 2008), participants thought that the human forecasters were better than the model at getting better with practice, learning from mistakes, and finding underappreciated candidates.”
plain- Asserted: passes — The authors put it forward as true.
- Checkable: passes — It can be checked against evidence.
- Load-bearing: passes — The paper’s conclusions depend on it.
- Based: passes — The paper gives a reason why it holds.
A result the paper reports from its own data — it cites no other source for it, so there is none to check. The quote shows it is in the paper.
In the paper
“Our studies show that this resistance at least partially arises from greater intolerance for error from algorithms than from humans.”
plainstates a possible cause- Asserted: passes — The authors put it forward as true.
- Checkable: passes — It can be checked against evidence.
- Load-bearing: passes — The paper’s conclusions depend on it.
- Based: passes — The paper gives a reason why it holds.
A result the paper reports from its own data — it cites no other source for it, so there is none to check. The quote shows it is in the paper.
In the paper
“Participants rightfully thought that the model was better than human forecasters at avoiding obvious mistakes, appropriately weighing various attributes, and consistently weighing information.”
plain- Asserted: passes — The authors put it forward as true.
- Checkable: passes — It can be checked against evidence.
- Load-bearing: unclear — It is unclear whether the paper’s conclusions depend on it.
- Based: passes — The paper gives a reason why it holds.
A result the paper reports from its own data — it cites no other source for it, so there is none to check. The quote shows it is in the paper.
In the paper
“This effect was evident in two distinct domains of judgment, including one in which the human forecasters produced nearly twice as much error as the algorithm.”
plain- Asserted: passes — The authors put it forward as true.
- Checkable: passes — It can be checked against evidence.
- Load-bearing: unclear — It is unclear whether the paper’s conclusions depend on it.
- Based: passes — The paper gives a reason why it holds.
75 more claims
Create a free account to see all 108 claims and to verify the 12 references still open.
- It may state two separate claims as one. 13
- Probably not a substantial claim. 16
Claims other papers make about this one
Each is checked against this paper’s own text: does it say what the citing paper says it does?
The source backs part of the claim, not all of it — or backs it for a different population, condition or comparison.
In the citing paper
“Traditional theorizing assumes trade-offs between trust and skepticism (Dietvorst et al., 2015), automation and engagement (Freeman et al., 2014), or efficiency and depth (Ishowo-Oloko et al., 2019)”
From Pedagogical partnerships with generative AI in higher education: how dual cognitive pathways paradoxically enable transformative learning (2026) · cites this paper as Dietvorst et al., 2015
Experimental — accuracy not yet measuredThe source backs part of the claim, not all of it — or backs it for a different population, condition or comparison.
In the citing paper
“Existing research typically examines trust versus skepticism in human-AI interactions as binary constructs (Dietvorst et al., 2015; Logg et al., 2019), missing the possibility that partnerships might simultaneously activate both vigilant and offloading behaviors.”
From Pedagogical partnerships with generative AI in higher education: how dual cognitive pathways paradoxically enable transformative learning (2026) · cites this paper as Dietvorst et al., 2015
Experimental — accuracy not yet measuredThe source backs part of the claim, not all of it — or backs it for a different population, condition or comparison.
In the citing paper
“It aligns with the theoretical rationale on algorithm aversion (Dietvorst et al. 2015;Hohensinn et al. 2024) and appreciation (Logg et al. 2019), which suggests that people are more likely to accept and trust AI systems when they produce desirable results but become skeptical when outcomes are unfavorable.”
From Holding AI Accountable Like Herding Cats: The Contingent Impact on the Legitimacy of Algorithmic Bureaucracy (2026) · cites this paper as Dietvorst et al. 2015
Experimental — accuracy not yet measuredThe source backs part of the claim, not all of it — or backs it for a different population, condition or comparison.
In the citing paper
“Research on algorithm appreciation and algorithm aversion further suggests that people may either defer to algorithms or reject them depending on prior experience, perceived expertise, and error visibility (Dietvorst et al., 2015; Logg et al., 2019).”
From College students' metacognitive awareness of generative-AI reliance: an experimental study of decision confidence and attribution bias (2026) · cites this paper as Dietvorst et al., 2015
Experimental — accuracy not yet measuredThe source backs part of the claim, not all of it — or backs it for a different population, condition or comparison.
In the citing paper
“Earlier research has mentioned gender, self-confidence, expertise, and general algorithm aversion or appreciation.15,28”
From Appropriate trust in artificial intelligence for the optical diagnosis of colorectal polyps: the role of human/artificial intelligence interaction (2024) · cites this paper as [28]
Experimental — accuracy not yet measured
22 more claims about this paper
Create a free account to see every claim other papers make about this one.
Statistics recomputed
Every reported test result, recomputed from its test statistic and degrees of freedom. A result shows as not adding up only once an independent check has confirmed it.
- Consistentt(360) = 4.98reported p < .001 · recomputed p < .001
“t (360) = 4.98, p < .001”
- Consistentt(204) = 6.26reported p < .001 · recomputed p < .001
“t (204) = 6.26, p < .001”
- Consistentt(405) = 7.73reported p < .001 · recomputed p < .001
“t (405) = 7.73, p < .001”
- Consistentt(353) = 5.11reported p < .001 · recomputed p < .001
“t (353) = 5.11, p < .001”
- Consistentχ²(1) = 39.94reported p < .001 · recomputed p < .001
“χ 2 (1, N = 271) = 39.94, p < .001”
19 more recomputed tests
Create a free account to see every test the Stats check recomputed.
Self-check
Percentages, sums and reported differences re-computed from the paper’s own numbers.
Self-check results appear here once an independent check has confirmed them.
Citations
Cites
Preacher, K. J., & Hayes, A. F. (2008) · Behavior Research Methods · doi:10.3758/brm.40.3.879 · Cited by 34,117 · cited 1×
“We then used Preacher and Hayes’s (2008) bootstrapping procedure to obtain unbiased 95% confidence intervals around the mediated effects.”
Method(2023) · doi:10.1126/science · Cited by 6,063
The trouble with overconfidence.
Moore, D. A., & Healy, P. J. (2008) · Psychological Review · doi:10.1037/0033-295x.115.2.502 · Cited by 2,358
“Clinical versus Actuarial Judgment.”
Dawes, R. M., Faust, D., & Meehl, P. E. (1989) · Science · doi:10.1126/science.2648573 · Cited by 2,298
The robust beauty of improper linear models in decision making.
Dawes, R. M. (1979) · American Psychologist · doi:10.1037/0003-066x.34.7.571 · Cited by 1,966
Preference and belief: Ambiguity and competence in choice under uncertainty
Heath, C., & Tversky, A. (1991) · Journal of Risk and Uncertainty · doi:10.1007/bf00057884 · Cited by 1,654
Clinical versus mechanical prediction: a meta-analysis
Grove, W. M., Zald, D. H., Lebow, B. S., Snitz, B. E., & Nelson, C. (2000) · Psychological Assessment · doi:10.1037/1040-3590.12.1.19 · Cited by 1,640
Grove, W. M., & Meehl, P. E. (1996) · Psychology, Public Policy, and Law · doi:10.1037/1076-8971.2.2.293 · Cited by 1,457 · cited 4×
“…1996), the notion that algorithms cannot properly consider individual targets (Grove & Meehl, 1996), concerns about the ethicality of relying on algorithms to make important decisions (Dawes, 1979), and the presumed inability of algorithms to incorporate qualitative data (Grove & Meehl, 1996).”
BackgroundMethodInfluential(2007) · Cited by 1,133
Competing on analytics: the new science of winning
(2007) · Choice Reviews Online · doi:10.5860/choice.44-6322 · Cited by 941
Research works printed but not linked: 1
- Clark, D. (2012, November 7). How Nate Silver won the 2012 presidential election. Harvard Business Review Blog . Retrieved from http://blogs .hbr.org/cs/2012/11/how\_nate\_silver\_won\_the\_2012\_p.html
Cited by
Human trust in artificial intelligence: Review of empirical research
Glikson, E., & Woolley, A. W. (2020) · Academy of Management Annals · doi:10.5465/annals.2018.0057 · Cited by 2,921
“Dietvorst et al. (2015) demonstrated a similar effect of an erroneous function, re-ferring to it as algorithm aversion .”
BackgroundAlgorithms at Work: The New Contested Terrain of Control
Kellogg, K. C., Valentine, M. A., & Christin, A. (2020) · Academy of Management Annals · doi:10.5465/annals.2018.0174 · Cited by 2,732
“Finally, in the context of machine learning (e.g., models that perform without using explicit instructions, relying on patterns and inference), algorithms are particularly difficult to decipher (Dietvorst, Simmons, & Massey, 2015; Weld & Bansal, 2018).”
MethodBrave new world: service robots in the frontline
Wirtz, J., Patterson, P. G., Kunz, W. H., Gruber, T., Lu, V. N., Paluch, S., & Martins, A. (2018) · Journal of Service Management · doi:10.1108/josm-04-2018-0119 · Cited by 2,315
Algorithm appreciation: People prefer algorithmic to human judgment
Logg, J. M., Minson, J. A., & Moore, D. A. (2019) · Organizational Behavior and Human Decision Processes · doi:10.1016/j.obhdp.2018.12.005 · Cited by 2,061
Resistance to Medical Artificial Intelligence
Longoni, C., Bonezzi, A., & Morewedge, C. K. (2019) · Journal of Consumer Research · doi:10.1093/jcr/ucz013 · Cited by 2,015
“…Shah, Mullainathan, and Kleinberg, 2019) , lose confidence in statistical models more quickly than in humans after seeing both make the same mistake (Dietvorst et al. 2014), and place greater weight on the same advice given by human experts versus by statistical models ( € Onkal et al. 2009).”
Metadata
- Authors
- Dietvorst, B. J., Simmons, J. P., & Massey, C.
- Affiliations
- University of Pennsylvania (US)
- Venue
- Journal of Experimental Psychology: General
- Published
- 2015
- Volume
- 144
- Issue
- 1
- Pages
- 114-126
- ISSN
- 0096-3445 (ISSN-L)
- 1939-2222
- OpenAlex
- W3125633690
- Cited by
- 3,232
- References
- 22
- Citations by year
- 2026: 1025 · 2025: 563 · 2024: 445 · 2023: 404 · 2022: 266 · 2021: 216 · 2020: 137 · 2019: 88 · 2018: 41 · 2017: 26 · 2016: 14 · 2015: 5
- FWCI
- 13.96
- Type
- journal article
- Language
- en
- Open access
- green
- doi.org
- Locations
- Journal of Experimental Psychology General (publishedVersion)
- SSRN Electronic Journal (publishedVersion)
- PubMed (publishedVersion)
- ScholarlyCommons (University of Pennsylvania) (submittedVersion)
- Funders
- Wharton Behavioral Laboratory
- Wharton Risk Center Ackoff Doctoral Student Fellowship
- Topics
- Social Sciences › Decision Sciences › General Decision Sciences › Decision-Making and Behavioral Economics
- Social Sciences › Decision Sciences › Management Science and Operations Research › Forecasting Techniques and Applications
- Social Sciences › Human Factors and Ergonomics › Human-Automation Interaction and Safety
- Keywords
- algorithm aversion, trust in algorithms, prediction confidence, evidence-based algorithm, decision-making
- MeSH terms
- Algorithms, Avoidance Learning, Culture, Decision Making, Female, Forecasting, Humans, Male, Motivation, Comprehension, Young Adult
About these checks
Registry, retraction, Cites and statistics results are computed, not judged, with one exception: a printed reference that no index lists is read once by a model before it counts as a citation error. Claims are extracted by a model and kept only when their quote appears verbatim in the text; each cited source is then checked, with a model’s help, for whether it says what the claim relies on. Those verdicts can be wrong — read the claim’s quote and the cited source before relying on one.
A language model drew the claims from the paper on 2026-11-14, under version 3 of the claim definition (model deepseek-v4.1-flash, prompt extract-v3).
A second model labelled each claim on 2026-11-14 (model jev-1.13-20260917, definition revision gold-guideline-v0.2).
Statistics and arithmetic are recomputed, not judged.
Confidence bands are shown only for fields calibrated on our annotated test set. None is calibrated yet, so no band is shown.
What counts as a claim ›How we measure confidence ›How we check this ›
Are you an author, or do you see a problem with this page? Request a review
How to cite
Cite CoChat for the checks on this page, and the paper for its own findings.
- This page
- CoChat. (2026). Citation check: Algorithm aversion: People erroneously avoid algorithms after seeing them err. https://app.cochat.ai/papers/10.1037/xge0000033
- The paper
- Dietvorst, B. J., Simmons, J. P., & Massey, C. (2015). Algorithm aversion: People erroneously avoid algorithms after seeing them err. Journal of Experimental Psychology: General. https://doi.org/10.1037/xge0000033
Data sources
Bibliographic data: Semantic Scholar, OpenAlex, Crossref.
Contains information from the Semantic Scholar Academic Graph Datasets, made available under the ODC Attribution License (ODC-BY 1.0).
Semantic Scholar’s data is described in: Kinney, R., et al. (2023). The Semantic Scholar Open Data Platform. arXiv:2301.10140.
