Cited by 140

The DOI matches its Crossref record; 6 of the 6 references it cites were found in a registry or an index.

Metformin lowers Ser-129 phosphorylated α-synuclein levels via mTOR-dependent protein phosphatase 2A activation

Pérez-Revuelta, B I, Hettich, M M, Ciociaro, A, Rotermund, C, Kahle, P J, Krauss, S, Di Monte, D A·2014·Cell Death & Disease

Overview

The claims and statistics of this paper haven’t been checked yet.

Run the check — free, no account needed. It reads the open-access text and checks the sources it cites.

A few free checks a day · papers already verified open instantly · results are public

Integrity signals

Registry

Crossref · 10.1038/cddis.2014.175

Cites

6 of 6 references verified0 citation errors · 0 not checkable

Statistics

Figures

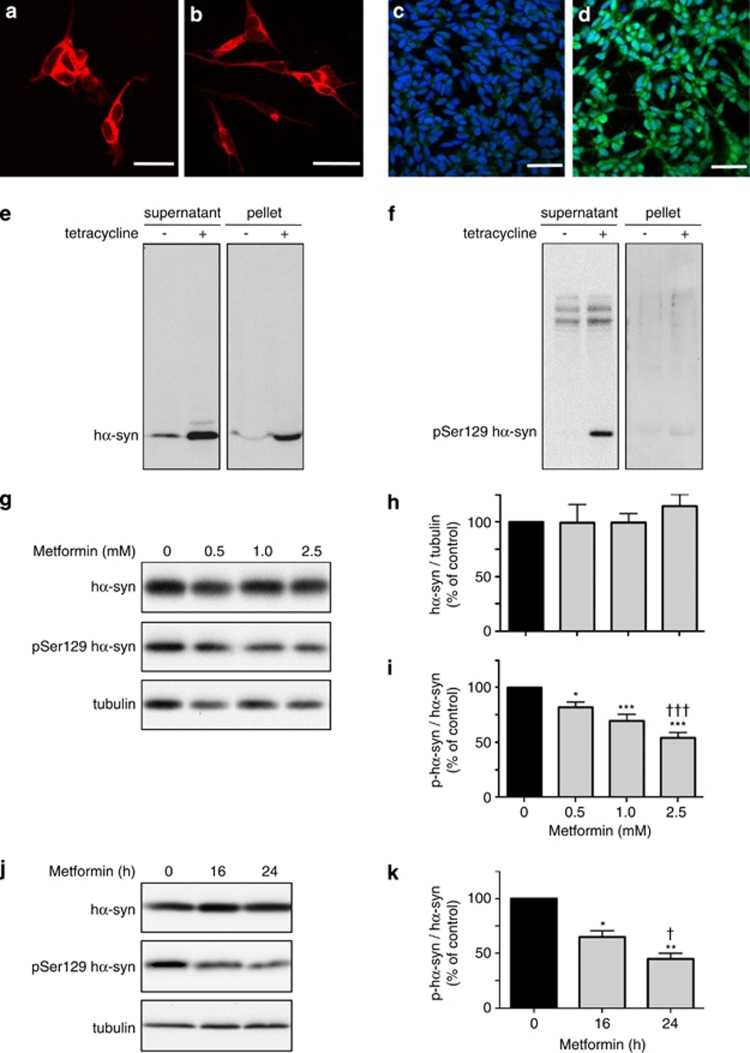
Figure 1 Dose- and time-dependent effect of metformin on phospho-Ser129 α-syn levels in SH-SY5Y cells. SH-SY5Y cells with tetracycline-inducible expression of hα-syn were immunostained with an anti-β-III tubulin antibody, and representative images were taken before (a) and after (b) differentiation treatment with retinoic acid. Differentiated cultures were costained with Dapi (blue) and an anti-phospho-Ser129 α-syn antibody (green); representative images show cells before (c) and after (d) treatment with tetracycline. Scale bars=50 μm. Cells were differentiated with retinoic acid and incubated without or with tetracycline. After cell homogenization, levels of hα-syn (e) and phospho-Ser129 hα-syn (f) were assayed by western blotting in the supernatant and pellet fractions. Cells pretreated with retinoic acid and tetracycline were then incubated for 16 h in the absence or presence of metformin at different concentrations. Levels of hα-syn, phospho-Ser129 hα-syn and tubulin were assayed by immunoblotting in the supernatant fraction (g). Semiquantitative analysis of band intensities is expressed as hα-syn/tubulin ratio (h) or phospho-Ser129 hα-syn/hα-syn ratio (i). In separate experiments, differentiated cells pretreated with tetracycline were incubated in the presence of 2.5 mM metformin. Levels of hα-syn, phospho-Ser129 hα-syn and tubulin were assayed by western blotting at 0 h and after 16 and 24 h (j). Analysis of band intensities is expressed as phospho-Ser129 hα-syn / hα-syn ratio (k). Data in (h, i and k) are the means±S.E.M. of at least three independent experiments. *P<0.05, **P<0.01 and ***P<0.001 versus the respective control group (black bar). †††P<0.001 versus the group treated with 0.5 mM metformin (i). †P<0.05 versus the group treated with metformin for 16 h (k)
Figure 1 Dose- and time-dependent effect of metformin on phospho-Ser129 α-syn levels in SH-SY5Y cells. SH-SY5Y cells with tetracycline-inducible expression of hα-syn were immunostained with an anti-β-III tubulin antibody, and representative images were taken before (a) and after (b) differentiation treatment with retinoic acid. Differentiated cultures were costained with Dapi (blue) and an anti-phospho-Ser129 α-syn antibody (green); representative images show cells before (c) and after (d) treatment with tetracycline. Scale bars=50 μm. Cells were differentiated with retinoic acid and incubated without or with tetracycline. After cell homogenization, levels of hα-syn (e) and phospho-Ser129 hα-syn (f) were assayed by western blotting in the supernatant and pellet fractions. Cells pretreated with retinoic acid and tetracycline were then incubated for 16 h in the absence or presence of metformin at different concentrations. Levels of hα-syn, phospho-Ser129 hα-syn and tubulin were assayed by immunoblotting in the supernatant fraction (g). Semiquantitative analysis of band intensities is expressed as hα-syn/tubulin ratio (h) or phospho-Ser129 hα-syn/hα-syn ratio (i). In separate experiments, differentiated cells pretreated with tetracycline were incubated in the presence of 2.5 mM metformin. Levels of hα-syn, phospho-Ser129 hα-syn and tubulin were assayed by western blotting at 0 h and after 16 and 24 h (j). Analysis of band intensities is expressed as phospho-Ser129 hα-syn / hα-syn ratio (k). Data in (h, i and k) are the means±S.E.M. of at least three independent experiments. *P<0.05, **P<0.01 and ***P<0.001 versus the respective control group (black bar). †††P<0.001 versus the group treated with 0.5 mM metformin (i). †P<0.05 versus the group treated with metformin for 16 h (k)CC BY-NC-ND · PubMed Central
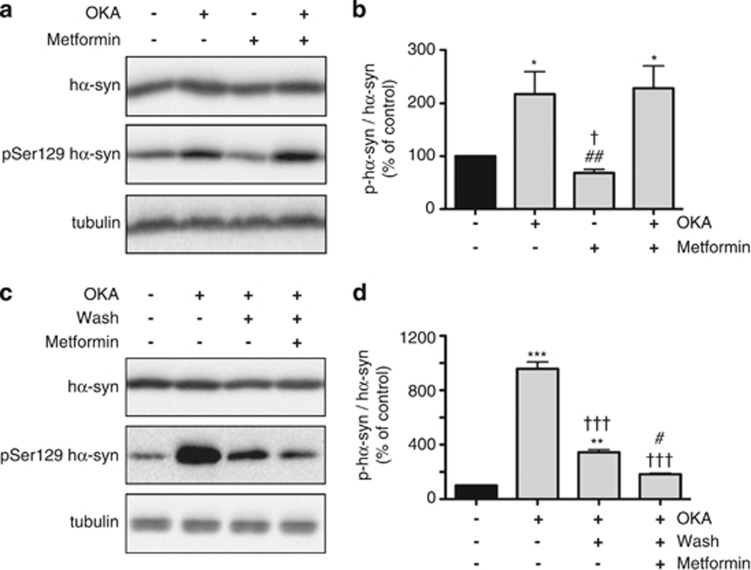
Figure 2 OKA, a PP2A inhibitor, prevents metformin-induced reduction of phospho-Ser129 α-syn. SH-SY5Y cells were pretreated with retinoic acid and tetracycline. Cells were then incubated for 16 h with no addition or in the presence of OKA alone (15 nM), metformin alone (2.5 mM) or both OKA and metformin. Levels of hα-syn, phospho-Ser129 hα-syn and tubulin were assayed by immunoblotting (a). Semiquantitative analysis of band intensities is expressed as phospho-Ser129 hα-syn/hα-syn ratio (b). In separate experiments, cells were treated with no addition or with 300 nM OKA for 4 h, and levels of hα-syn, phospho-Ser129 hα-syn and tubulin were assayed by western blotting (c, first two lanes). In cultures preincubated with OKA, the medium was removed, cells were washed with fresh medium and incubations were continued for 16 h in the absence or presence of 2.5 mM metformin. Levels of hα-syn, phospho-Ser129 hα-syn and tubulin were assayed by western blotting (c, third and fourth lanes). Analysis of band intensities is expressed as phospho-Ser129 hα-syn/hα-syn ratio (d). Data in (b and d) are the means±S.E.M. of at least three independent experiments. *P<0.05, **P<0.01 and ***P<0.001 versus the respective control group (black bar). †P<0.05 versus the group treated with OKA alone (b). ##P<0.01 versus the group treated with both OKA and metformin (b). †††P<0.001 versus the group pretreated with OKA for 4 h (d). #P<0.05 versus the group pretreated with OKA and then incubated in the absence of metformin (d)
Figure 2 OKA, a PP2A inhibitor, prevents metformin-induced reduction of phospho-Ser129 α-syn. SH-SY5Y cells were pretreated with retinoic acid and tetracycline. Cells were then incubated for 16 h with no addition or in the presence of OKA alone (15 nM), metformin alone (2.5 mM) or both OKA and metformin. Levels of hα-syn, phospho-Ser129 hα-syn and tubulin were assayed by immunoblotting (a). Semiquantitative analysis of band intensities is expressed as phospho-Ser129 hα-syn/hα-syn ratio (b). In separate experiments, cells were treated with no addition or with 300 nM OKA for 4 h, and levels of hα-syn, phospho-Ser129 hα-syn and tubulin were assayed by western blotting (c, first two lanes). In cultures preincubated with OKA, the medium was removed, cells were washed with fresh medium and incubations were continued for 16 h in the absence or presence of 2.5 mM metformin. Levels of hα-syn, phospho-Ser129 hα-syn and tubulin were assayed by western blotting (c, third and fourth lanes). Analysis of band intensities is expressed as phospho-Ser129 hα-syn/hα-syn ratio (d). Data in (b and d) are the means±S.E.M. of at least three independent experiments. *P<0.05, **P<0.01 and ***P<0.001 versus the respective control group (black bar). †P<0.05 versus the group treated with OKA alone (b). ##P<0.01 versus the group treated with both OKA and metformin (b). †††P<0.001 versus the group pretreated with OKA for 4 h (d). #P<0.05 versus the group pretreated with OKA and then incubated in the absence of metformin (d)CC BY-NC-ND · PubMed Central
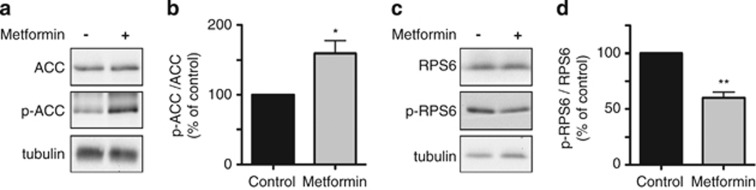
Figure 3 Effects of metformin on AMPK- and mTOR-dependent phosphorylation. SH-SY5Y cells were pretreated with retinoic acid and tetracycline. Cells were then incubated for 16 h with no addition or in the presence of 2.5 mM metformin. Levels of ACC, p-ACC (the product of AMPK-dependent phosphorylation of ACC at Ser79) and tubulin were assayed by immunoblotting (a). Levels of RPS6, p-RPS6 (the product of mTOR-dependent phosphorylation of RPS6 at Ser240/244) and tubulin were measured by western blotting (c). Semiquantitative analysis of band intensities is expressed as p-ACC/ACC (b) or p-RPS6/RPS6 (d) ratios. Data in (b and d) are the means±S.E.M. of at least three independent experiments. *P<0.05 and **P<0.01 versus the respective control group (black bar)
Figure 3 Effects of metformin on AMPK- and mTOR-dependent phosphorylation. SH-SY5Y cells were pretreated with retinoic acid and tetracycline. Cells were then incubated for 16 h with no addition or in the presence of 2.5 mM metformin. Levels of ACC, p-ACC (the product of AMPK-dependent phosphorylation of ACC at Ser79) and tubulin were assayed by immunoblotting (a). Levels of RPS6, p-RPS6 (the product of mTOR-dependent phosphorylation of RPS6 at Ser240/244) and tubulin were measured by western blotting (c). Semiquantitative analysis of band intensities is expressed as p-ACC/ACC (b) or p-RPS6/RPS6 (d) ratios. Data in (b and d) are the means±S.E.M. of at least three independent experiments. *P<0.05 and **P<0.01 versus the respective control group (black bar)CC BY-NC-ND · PubMed Central
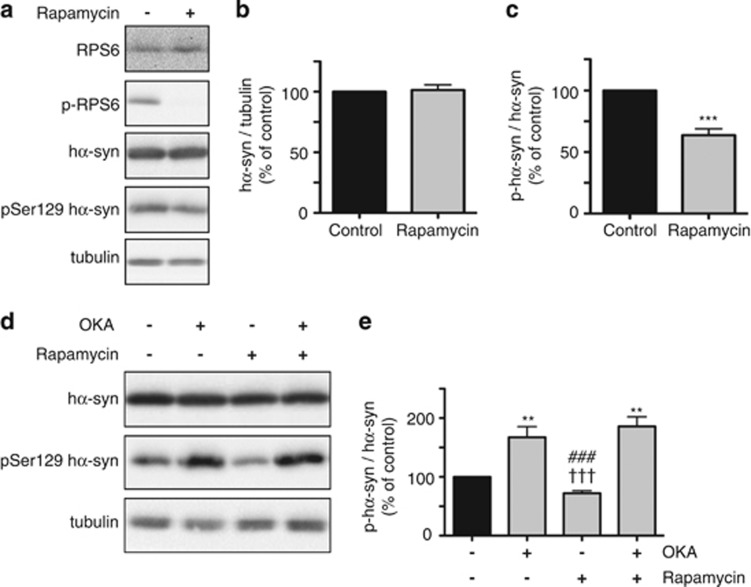
Figure 4 Levels of phospho-Ser129 α-syn are decreased by the mTOR inhibitor rapamycin. SH-SY5Y cells were pretreated with retinoic acid and tetracycline. Cells were then incubated for 16 h with no addition or in the presence of 2 μM rapamycin. Levels of RPS6, p-RPS6, hα-syn, phospho-Ser129 hα-syn and tubulin were assayed by immunoblotting (a). Semiquantitative analysis of band intensities is expressed as hα-syn/tubulin ratio (b) or phospho-Ser129 hα-syn/hα-syn ratio (c). In separate experiments, cells were incubated for 16 h with no addition or in the presence of OKA alone (15 nM), rapamycin alone (2 μM) or both OKA and rapamycin. Levels of hα-syn, phospho-Ser129 hα-syn and tubulin were assayed by immunoblotting (d). Semiquantitative analysis of band intensities is expressed as phospho-Ser129 hα-syn/hα-syn ratio (e). Data in (b, c and e) are the means±S.E.M. of at least three independent experiments. **P<0.01 and ***P<0.001 versus the respective control group (black bar). †††P<0.001 versus the group treated with OKA alone. ###P<0.001 versus the group treated with both OKA and rapamycin
Figure 4 Levels of phospho-Ser129 α-syn are decreased by the mTOR inhibitor rapamycin. SH-SY5Y cells were pretreated with retinoic acid and tetracycline. Cells were then incubated for 16 h with no addition or in the presence of 2 μM rapamycin. Levels of RPS6, p-RPS6, hα-syn, phospho-Ser129 hα-syn and tubulin were assayed by immunoblotting (a). Semiquantitative analysis of band intensities is expressed as hα-syn/tubulin ratio (b) or phospho-Ser129 hα-syn/hα-syn ratio (c). In separate experiments, cells were incubated for 16 h with no addition or in the presence of OKA alone (15 nM), rapamycin alone (2 μM) or both OKA and rapamycin. Levels of hα-syn, phospho-Ser129 hα-syn and tubulin were assayed by immunoblotting (d). Semiquantitative analysis of band intensities is expressed as phospho-Ser129 hα-syn/hα-syn ratio (e). Data in (b, c and e) are the means±S.E.M. of at least three independent experiments. **P<0.01 and ***P<0.001 versus the respective control group (black bar). †††P<0.001 versus the group treated with OKA alone. ###P<0.001 versus the group treated with both OKA and rapamycinCC BY-NC-ND · PubMed Central
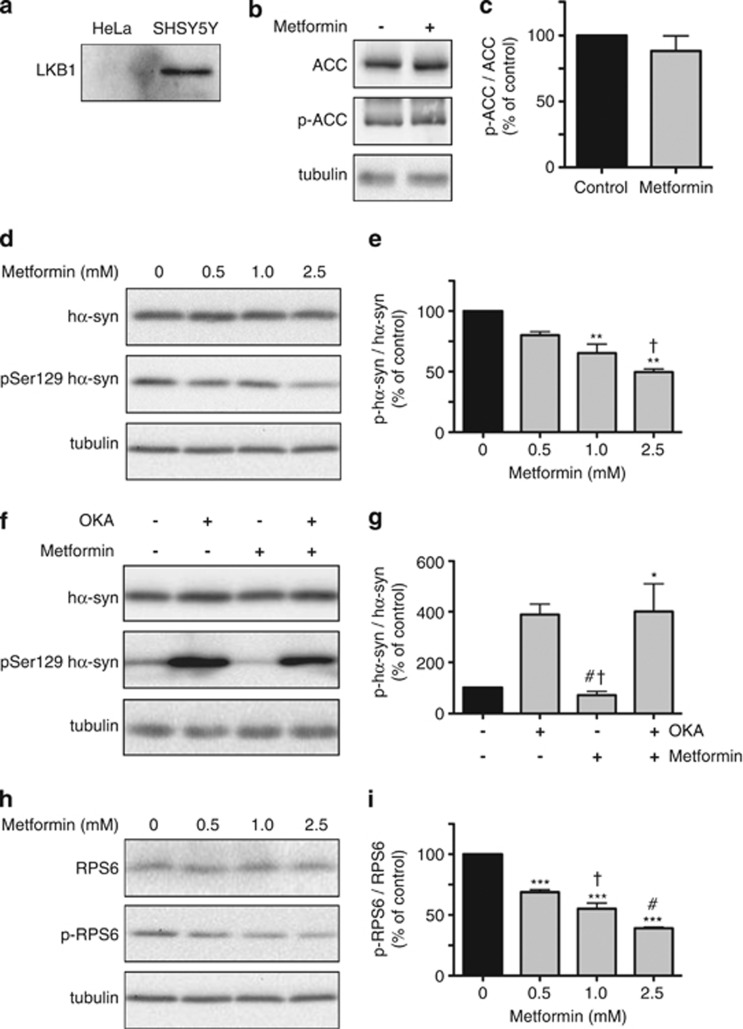
Figure 5 Effects of metformin in HeLa cells. As compared with SHSY5Y cells, HeLa cells do not express LKB1, as indicated by the lack of LKB1 immunoreactivity by immunoblotting (a). Levels of ACC, p-ACC and tubulin were compared in HeLa cells incubated in the absence or presence of 2.5 mM metformin. Proteins were assayed by western blotting (b). Band intensities were quantified and expressed as p-ACC/ACC ratio (c). HeLa cells were transiently transfected with hα-syn and then incubated for 16 h in the absence or presence of metformin at different concentrations. Levels of hα-syn, phospho-Ser129 hα-syn and tubulin were assayed by immunoblotting (d). Semiquantitative analysis of band intensities is expressed as phospho-Ser129 hα-syn/hα-syn ratio (e). In separate experiments, hα-syn-expressing HeLa cells were incubated for 16 h with no addition or in the presence of OKA alone (20 nM), metformin alone (2.5 mM) or both OKA and metformin. Levels of hα-syn, phospho-Ser129 hα-syn and tubulin were assayed by immunoblotting (f). Semiquantitative analysis of band intensities is expressed as phospho-Ser129 hα-syn/hα-syn ratio (g). Levels of RPS6, p-RPS6 and tubulin were compared by western blot analysis in HeLa cells incubated in the absence or presence of metformin at different concentrations (h). Band intensities were quantified and expressed as p-RPS6/RPS6 ratio (i). Data in (c, e, g and i) are the means±S.E.M. of at least three independent experiments. *P<0.05, **P<0.01 and ***P<0.001 versus the respective control group (black bar). †P<0.05 versus the group treated with 0.5 mM metformin (e). †P<0.05 versus the group treated with OKA alone, and #P<0.05 versus the group treated with both OKA and metformin (g). †P<0.05 versus the group treated with 0.5 mM metformin, and #P<0.05 versus the group treated with 1 mM metformin (i)
Figure 5 Effects of metformin in HeLa cells. As compared with SHSY5Y cells, HeLa cells do not express LKB1, as indicated by the lack of LKB1 immunoreactivity by immunoblotting (a). Levels of ACC, p-ACC and tubulin were compared in HeLa cells incubated in the absence or presence of 2.5 mM metformin. Proteins were assayed by western blotting (b). Band intensities were quantified and expressed as p-ACC/ACC ratio (c). HeLa cells were transiently transfected with hα-syn and then incubated for 16 h in the absence or presence of metformin at different concentrations. Levels of hα-syn, phospho-Ser129 hα-syn and tubulin were assayed by immunoblotting (d). Semiquantitative analysis of band intensities is expressed as phospho-Ser129 hα-syn/hα-syn ratio (e). In separate experiments, hα-syn-expressing HeLa cells were incubated for 16 h with no addition or in the presence of OKA alone (20 nM), metformin alone (2.5 mM) or both OKA and metformin. Levels of hα-syn, phospho-Ser129 hα-syn and tubulin were assayed by immunoblotting (f). Semiquantitative analysis of band intensities is expressed as phospho-Ser129 hα-syn/hα-syn ratio (g). Levels of RPS6, p-RPS6 and tubulin were compared by western blot analysis in HeLa cells incubated in the absence or presence of metformin at different concentrations (h). Band intensities were quantified and expressed as p-RPS6/RPS6 ratio (i). Data in (c, e, g and i) are the means±S.E.M. of at least three independent experiments. *P<0.05, **P<0.01 and ***P<0.001 versus the respective control group (black bar). †P<0.05 versus the group treated with 0.5 mM metformin (e). †P<0.05 versus the group treated with OKA alone, and #P<0.05 versus the group treated with both OKA and metformin (g). †P<0.05 versus the group treated with 0.5 mM metformin, and #P<0.05 versus the group treated with 1 mM metformin (i)CC BY-NC-ND · PubMed Central
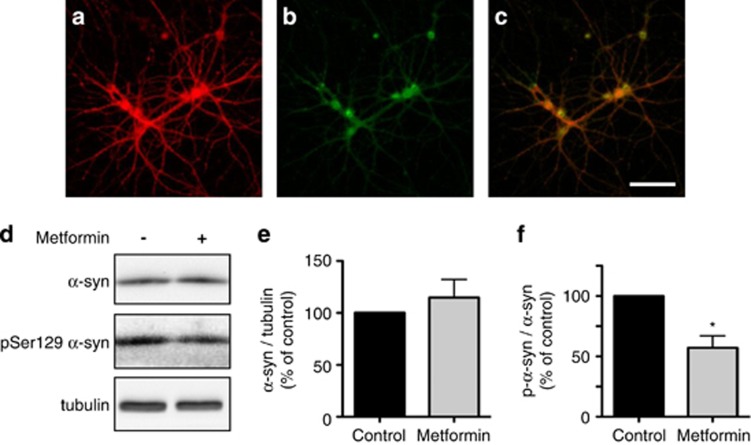
Figure 6 Effect of metformin on phospho-Ser129 α-syn levels in primary hippocampal neurons. Representative images of primary hippocampal neurons immunostained with antibodies against α-syn (a) and phospho-Ser129 α-syn (b). Colocalization is shown in the merged panel (c). Scale bar=100 μm. Primary hippocampal neurons were incubated for 24 h in the absence or presence of 5 μM metformin. Levels of α-syn, phospho-Ser129 α-syn and tubulin were assayed by immunoblotting (d). Semiquantitative analysis of band intensities is expressed as α-syn/tubulin ratio (e) or phospho-Ser129 α-syn/α-syn ratio (f). Data in (e and f) are the means±S.E.M. of at least three independent experiments. *P<0.05 versus the control group (black bar)
Figure 6 Effect of metformin on phospho-Ser129 α-syn levels in primary hippocampal neurons. Representative images of primary hippocampal neurons immunostained with antibodies against α-syn (a) and phospho-Ser129 α-syn (b). Colocalization is shown in the merged panel (c). Scale bar=100 μm. Primary hippocampal neurons were incubated for 24 h in the absence or presence of 5 μM metformin. Levels of α-syn, phospho-Ser129 α-syn and tubulin were assayed by immunoblotting (d). Semiquantitative analysis of band intensities is expressed as α-syn/tubulin ratio (e) or phospho-Ser129 α-syn/α-syn ratio (f). Data in (e and f) are the means±S.E.M. of at least three independent experiments. *P<0.05 versus the control group (black bar)CC BY-NC-ND · PubMed Central
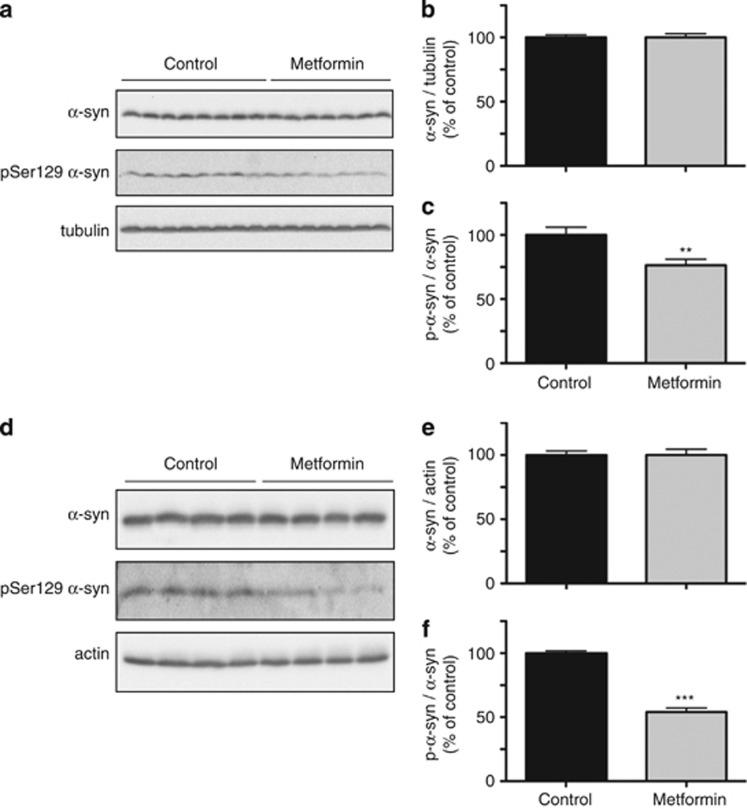
Figure 7 Effect of metformin on phospho-Ser129 α-syn levels in the mouse brain. Mice received 5 g/kg metformin in the food pellet for 1 month (a, b and c) or 5 g/l metformin in the drinking water for 6 months (d, e and f). Levels of α-syn, phospho-Ser129 α-syn, tubulin and actin were assayed by immunoblotting of the brain homogenates (a and d). Semiquantitative analysis of band intensities is expressed as α-syn/tubulin ratio (b), α-syn/actin ratio (e) or phospho-Ser129 α-syn/α-syn ratio (c and f). Data in (b and c) are the means±S.E.M. of 20 mice/group. Data in (e and f) are the means±S.E.M. of four mice/group. **P<0.01 and ***P<0.001 versus the respective control group (black bar)
Figure 7 Effect of metformin on phospho-Ser129 α-syn levels in the mouse brain. Mice received 5 g/kg metformin in the food pellet for 1 month (a, b and c) or 5 g/l metformin in the drinking water for 6 months (d, e and f). Levels of α-syn, phospho-Ser129 α-syn, tubulin and actin were assayed by immunoblotting of the brain homogenates (a and d). Semiquantitative analysis of band intensities is expressed as α-syn/tubulin ratio (b), α-syn/actin ratio (e) or phospho-Ser129 α-syn/α-syn ratio (c and f). Data in (b and c) are the means±S.E.M. of 20 mice/group. Data in (e and f) are the means±S.E.M. of four mice/group. **P<0.01 and ***P<0.001 versus the respective control group (black bar)CC BY-NC-ND · PubMed Central

Verification

Claims the paper makes

The claims and statistics of this paper haven’t been checked yet.

Run the check — free, no account needed. It reads the open-access text and checks the sources it cites.

A few free checks a day · papers already verified open instantly · results are public

Claims other papers make about this one

Each is checked against this paper’s own text: does it say what the citing paper says it does?

Self-check

Percentages, sums and reported differences re-computed from the paper’s own numbers.

The self-check needs the paper’s full text.

Citations

Cites

Research works printed but not linked: 37

  1. Goedert M, Spillantini MG, Cairns NJ, Crowther RA . Tau proteins of Alzhemer paired helical filaments: abnormal phosphorylation of all six brain isoforms. Neuron 1992; 8: 159–168. · DOI
  2. Fujiwara H, Hasegawa M, Dohmae N, Kawashima A, Masliah E, Goldberg MS et al. α-Synuclein is phosphorylated in synucleinopathy lesions. Nat Cell Biol 2002; 4: 160–164. · DOI
  3. Alonso AD, Grundke-Iqbal I, Barra HS, Iqbal K . Abnormal phosphorylation of tau and the mechanism of Alzheimer neurofibrillary degeneration: sequestration of microtubule-associated proteins 1 and 2 and the disassembly of microtubules by the abnormal tau. Proc Natl Acad Sci USA 1997; 94: 298–303. · DOI · Paper page
  4. Spillantini MG, Crowther RA, Jakes R, Hasegawa M, Goerdert M . α-Synuclein in filamentous inclusions of Lewy bodies from Parkinson’s disease and dementia with Lewy bodies. Proc Natl Acad Sci USA 1998; 95: 6469–6473. · DOI · Paper page
  5. Anderson JP, Walker DE, Goldstein JM, de Laat R, Balducci K, Caccavello RJ et al. Phosphorylation of Ser-129 is the dominant pathological modification of α-synuclein in familial and sporadic Lewy body disease. J Biol Chem 2006; 281: 29739–29752. · DOI
  6. Oueslati A, Fournier M, Lashuel HA . Role of post-translational modifications in modulating the structure, function and toxicity of α-synuclein: implications for Parkinson’s disease pathogenesis and therapies. Prog Brain Res 2010; 183: 115–145. · DOI
  7. Okochi M, Walter J, Koyama A, Nakajo S, Baba M, Iwatsubo T et al. Constitutive phosphorylation of the Parkinson's disease associated α-synuclein. J Biol Chem 2000; 275: 390–397. · DOI
  8. Arawaka S, Wada M, Goto S, Karube H, Sakamoto M, Ren CH et al. The role of G-protein-coupled receptor kinase 5 in pathogenesis of sporadic Parkinson's disease. J Neurosci 2006; 26: 9227–9238. · DOI
  9. Mbefo MK, Paleologou KE, Boucharaba A, Oueslati A, Schell H, Fournier M et al. Phosphorylation of synucleins by members of the Polo-like kinase family. J Biol Chem 2010; 285: 2807–2822. · DOI
  10. Lee KW, Chen W, Junn E, Im JY, Grosso H, Sonsalla PK et al. Enhanced phosphatase activity attenuates α-synucleinopathy in a mouse model. J Neurosci 2011; 31: 6963–6971. · DOI
  11. Kickstein E, Krauss S, Thornhill P, Rutschow D, Zeller R, Sharkey J et al. Biguanide metformin acts on tau phosphorylation via mTOR/protein phosphatase 2A (PP2A) signaling. Proc Natl Acad Sci USA 2010; 107: 21830–21835. · DOI · Paper page
  12. Pahlman S, Ruusala AI, Abrahamsson L, Mattsson ME, Esscher T . Retinoic acid-induced differentiation of cultured human neuroblastoma cells: a comparison with phorbolester-induced differentiation. Cell Differ 1984; 14: 135–144. · DOI
  13. Swingle M, Ni L, Honkanen RE . Small-molecule inhibitors of ser/thr protein phosphatases: specificity, use and common forms of abuse. Methods Mol Biol 2007; 365: 23–38.
  14. Boudreau RT, Conrad DM, Hoskin DW . Apoptosis induced by protein phosphatase 2A (PP2A) inhibition in T leukemia cells is negatively regulated by PP2A-associated p38 mitogen-activated protein kinase. Cell Signal 2007; 19: 139–151. · DOI
  15. Van Kanegan MJ, Adams DG, Wadzinski BE, Strack S . Distinct protein phosphatase 2A heterotrimers modulate growth factor signaling to extracellular signal-regulated kinases and Akt. J Biol Chem 2005; 280: 36029–36036. · DOI
  16. Bialojan C, Takai A . Inhibitory effect of a marine-sponge toxin, okadaic acid, on protein phosphatases. Specificity and kinetics. Biochem J 1988; 256: 283–290. · DOI
  17. Dowling RJ, Zakikhani M, Fantus IG, Pollak M, Sonenberg N . Metformin inhibits mammalian target of rapamycin-dependent translation initiation in breast cancer cells. Cancer Res 2007; 67: 10804–10812. · DOI · Paper page
  18. Ha J, Daniel S, Broyles SS, Kim KH . Critical phosphorylation sites for acetyl-CoA carboxylase activity. J Biol Chem 1994; 269: 22162–22168. · DOI
  19. Tiainen M, Ylikorkala A, Makela TP . Growth suppression by Lkb1 is mediated by a G(1) cell cycle arrest. Proc Natl Acad Sci USA 1999; 96: 9248–9251. · DOI
  20. Memmott RM, Dennis PA . LKB1 and mammalian target of rapamycin as predictive factors for the anticancer efficacy of metformin. J Clin Oncol 2009; 27: e226. · DOI
  21. Lalau JD, Lemaire-Hurtel AS, Lacroix C . Establishment of a database of metformin plasma concentrations and erythrocyte levels in normal and emergency situations. Clin Drug Investig 2011; 31: 435–438. · DOI
  22. Choi MK, Song IS . Organic cation transporters and their pharmacokinetic and pharmacodynamic consequences. Drug Metab Pharmacokinet 2008; 23: 243–253. · DOI
  23. Ahlin G, Hilgendorf C, Karlsson J, Szigyarto CA, Uhlen M, Artursson P . Endogenous gene and protein expression of drug-transporting proteins in cell lines routinely used in drug discovery programs. Drug Metab Dispos 2009; 37: 2275–2283. · DOI
  24. Ciarimboli G, Deuster D, Knief A, Sperling M, Holtkamp M, Edemir B et al. Organic cation transporter 2 mediates cisplatin-induced oto- and nephrotoxicity and is a target for protective interventions. Am J Pathol 2010; 176: 1169–1180. · DOI
  25. Lee G, Dallas S, Hong M, Bendayan R . Drug transporters in the central nervous system: brain barriers and brain parenchyma considerations. Pharmacol Rev 2001; 53: 569–596. · DOI
  26. Jung CH, Ro SH, Cao J, Otto NM, Kim DH . mTOR regulation of autophagy. FEBS Lett 2010; 584: 1287–1295. · DOI · Paper page
  27. Liu E, Knutzen CA, Krauss S, Schweiger S, Chiang GG . Control of mTORC1 signaling by the Opitz syndrome protein MID1. Proc Natl Acad Sci USA 2011; 108: 8680–8685. · DOI
  28. Kalender A, Selvaraj A, Kim SY, Gulati P, Brule S, Viollet B et al. Metformin, independent of AMPK, inhibits mTORC1 in a rag GTPase-dependent manner. Cell Metab 2010; 11: 390–401. · DOI · Paper page
  29. Ben Sahra I, Regazzetti C, Robert G, Laurent K, Le Marchand-Brustel Y, Auberger P et al. Metformin, independent of AMPK, induces mTOR inhibition and cell-cycle arrest through REDD1. Cancer Res 2011; 71: 4366–4372. · DOI · Paper page
  30. Trockenbacher A, Suckow V, Foerster J, Winter J, Krauss S, Ropers HH et al. MID1, mutated in Opitz syndrome, encodes an ubiquitin ligase that targets phosphatase 2A for degradation. Nat Genet 2001; 29: 287–294. · DOI
  31. Khandelwal PJ, Dumanis SB, Feng LR, Maguire-Zeiss K, Rebeck G, Lashuel HA et al. Parkinson-related parkin reduces α-synuclein phosphorylation in a gene transfer model. Mol Neurodegener 2010; 5: 47. · DOI
  32. Febbrano F, Sahin G, Farran A, Soares S, Jensen PH, Kirik D et al. Ser129D mutant α-synuclein induces earlier motor dysfunction while S129A results in distinctive pathology in a rat model of Parkinson’s disease. Neurobiol Dis 2013; 56: 47–58. · DOI
  33. Braithwaite SP, Stock JB, Mouradian MM . α-Synuclein phosphorylation as a therapeutic target in Parkinson’s disease. Rev Neurosci 2012; 23: 191–198. · DOI
  34. Galpern WR, Lang AE . Interface between tauopathies and synucleinopathies: a tale of two proteins. Ann Neurol 2006; 59: 449–458. · DOI
  35. Irwin DJ, Lee VM, Trojanowski JQ . Parkinson's disease dementia: convergence of α-synuclein, tau and amyloid-β pathologies. Nat Rev Neurosci 2013; 14: 626–636. · DOI
  36. Guo JL, Covell DJ, Daniels JP, Iba M, Stieber A, Zhang B et al. Distinct α-synuclein strains differentially promote tau inclusions in neurons. Cell 2013; 154: 103–117. · DOI · Paper page
  37. Hasegawa T, Konno M, Baba T, Sugeno N, Kikuchi A, Kobayashi M et al. The AAA-ATPase VPS4 regulates extracellular secretion and lysosomal targeting of α-synuclein. PLoS One 2011; 6: e29460. · DOI

Cited by

Sorted by citations

See all 140

Metadata

Authors
Pérez-Revuelta, B. I., Hettich, M. M., Ciociaro, A., Rotermund, C., Kahle, P. J., Krauss, S., & Di Monte, D. A.
Venue
Cell Death & Disease
Published
2014-05-08
Volume
5
Issue
5
Pages
e1209-e1209
ISSN
2041-4889
Cited by
140
References
6
Language
en

About these checks

Registry, retraction, Cites and statistics results are computed, not judged, with one exception: a printed reference that no index lists is read once by a model before it counts as a citation error. Claims are extracted by a model and kept only when their quote appears verbatim in the text; each cited source is then checked, with a model’s help, for whether it says what the claim relies on. Those verdicts can be wrong — read the claim’s quote and the cited source before relying on one.

Statistics and arithmetic are recomputed, not judged.

Confidence bands are shown only for fields calibrated on our annotated test set. None is calibrated yet, so no band is shown.

What counts as a claim ›How we measure confidence ›How we check this ›

Are you an author, or do you see a problem with this page? Request a review