

The DOI matches its Crossref record; 48 of the 48 references it cites were found in a registry or an index.
Disrupted autophagy after spinal cord injury is associated with ER stress and neuronal cell death
Open accessAbstract
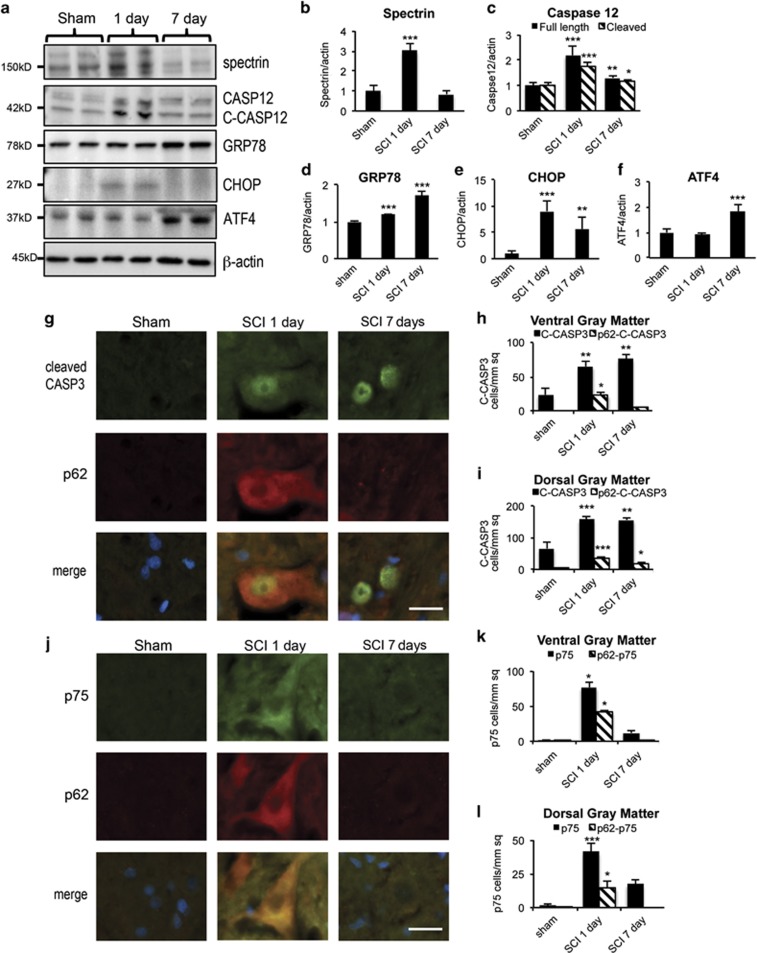
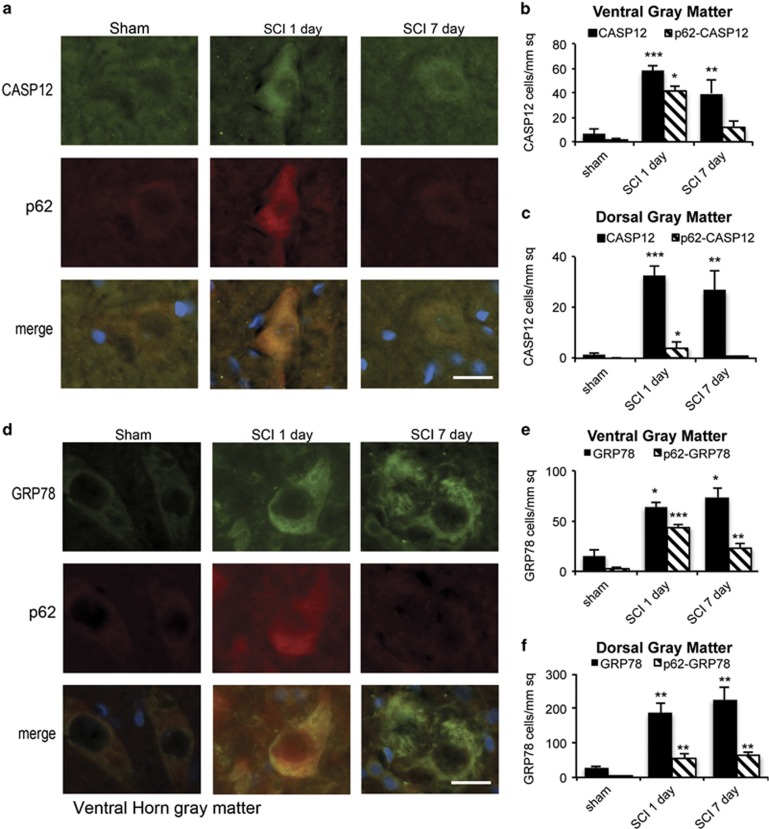
Autophagy is a catabolic mechanism facilitating degradation of cytoplasmic proteins and organelles in a lysosome-dependent manner. Autophagy flux is necessary for normal neuronal homeostasis and its dysfunction contributes to neuronal cell death in several neurodegenerative diseases. Elevated autophagy has been reported after spinal cord injury (SCI); however, its mechanism, cell type specificity and relationship to cell death are unknown. Using a rat model of contusive SCI, we observed accumulation of LC3-II-positive autophagosomes starting at posttrauma day 1. This was accompanied by a pronounced accumulation of autophagy substrate protein p62, indicating that early elevation of autophagy markers reflected disrupted autophagosome degradation. Levels of lysosomal protease cathepsin D and numbers of cathepsin-D-positive lysosomes were also decreased at this time, suggesting that lysosomal damage may contribute to the observed defect in autophagy flux. Normalization of p62 levels started by day 7 after SCI, and was associated with increased cathepsin D levels. At day 1 after SCI, accumulation of autophagosomes was pronounced in ventral horn motor neurons and dorsal column oligodendrocytes and microglia. In motor neurons, disruption of autophagy strongly correlated with evidence of endoplasmic reticulum (ER) stress. As autophagy is thought to protect against ER stress, its disruption after SCI could contribute to ER-stress-induced neuronal apoptosis. Consistently, motor neurons showing disrupted autophagy co-expressed ER-stress-associated initiator caspase 12 and cleaved executioner caspase 3. Together, these findings indicate that SCI causes lysosomal dysfunction that contributes to autophagy disruption and associated ER-stress-induced neuronal apoptosis.
Overview
The claims and statistics of this paper haven’t been checked yet.
Run the check — free, no account needed. It reads the open-access text and checks the sources it cites.
Integrity signals
Registry
Cites
Statistics
Figures
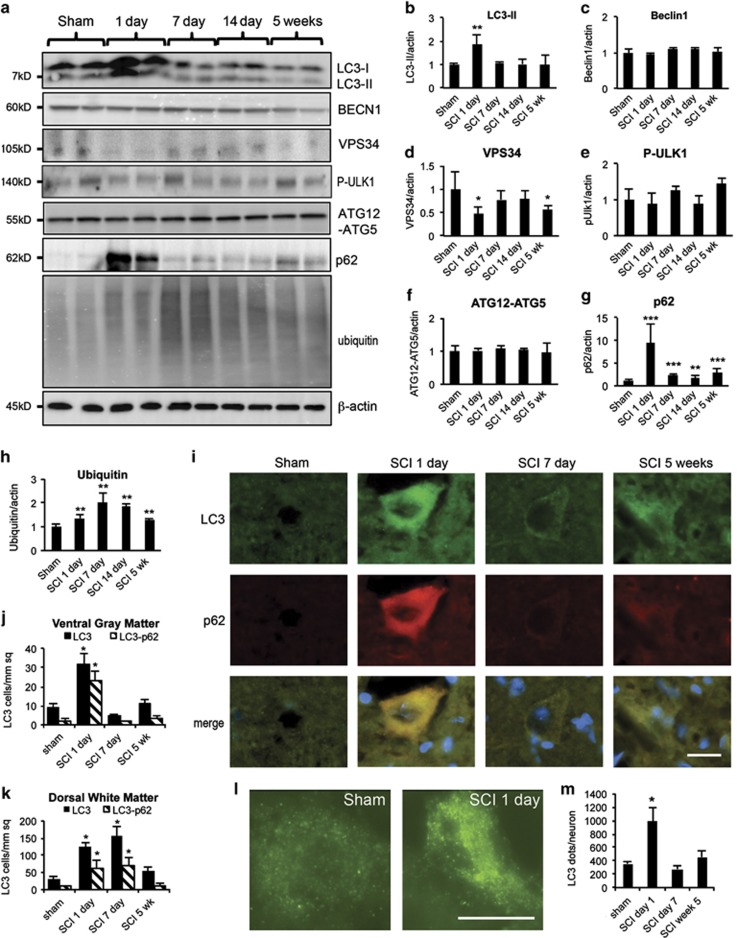
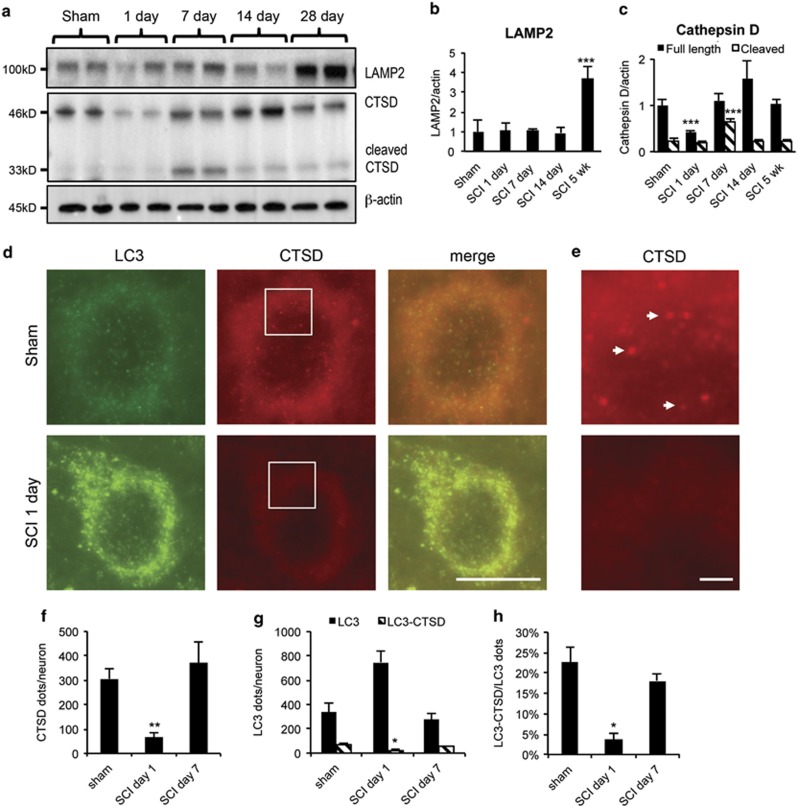
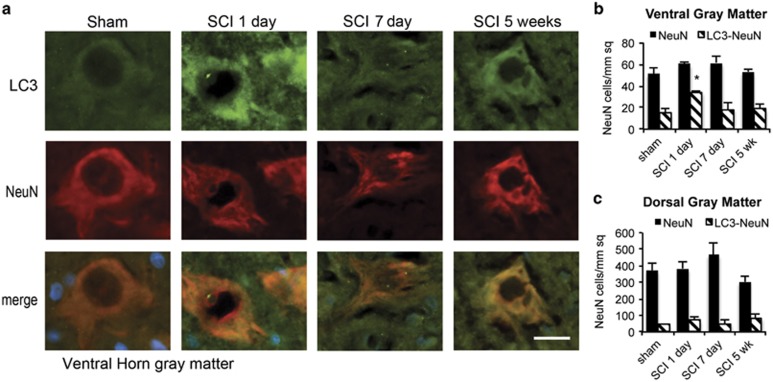
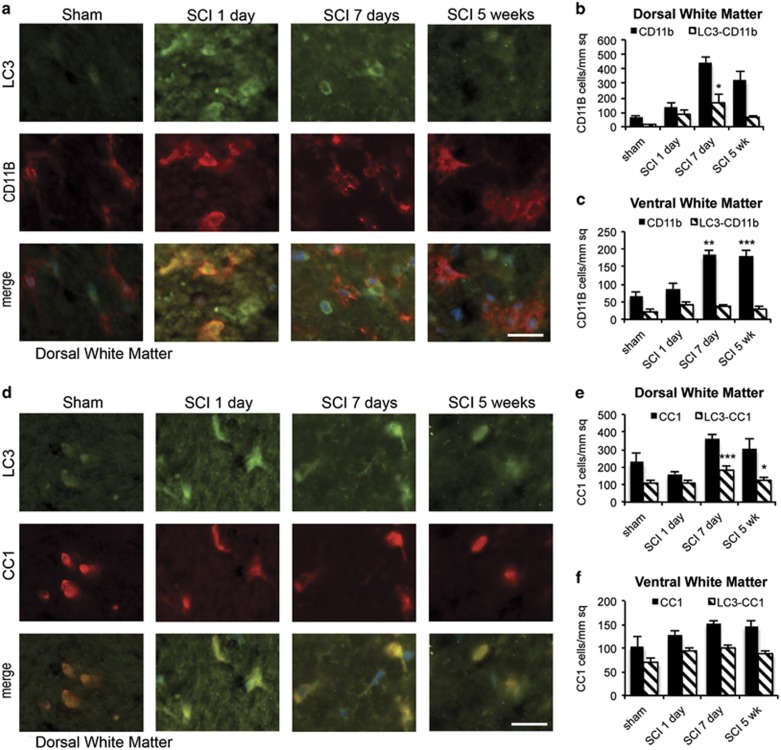
Verification
Claims the paper makes
The claims and statistics of this paper haven’t been checked yet.
Run the check — free, no account needed. It reads the open-access text and checks the sources it cites.
Claims other papers make about this one
Each is checked against this paper’s own text: does it say what the citing paper says it does?
In the citing paper
“These observations suggest that oligodendrocyte autophagy may play a necessary but insufficient role in post-injury repair of the spinal cord [453],”
From Autophagy and ALS: mechanistic insights and therapeutic implications (2022) · cites this paper as [453]
In the citing paper
“but excessive autophagy in oligodendrocytes may lead to neuronal toxicity in a non-cell autonomous manner.”
From Autophagy and ALS: mechanistic insights and therapeutic implications (2022) · cites this paper as [453]
Self-check
Percentages, sums and reported differences re-computed from the paper’s own numbers.
The self-check needs the paper’s full text.
Citations
Cites
Repertoires of Autophagy in the Pathogenesis of Ocular Diseases
Li, Y., Jiang, Q. L., Cao, G.-F., Yao, J., & Yan, B. (2015) · Cellular Physiology and Biochemistry · doi:10.1159/000373980 · Cited by 16,351
Autophagy: Renovation of Cells and Tissues
Mizushima, N., & Komatsu, M. (2011) · Cell · doi:10.1016/j.cell.2011.10.026 · Cited by 6,615
Autophagy fights disease through cellular self-digestion
Mizushima, N., Levine, B., Cuervo, A. M., & Klionsky, D. J. (2008) · Nature · doi:10.1038/nature06639 · Cited by 6,452
Control of inositol 1,4,5-trisphosphate-induced Ca2+ release by cytosolic Ca2+
Bootman, M. D., Missiaen, L., Parys, J. B., SMEDT, H. D., & Casteels, R. (1995) · Biochemical Journal · doi:10.1042/bj3060445 · Cited by 5,131
Suppression of basal autophagy in neural cells causes neurodegenerative disease in mice
Hara, T., Nakamura, K., Matsui, M., Yamamoto, A., Nakahara, Y., Suzuki-Migishima, R., Yokoyama, M., Mishima, K., Saito, I., Okano, H., et al. (2006) · Nature · doi:10.1038/nature04724 · Cited by 3,882
Mutation of the mouse klotho gene leads to a syndrome resembling ageing
Kuro-o, M., Matsumura, Y., Aizawa, H., Kawaguchi, H., Suga, T., Utsugi, T., Ohyama, Y., Kurabayashi, M., Kaname, T., Kume, E., et al. (1997) · Nature · doi:10.1038/36285 · Cited by 3,837
Levine, B., & Klionsky, D. J. (2004) · Developmental Cell · doi:10.1016/s1534-5807(04)00099-1 · Cited by 3,728
Autophagy as a Regulated Pathway of Cellular Degradation
Klionsky, D. J., & Emr, S. D. (2000) · Science · doi:10.1126/science.290.5497.1717 · Cited by 3,630
Loss of autophagy in the central nervous system causes neurodegeneration in mice
Komatsu, M., Waguri, S., Chiba, T., Murata, S., Iwata, J.-I., Tanida, I., Ueno, T., Koike, M., Uchiyama, Y., Kominami, E., et al. (2006) · Nature · doi:10.1038/nature04723 · Cited by 3,500
Caspase-12 mediates endoplasmic-reticulum-specific apoptosis and cytotoxicity by amyloid-β
Nakagawa, T., Zhu, H., Morishima, N., Li, E., Xu, J., Yankner, B. A., & Yuan, J. (2000) · Nature · doi:10.1038/47513 · Cited by 3,292
Cited by
Sorted by citations
Rong, Y., Liu, W., Wang, J., Fan, J., Luo, Y., Li, L., Kong, F., Chen, J., Tang, P., & Cai, W. (2019) · Cell Death & Disease · doi:10.1038/s41419-019-1571-8 · Cited by 333
Liu, W. Y., Wang, Y., Gong, F., Rong, Y., Luo, Y., Tang, P., Zhou, Z., Zhou, Z., Xu, T., Jiang, T., et al. (2018) · Journal of Neurotrauma · doi:10.1089/neu.2018.5835 · Cited by 330
Programmed cell death in spinal cord injury pathogenesis and therapy
Shi, Z., Yuan, S., Shi, L., Li, J., Ning, G., Kong, X., & Feng, S. (2021) · Cell Proliferation · doi:10.1111/cpr.12992 · Cited by 299
Blood–Spinal Cord Barrier in Spinal Cord Injury: A Review
Jin, L., Li, J., Wang, K., Xia, W., Zhu, Z., Wang, C., Li, X., & Liu, H. (2020) · Journal of Neurotrauma · doi:10.1089/neu.2020.7413 · Cited by 301
Autophagy in acute brain injury
Galluzzi, L., Bravo-San Pedro, J. M., Blomgren, K., & Kroemer, G. (2016) · Nature Reviews Neuroscience · doi:10.1038/nrn.2016.51 · Cited by 234
Function and Mechanisms of Autophagy in Brain and Spinal Cord Trauma
Lipinski, M. M., Wu, J., Faden, A. I., & Sarkar, C. (2015) · Antioxidants and Redox Signaling · doi:10.1089/ars.2015.6306 · Cited by 221
Self-citationWu, C., Chen, H. A., Zhuang, R., Zhang, H., Wang, Y., Hu, X., Xu, Y. M., Li, J., Li, Y., Wang, X., et al. (2021) · International Journal of Biological Sciences · doi:10.7150/ijbs.57825 · Cited by 206
Autophagy and ALS: mechanistic insights and therapeutic implications
Chua, J. P., De Calbiac, H., Kabashi, E., & Barmada, S. J. (2022) · Autophagy · doi:10.1080/15548627.2021.1926656 · Cited by 189
“These observations suggest that oligodendrocyte autophagy may play a necessary but insufficient role in post-injury repair of the spinal cord [453], but excessive autophagy in oligo-”
BackgroundThe role of autophagy in modulation of neuroinflammation in microglia
Su, P., Zhang, J., Wang, D., Zhao, F., Cao, Z., Aschner, M., & Luo, W. (2016) · Neuroscience · doi:10.1016/j.neuroscience.2016.01.035 · Cited by 186
Wang, C., Wang, Q., Lou, Y., Xu, J., Feng, Z., Chen, Y., Tang, Q., Zheng, G., Zhang, Z., Wu, Y., et al. (2017) · Journal of Cellular and Molecular Medicine · doi:10.1111/jcmm.13368 · Cited by 184
Autophagy induction stabilizes microtubules and promotes axon regeneration after spinal cord injury
He, M., Ding, Y., Chu, C., Tang, J. Y., Xiao, Q., & Luo, Z. (2016) · Proceedings of the National Academy of Sciences · doi:10.1073/pnas.1611282113 · Cited by 179
Zhou, K., Zheng, Z., Li, Y., Han, W., Zhang, J., Mao, Y., Chen, H. A., Zhang, W., Liu, M., Xie, L., et al. (2020) · Theranostics · doi:10.7150/thno.46566 · Cited by 158
Liu, S., Li, Y., Choi, H., Sarkar, C., Koh, E. Y., Wu, J., & Lipinski, M. M. (2018) · Cell Death and Disease · doi:10.1038/s41419-018-0469-1 · Cited by 154
Self-citationEl‐Horany, H. E., El‐latif, R. N. A., ElBatsh, M. M., & Emam, M. N. (2016) · Journal of Biochemical and Molecular Toxicology · doi:10.1002/jbt.21821 · Cited by 136
Metformin Improves Functional Recovery After Spinal Cord Injury via Autophagy Flux Stimulation
Zhang, D., Xuan, J., Zheng, B., Zhou, Y., Lin, Y., Wu, Y., Zhou, Y., Huang, Y.-X., Wang, Q., Shen, L., et al. (2016) · Molecular Neurobiology · doi:10.1007/s12035-016-9895-1 · Cited by 134
Autophagy in Neurotrauma: Good, Bad, or Dysregulated
Wu, J., & Lipinski, M. M. (2019) · Cells · doi:10.3390/cells8070693 · Cited by 127
Self-citationLi, Y., Lei, Z., Ritzel, R. M., He, J., Li, H., Choi, H., Lipinski, M. M., & Wu, J. (2022) · Theranostics · doi:10.7150/thno.72713 · Cited by 131
Self-citationWu, J., Zhao, Z., Kumar, A., Lipinski, M. M., Loane, D. J., Stoica, B. A., & Faden, A. I. (2016) · Journal of Neurotrauma · doi:10.1089/neu.2015.4348 · Cited by 124
Self-citationWang, X., Yang, H., Wang, M.-G., Yang, D.-B., Wang, Z., & Wang, L. (2017) · Cell Death and Disease · doi:10.1038/cddis.2017.475 · Cited by 123
Combination of autophagy and NFE2L2/NRF2 activation as a treatment approach for neuropathic pain
Li, J., Tian, M., Hua, T., Wang, H., Yang, M., Li, W., Zhang, X., & Yuan, H. (2021) · Autophagy · doi:10.1080/15548627.2021.1900498 · Cited by 123
Kong, F., Ma, L., Guo, J., Xu, L., Li, Y., & Qu, S. (2017) · Clinical Science · doi:10.1042/cs20171432 · Cited by 115
Fan, H., Tang, H.-B., Kang, J., Shan, L., Song, H., Zhu, K., Wang, J., Ju, G., & Wang, Y. (2015) · Neuroscience · doi:10.1016/j.neuroscience.2015.10.049 · Cited by 441
Khan, N., Cao, T., He, J., Ritzel, R. M., Li, Y., Henry, R. J., Colson, C., Stoica, B. A., Faden, A. I., & Wu, J. (2020) · Brain Behavior and Immunity · doi:10.1016/j.bbi.2020.12.007 · Cited by 106
Self-citationLuo, B., Lin, Y., Jiang, S., Huang, L. F., Yao, H., Zhuang, Q., Zhao, R., Liu, H., He, C., & Lin, Z. (2016) · Cell Death and Disease · doi:10.1038/cddis.2016.78 · Cited by 103
Matyas, J. J., O’Driscoll, C. M., Yu, L. L., Coll-Miró, M., Daugherty, S. C., Renn, C. L., Faden, A. I., Dorsey, S. G., & Wu, J. (2017) · Journal of Neuroscience · doi:10.1523/jneurosci.3353-16.2017 · Cited by 102
Self-citationCocaine induces astrocytosis through ER stress-mediated activation of autophagy
Periyasamy, P., Guo, M., & Buch, S. J. (2016) · Autophagy · doi:10.1080/15548627.2016.1183844 · Cited by 99
Niu, Q., Chen, J., Xia, T., Li, P., Zhou, G., Xu, C., Zhao, Q., Dong, L., Zhang, S., & Wang, A. (2017) · Environmental Pollution · doi:10.1016/j.envpol.2017.09.015 · Cited by 96
The role of PI3K/Akt signalling pathway in spinal cord injury
Xiao, C.-L., Yin, W.-C., Zhong, Y., Luo, J.-Q., Liu, L., Liu, W.-Y., & Zhao, K. (2022) · Biomedicine & Pharmacotherapy · doi:10.1016/j.biopha.2022.113881 · Cited by 95
Molecular network of neuronal autophagy in the pathophysiology and treatment of depression
Jia, J., & Le, W. (2015) · Neuroscience Bulletin · doi:10.1007/s12264-015-1548-2 · Cited by 92
Liu, F., Li, X., Lu, C., Bai, A., Bielawski, J., Bielawska, A. E., Marshall, B., Schoenlein, P. V., Lebedyeva, I., & Liu, K. (2016) · Oncotarget · doi:10.18632/oncotarget.13438 · Cited by 93
Wang, Z., Zhou, L., Zheng, X., Chen, G., Pan, R., Li, J., & Liu, W. (2017) · Neuroscience Letters · doi:10.1016/j.neulet.2017.07.036 · Cited by 74
Modulation of autophagy for neuroprotection and functional recovery in traumatic spinal cord injury
Ray, S. K. (2020) · Neural Regeneration Research · doi:10.4103/1673-5374.276322 · Cited by 78
Zheng, G., Zhan, Y., Wang, H., Luo, Z., Zheng, F., Zhou, Y., Wu, Y., Wang, S., Wu, Y., Xiang, G., et al. (2019) · EBioMedicine · doi:10.1016/j.ebiom.2018.12.059 · Cited by 77
Sabirzhanov, B. E., Li, Y., Coll-Miro, M., Matyas, J. J., He, J., Kumar, A., Ward, N., Yu, J., Faden, A. I., & Wu, J. (2019) · Brain Behavior and Immunity · doi:10.1016/j.bbi.2019.02.024 · Cited by 74
Self-citationLin, W., Xiong, G.-P., Lin, Q., Chen, X., Zhang, L., Shi, J., Ke, Q., & Lin, J. (2016) · Journal of Neuroinflammation · doi:10.1186/s12974-016-0521-y · Cited by 72
The Temporal Pattern, Flux, and Function of Autophagy in Spinal Cord Injury
Zhou, K., Sansur, C. A., Xu, H., & Jia, X. (2017) · International Journal of Molecular Sciences · doi:10.3390/ijms18020466 · Cited by 77
Blocking Autophagy in Oligodendrocytes Limits Functional Recovery after Spinal Cord Injury
Saraswat Ohri, S., Bankston, A. N., Mullins, S. A., Liu, Y., Andres, K. R., Beare, J. E., Howard, R. M., Burke, D. A., Riegler, A. S., Smith, A. E., et al. (2018) · The Journal of Neuroscience · doi:10.1523/jneurosci.0679-17.2018 · Cited by 70
Duan, X., Wang, W., Feng, D., Yin, J., Zuo, G., Chen, D., Chen, Z., Li, H., Zhong, W., & Chen, G. (2017) · CNS Neuroscience & Therapeutics · doi:10.1111/cns.12703 · Cited by 72
Wang, J., Rong, Y., Ji, C., Lv, C., Jiang, D., Ge, X., Gong, F., Tang, P., Cai, W., Liu, W., et al. (2020) · Journal of Nanobiotechnology · doi:10.1186/s12951-020-00630-5 · Cited by 70
Li, Y., Jones, J. W., Choi, H., Sarkar, C., Kane, M. A., Koh, E. Y., Lipinski, M. M., & Wu, J. (2019) · Cell Death and Disease · doi:10.1038/s41419-019-1764-1 · Cited by 69
Self-citationAge-dependent autophagy induction after injury promotes axon regeneration by limiting NOTCH
Ko, S. H., Apple, E. C., Liu, Z., & Chen, L. (2020) · Autophagy · doi:10.1080/15548627.2020.1713645 · Cited by 69
Biological Functions and Therapeutic Potential of Autophagy in Spinal Cord Injury
Liao, H.-Y., Wang, Z.-Q., Ran, R., Zhou, K., Ma, C.-W., & Zhang, H. (2021) · Frontiers in Cell and Developmental Biology · doi:10.3389/fcell.2021.761273 · Cited by 60
Zhou, Y., Zhang, H., Zheng, B., Ye, L., Zhu, S., Johnson, N. R., Wang, Z., Wei, X., Chen, D., Cao, G., et al. (2015) · International Journal of Biological Sciences · doi:10.7150/ijbs.13229 · Cited by 63
Chen, S., Tian, H., Gong, Q., Cai, L., Yao, J., Wang, W., & Yang, D. (2022) · Neural Regeneration Research · doi:10.4103/1673-5374.335163 · Cited by 60
Gu, Y., Cheng, S., Chen, G., Shen, Y., Li, X., Jiang, Q. L., Li, J., & Cao, Y. (2016) · Toxicology Mechanisms and Methods · doi:10.1080/15376516.2016.1273429 · Cited by 57
Meng, H., Shao, D., Li, H., Huang, X., Yang, G., Xu, B. Y., & Niu, H. (2018) · Molecular Medicine Reports · doi:10.3892/mmr.2018.9194 · Cited by 55
Tran, A. P., Warren, P. M., & Silver, J. (2020) · Experimental Neurology · doi:10.1016/j.expneurol.2020.113276 · Cited by 52
The PARK10 gene USP24 is a negative regulator of autophagy and ULK1 protein stability
Thayer, J. A., Awad, O., Hegdekar, N., Sarkar, C., Tesfay, H., Burt, C. I., Zeng, X., Feldman, R. A., & Lipinski, M. M. (2019) · Autophagy · doi:10.1080/15548627.2019.1598754 · Cited by 52
Self-citationZheng, Z., Zhou, Y., Ye, L., Lu, Q., Zhang, K., Zhang, J., Xie, L., Wu, Y., Xu, K., Zhang, H., et al. (2019) · Experimental Neurology · doi:10.1016/j.expneurol.2019.113138 · Cited by 53
Autophagy Inhibition Favors Survival of Rubrospinal Neurons After Spinal Cord Hemisection
Bisicchia, E., Latini, L., Cavallucci, V., Sasso, V., Nicolin, V., Molinari, M., D’Amelio, M., & Viscomi, M. T. (2016) · Molecular Neurobiology · doi:10.1007/s12035-016-0031-z · Cited by 53
Morphine-Mediated Brain Region-Specific Astrocytosis Involves the ER Stress-Autophagy Axis
Sil, S., Periyasamy, P., Guo, M., Callen, S. E., & Buch, S. J. (2018) · Molecular Neurobiology · doi:10.1007/s12035-018-0878-2 · Cited by 52
Role of autophagy in the bimodal stage after spinal cord ischemia reperfusion injury in rats
Fang, B., Li, X., Bao, N. T. Y., Tan, W., Chen, F., Pi, X.-L., Zhang, Y., & Ma, H. (2016) · Neuroscience · doi:10.1016/j.neuroscience.2016.04.019 · Cited by 52
Zhu, S., Ying, Y., Ye, J., Chen, M., Wu, Q., Dou, H., Ni, W., Xu, H., & Xu, J. (2021) · Cell Death and Disease · doi:10.1038/s41419-021-03546-6 · Cited by 50
Skovira, J. W., Wu, J., Matyas, J. J., Kumar, A., Hanscom, M., Kabadi, S. V., Fang, R. S., & Faden, A. I. (2016) · Journal of Neuroinflammation · doi:10.1186/s12974-016-0769-2 · Cited by 49
Self-citationLithium promotes recovery of neurological function after spinal cord injury by inducing autophagy
Zhang, D., Wang, F., Zhai, X., Li, X.-H., & He, X.-J. (2018) · Neural Regeneration Research · doi:10.4103/1673-5374.241473 · Cited by 49
Anti-Apoptotic Mechanisms of Acupuncture in Neurological Diseases: A Review
Cai, W., & Shen, W.-D. (2018) · The American Journal of Chinese Medicine · doi:10.1142/s0192415x1850026x · Cited by 47
Luo, Y., Xu, T., Liu, W., Rong, Y., Wang, J., Fan, J., Yin, G., & Cai, W. (2020) · International Journal of Neuroscience · doi:10.1080/00207454.2020.1734598 · Cited by 48
Xu, Y. M., Geng, Y., Wang, H., Zhang, H., Qi, J., Li, F., Hu, X., Chen, Y., Si, H., Li, Y., et al. (2023) · Redox Biology · doi:10.1016/j.redox.2023.102767 · Cited by 50
Different Ways to Die: Cell Death Pathways and Their Association With Spinal Cord Injury
Guha, L., Singh, N., & Kumar, H. (2023) · Neurospine · doi:10.14245/ns.2244976.488 · Cited by 48
Bonet‐Ponce, L., Sáez-Atiénzar, S., da Casa, C., Sancho-Pellúz, J., Barcia, J. M., Martínez‐Gil, N., Nava, E., Jordán, J., Romero, F. J., & Galindo, M. F. (2015) · Molecular Neurobiology · doi:10.1007/s12035-015-9509-3 · Cited by 45
Advances in stem cell therapy for amyotrophic lateral sclerosis
Mazzini, L., Ferrari, D., Anđjus, P. R., Bużańska, L., Cantello, R. M., Marchi, F. D., Gelati, M., Giniatullin, R. A., Glover, J. C., Grilli, M., et al. (2018) · Expert Opinion on Biological Therapy · doi:10.1080/14712598.2018.1503248 · Cited by 47
Zheng, B., Zhou, Y., Zhang, H., Yang, G., Hong, Z., Han, D., Wang, Q., He, Z., Liu, Y., Wu, F., et al. (2017) · International Journal of Biological Sciences · doi:10.7150/ijbs.21107 · Cited by 45
Autophagy and Apoptosis in Acute Brain Injuries: From Mechanism to Treatment
He, C., Xu, Y., Sun, J., Li, L., Zhang, J. H., & Wang, Y. (2022) · Antioxidants and Redox Signaling · doi:10.1089/ars.2021.0094 · Cited by 45
Yao, H., Cai, C., Huang, W., Zhong, C., Zhao, T., Di, J., Tang, J., Wu, D., Pang, M., He, L., et al. (2024) · International Journal of Biological Sciences · doi:10.7150/ijbs.98051 · Cited by 42
Li, Y., Xiang, J., Zhang, J., Lin, J., Wu, Y., & Wang, X. (2020) · Frontiers in Cellular Neuroscience · doi:10.3389/fncel.2020.555591 · Cited by 40
Xu, Y. M., Hu, X., Li, F., Zhang, H., Lou, J., Wang, X., Wang, H., Yin, L., Ni, W., Kong, J., et al. (2021) · Oxidative Medicine and Cellular Longevity · doi:10.1155/2021/8186877 · Cited by 40
Wang, P., Jiang, L., Zhou, N., Zhou, H., Liu, H., Zhao, W., Zhang, H., Zhang, X., & Hu, Z. (2018) · Oncotarget · doi:10.18632/oncotarget.23877 · Cited by 41
Wu, F., Wei, X., Wu, Y., Kong, X., Hu, A., Tong, S., Liu, Y., Gong, F., Xie, L., Zhang, J., et al. (2018) · Journal of Neurotrauma · doi:10.1089/neu.2017.5414 · Cited by 40
Regulation of the JAK/STAT signaling pathway in spinal cord injury: an updated review
Guo, X., Jiang, C. Q., Chen, Z., Wang, X., Hong, F., & Hao, D. (2023) · Frontiers in Immunology · doi:10.3389/fimmu.2023.1276445 · Cited by 38
Bai, L., Mei, X., Wang, Y., Yuan, Y., Bi, Y., Li, G., Wang, H., Yan, P., & Lv, G. (2017) · Frontiers in Cellular Neuroscience · doi:10.3389/fncel.2017.00350 · Cited by 38
Cell Specific Changes of Autophagy in a Mouse Model of Contusive Spinal Cord Injury
Muñoz‐Galdeano, T., Reigada, D., del Águila, Á., Velez, I., Caballero-López, M. J., Maza, R. M., & Nieto‐Díaz, M. (2018) · Frontiers in Cellular Neuroscience · doi:10.3389/fncel.2018.00164 · Cited by 37
Jin, J., Zhao, L., Zou, W., Shen, W., Zhang, H., & He, Q. (2018) · Cellular Physiology and Biochemistry · doi:10.1159/000491904 · Cited by 36
Chauhan, A. K., & Mallick, B. N. (2019) · Sleep Medicine · doi:10.1016/j.sleep.2019.04.019 · Cited by 36
Gao, S., Xu, T., Guo, H., Deng, Q., Xun, C., Liang, W., & Sheng, W. (2019) · Life Sciences · doi:10.1016/j.lfs.2019.116978 · Cited by 38
Li, Y., Zhang, J., Zhou, K., Xie, L., Xiang, G., Fang, M., Han, W., Wang, X., & Xiao, J. (2020) · Cell Biology and Toxicology · doi:10.1007/s10565-020-09550-4 · Cited by 36
Zhang, D., Yuan, Y., Zhu, J., Zhu, D., Li, C., Cui, W., Wang, L., Ma, S., Duan, S., & Liu, B. (2021) · Experimental and Therapeutic Medicine · doi:10.3892/etm.2021.10700 · Cited by 35
Yan, P., Bai, L., Lü, W., Gao, Y., Bi, Y., & Lv, G. (2017) · PubMed Central · doi:10.22038/ijbms.2017.9272 · Cited by 34
Multifaceted effects of astragaloside IV on promotion of random pattern skin flap survival in rats.
Lin, R., Chen, H. A., Callow, D. D., Li, S., Wang, L., Li, S., Chen, L., Ding, J., Gao, W., Xu, H., et al. (2017) · Europe PMC (PubMed Central) · Cited by 34
miR-Let7A Modulates Autophagy Induction in LPS-Activated Microglia
Song, J., Oh, Y., & Lee, J. E. (2015) · Experimental Neurobiology · doi:10.5607/en.2015.24.2.117 · Cited by 34
Lithium Chloride Facilitates Autophagy Following Spinal Cord Injury via ERK-dependent Pathway
Liu, P., Zhang, Z., Wang, Q., Guo, R., & Mei, W. (2017) · Neurotoxicity Research · doi:10.1007/s12640-017-9758-1 · Cited by 35
Zheng, Q., Wang, D., Lin, R., & Xu, W. (2024) · Neural Regeneration Research · doi:10.4103/nrr.nrr-d-24-00112 · Cited by 34
Zhu, S., Chen, M., Chen, M., Ye, J., Ying, Y., Wu, Q., Dou, H., Bai, L., Mao, F.-M., Ni, W., et al. (2020) · Frontiers in Pharmacology · doi:10.3389/fphar.2020.00018 · Cited by 32
Zhang, M., Tao, W., Yuan, Z., & Liu, Y. (2017) · Journal of Neurochemistry · doi:10.1111/jnc.14154 · Cited by 26
Xu, K., Li, X., Zhang, H., Ye, L., An, N., Huang, P., Li, D.-H., Zheng, Z., Ji, H., Li, H., et al. (2020) · Neural Regeneration Research · doi:10.4103/1673-5374.295347 · Cited by 31
Sefiani, A., & Geoffroy, C. G. (2021) · Frontiers in Neuroscience · doi:10.3389/fnins.2021.682259 · Cited by 31
Wang, C., Shi, D., Song, X., Chen, Y., Wang, L., & Zhang, X. (2016) · Neurochemistry International · doi:10.1016/j.neuint.2016.04.015 · Cited by 30
Giraldo, E., Nebot, V. J., Đorđević, S., Requejo-Aguilar, R., Alastrue‐Agudo, A., Zagorodko, O., Armiñán, A., Martínez-Rojas, B., Vicent, M. J., & Moreno‐Manzano, V. (2021) · Biomaterials · doi:10.1016/j.biomaterials.2021.121052 · Cited by 30
Impaired Autophagy in Motor Neurons: A Final Common Mechanism of Injury and Death
Porras, M. A. G., Sieck, G. C., & Mantilla, C. B. (2018) · Physiology · doi:10.1152/physiol.00008.2018 · Cited by 31
Beneficial Effects of Resveratrol-Mediated Inhibition of the mTOR Pathway in Spinal Cord Injury
Zhou, J., Huo, X., Botchway, B. O. A., Xu, L. K., Meng, X., Zhang, S., & Liu, X. (2018) · Neural Plasticity · doi:10.1155/2018/7513748 · Cited by 30
Xiaohong, W., Jun, Z., Hongmei, G., & Fan, Q. (2019) · Biomedicine & Pharmacotherapy · doi:10.1016/j.biopha.2019.109155 · Cited by 29
Emerging molecular therapeutic targets for spinal cord injury
Wang, S., Smith, G. M., Selzer, M. E., & Li, S. (2019) · Expert Opinion on Therapeutic Targets · doi:10.1080/14728222.2019.1661381 · Cited by 31
Sabirzhanov, B. E., Matyas, J. J., Coll-Miró, M., Yu, L. L., Faden, A. I., Stoica, B. A., & Wu, J. (2019) · Cell Death and Disease · doi:10.1038/s41419-019-2079-y · Cited by 28
Self-citationLiu, D., Liu, N.-Y., Chen, L.-T., Shao, Y., Shi, X., & Zhu, D. (2020) · Toxicology in Vitro · doi:10.1016/j.tiv.2020.104988 · Cited by 29
Autophagy & Phagocytosis in Neurological Disorders and their Possible Cross-talk
Li, G., Sherchan, P., Tang, Z., & Tang, J. (2021) · Current Neuropharmacology · doi:10.2174/1570159x19666210407150632 · Cited by 29
Crosstalk Between Cell Death and Spinal Cord Injury: Neurology and Therapy
Song, Q., Cui, Q., Sun, S., Wang, Y., Yin, Y., & Zhang, L. (2024) · Molecular Neurobiology · doi:10.1007/s12035-024-04188-3 · Cited by 30
Advances in molecular therapies for targeting pathophysiology in spinal cord injury
Kim, H. N., McCrea, M. R., & Li, S. (2023) · Expert Opinion on Therapeutic Targets · doi:10.1080/14728222.2023.2194532 · Cited by 30
Wang, J., Li, H., Ren, Y., Yao, Y., Hu, J., Zheng, M., Ding, Y., Chen, Y., Shen, Y., Wang, L., et al. (2018) · Cellular Physiology and Biochemistry · doi:10.1159/000492996 · Cited by 27
Wang, H., Liu, Y., Guo, Z., Cui, M., Pang, P., Yang, J., & Wu, C. (2023) · Acta Pharmaceutica Sinica B · doi:10.1016/j.apsb.2023.03.014 · Cited by 28
Injury to the nervous system: A look into the ER
Valenzuela, V., Oñate, M., Hetz, C. A., & Court, F. A. (2016) · Brain Research · doi:10.1016/j.brainres.2016.04.053 · Cited by 26
Gholaminejhad, M., Jameie, S. B., Abdi, M., Abolhassani, F., Mohammed, I., & Hassanzadeh, G. (2022) · Journal of Molecular Neuroscience · doi:10.1007/s12031-022-01977-0 · Cited by 27
Metadata
- Authors
- Liu, S., Sarkar, C., Dinizo, M., Faden, A. I., Koh, E. Y., Lipinski, M. M., & Wu, J.
- Affiliations
- University of Maryland, Baltimore (US)
- Corresponding author
- Lipinski, M M
- Venue
- Cell Death & Disease
- Published
- 2015-01-08
- Volume
- 6
- Issue
- 1
- Pages
- e1582-e1582
- ISSN
- 2041-4889 (ISSN-L)
- PMC
- PMC4669738
- OpenAlex
- W2095421072
- Cited by
- 209
- References
- 48
- Citations by year
- 2026: 9 · 2025: 14 · 2024: 15 · 2023: 18 · 2022: 23 · 2021: 22 · 2020: 21 · 2019: 22 · 2018: 17 · 2017: 18 · 2016: 22 · 2015: 8
- FWCI
- 16.92
- Type
- journal article
- Language
- en
- Open access
- gold
- doi.org
- Locations
- Cell Death and Disease (publishedVersion, cc-by)
- PubMed Central (publishedVersion, cc-by)
- PubMed (publishedVersion)
- Funders
- National Institutes of Health
- National Institute of Nursing Research (R01NR013601)
- National Institute of Neurological Disorders and Stroke (R01NS091218, R01NS054221)
- Topics
- Life Sciences › Biochemistry, Genetics and Molecular Biology › Cell Biology › Autophagy in Disease and Therapy
- Health Sciences › Medicine › Clinical Neurology › Spinal Cord Injury Research
- Life Sciences › Biochemistry, Genetics and Molecular Biology › Cell Biology › Endoplasmic Reticulum Stress and Disease
- Keywords
- spinal cord injury, autophagy, endoplasmic reticulum stress, neuronal apoptosis, lysosomal dysfunction, cathepsin D, p62, autophagosomes, motor neurons, oligodendrocytes, microglia, caspase-12, caspase-3, contusive injury
- MeSH terms
- Animals, Autophagy, Lysosomes, Male, Neurons, Oligodendroglia, Phagosomes, Spinal Cord Injuries, Rats, Sprague-Dawley, Apoptosis, Microglia, Endoplasmic Reticulum Stress, White Matter, Gray Matter
About these checks
Registry, retraction, Cites and statistics results are computed, not judged, with one exception: a printed reference that no index lists is read once by a model before it counts as a citation error. Claims are extracted by a model and kept only when their quote appears verbatim in the text; each cited source is then checked, with a model’s help, for whether it says what the claim relies on. Those verdicts can be wrong — read the claim’s quote and the cited source before relying on one.
Statistics and arithmetic are recomputed, not judged.
Confidence bands are shown only for fields calibrated on our annotated test set. None is calibrated yet, so no band is shown.
What counts as a claim ›How we measure confidence ›How we check this ›
Are you an author, or do you see a problem with this page? Request a review
