

The DOI matches its Crossref record; 46 of the 46 references it cites were found in a registry or an index.
Intragenic DNA methylation modulates alternative splicing by recruiting MeCP2 to promote exon recognition
Open accessAbstract
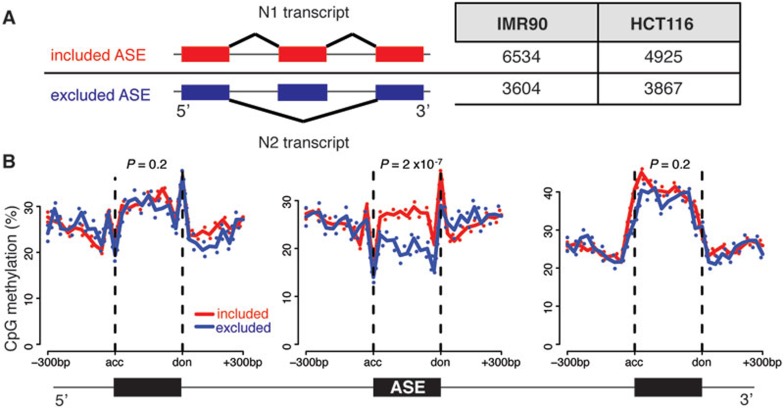
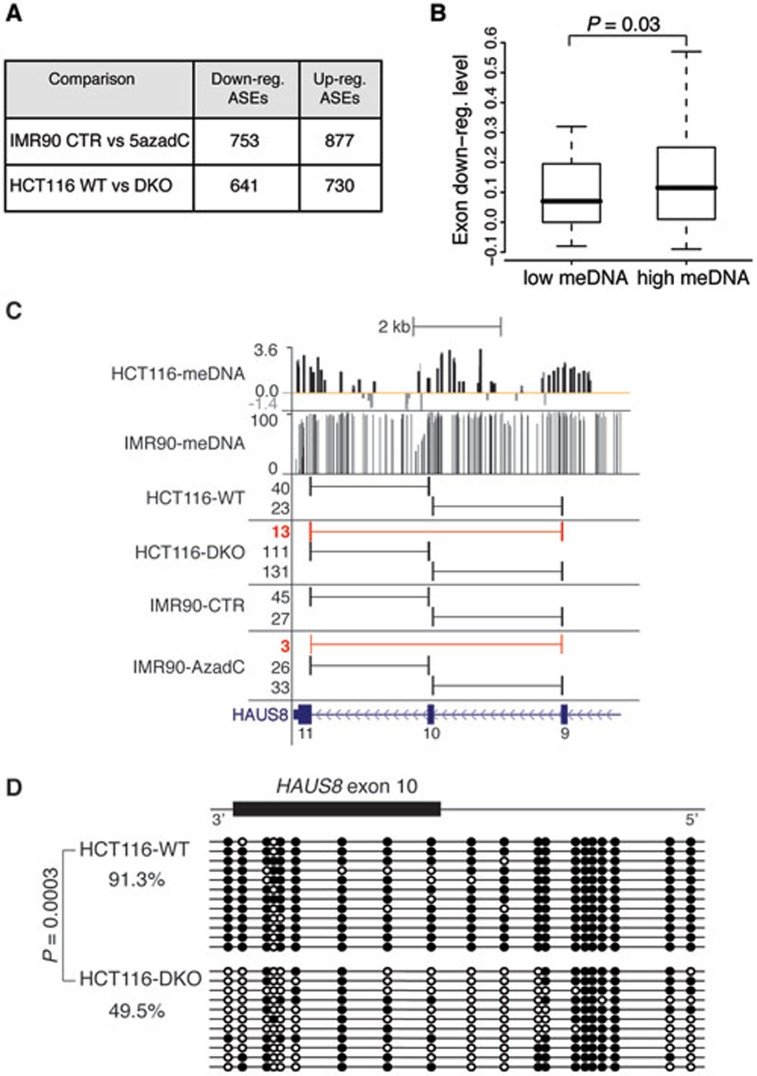
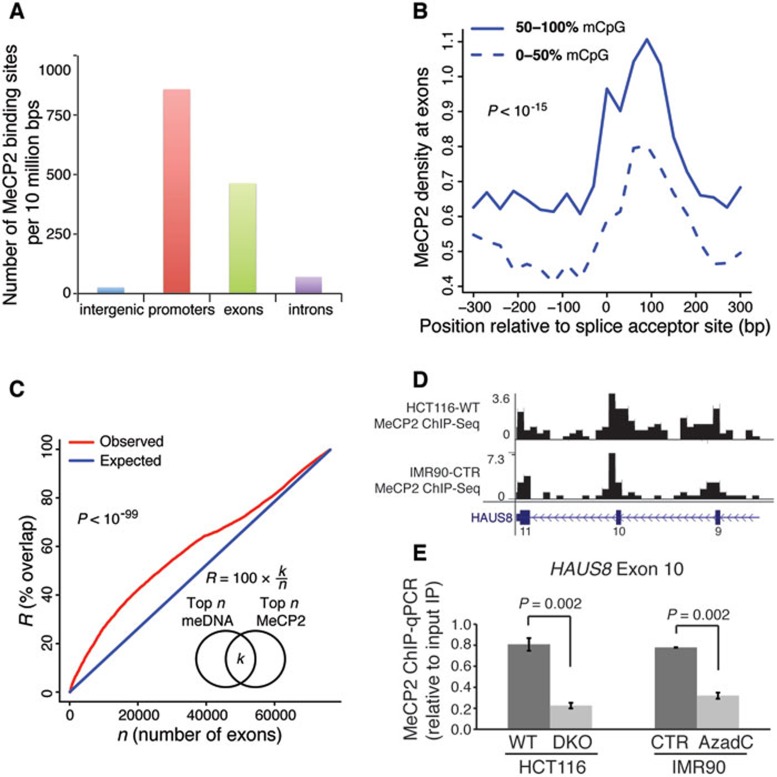
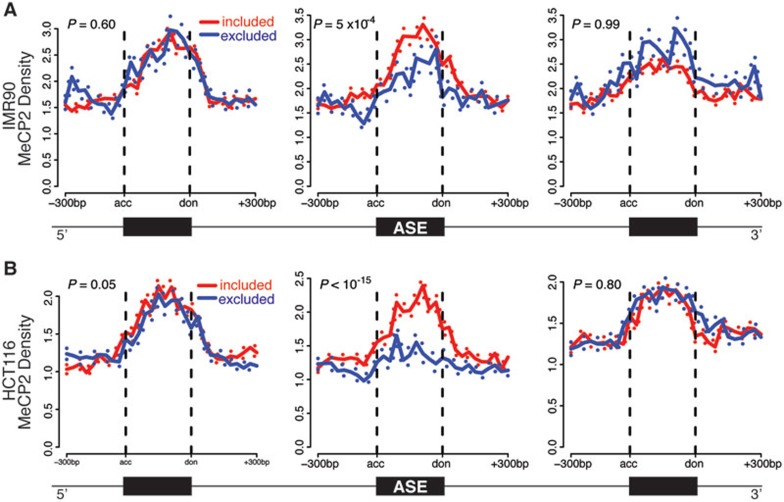
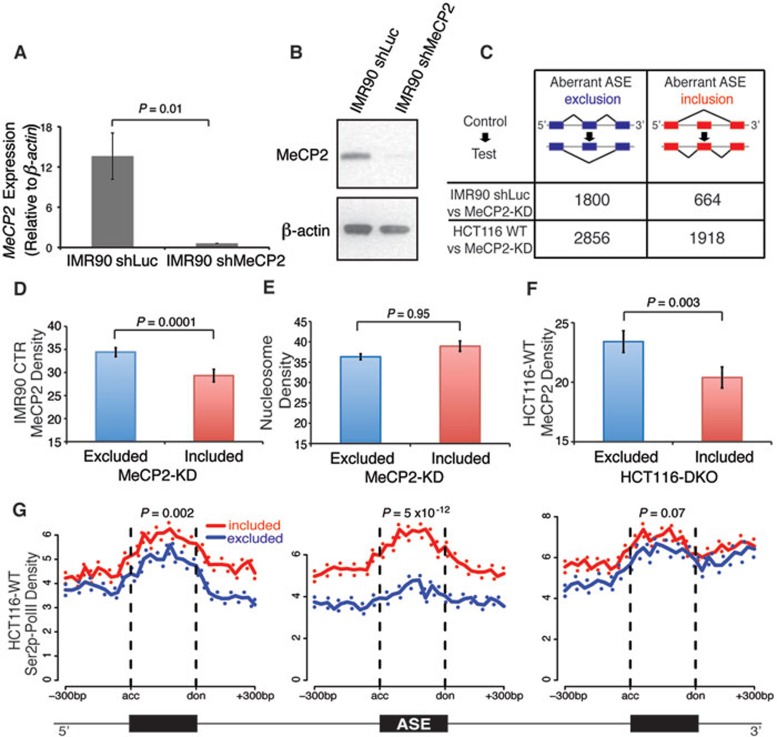
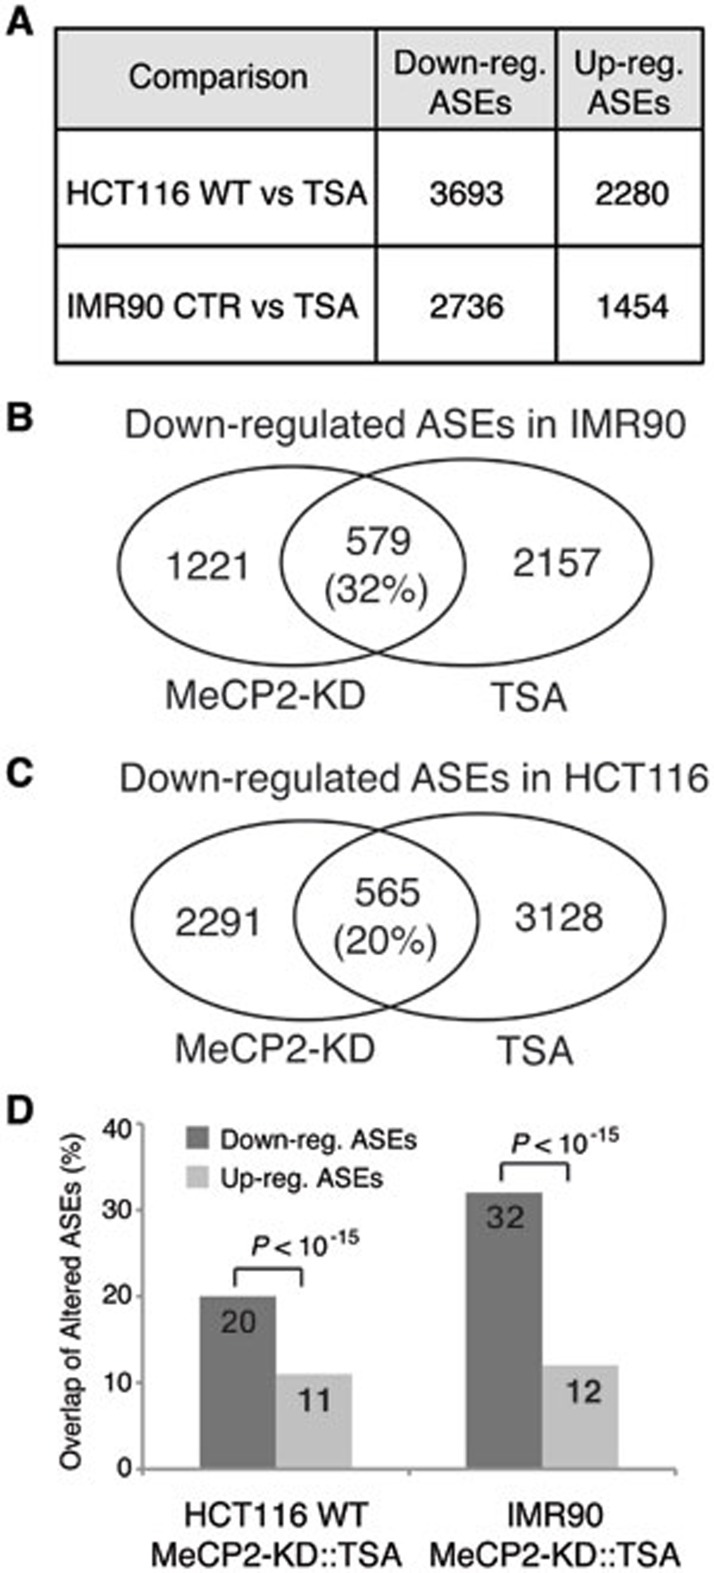
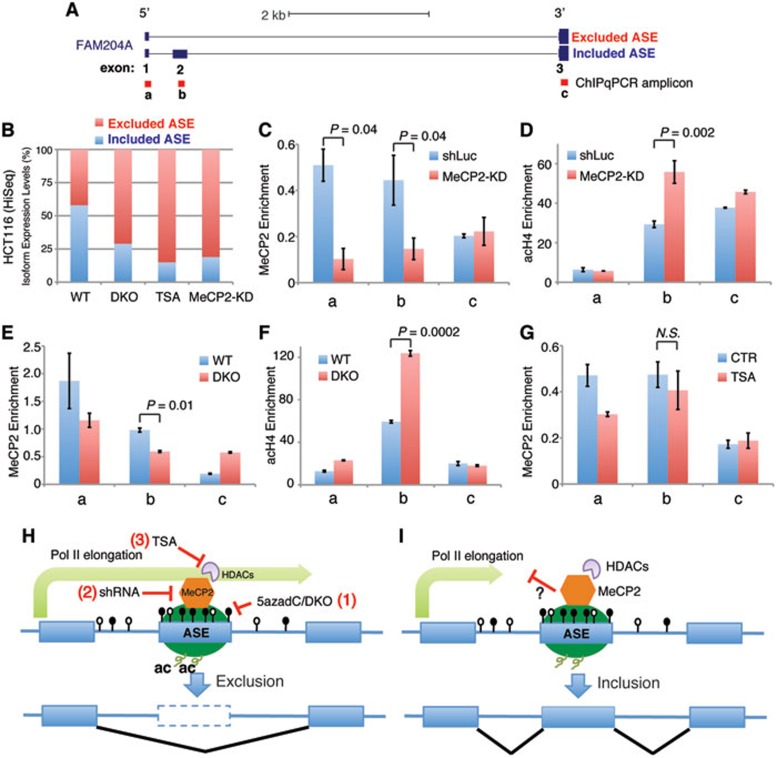
Although the function of DNA methylation in gene promoter regions is well established in transcriptional repression, the function of the evolutionarily conserved widespread distribution of DNA methylation in gene body regions remains incompletely understood. Here, we show that DNA methylation is enriched in included alternatively spliced exons (ASEs), and that inhibition of DNA methylation results in aberrant splicing of ASEs. The methyl-CpG-binding protein MeCP2 is enriched in included ASEs, particularly those that are also highly methylated, and inhibition of DNA methylation disrupts specific targeting of MeCP2 to exons. Interestingly, ablation of MeCP2 results in increased histone acetylation and aberrant ASE-skipping events. We further show that inhibition of histone deacetylase (HDAC) activity leads to exon skipping that shows a highly significant degree of overlap with that caused by MeCP2 knockdown. Together, our data indicate that intragenic DNA methylation operates in exon definition to modulate alternative RNA splicing and can enhance exon recognition via recruitment of the multifunctional protein MeCP2, which thereby maintains local histone hypoacetylation through the subsequent recruitment of HDACs.
Overview
The claims and statistics of this paper haven’t been checked yet.
Run the check — free, no account needed. It reads the open-access text and checks the sources it cites.
Integrity signals
Registry
Cites
Statistics
Figures
Verification
Claims the paper makes
The claims and statistics of this paper haven’t been checked yet.
Run the check — free, no account needed. It reads the open-access text and checks the sources it cites.
Claims other papers make about this one
Each is checked against this paper’s own text: does it say what the citing paper says it does?
In the citing paper
“Nevertheless, hypomethylation of these elements is observed in cancer cells 26,27 and this can lead to activation and transposition of the endogenous retroviral sequences thereby promoting genetic instability and tumour development 1 (Figure 2).”
From The roles of DNA, RNA and histone methylation in ageing and cancer (2019) · cites this paper as [27]
In the citing paper
“Similarly, the mCpG-binding protein MeCP2 was found to play a part in regulating exon splicing113.”
From Transcription factors as readers and effectors of DNA methylation (2016) · cites this paper as [113]
In the citing paper
“In this case, a high methylation level led to MeCP2 binding to alternatively spliced exons, which resulted in exon inclusion (FIG. 4).”
From Transcription factors as readers and effectors of DNA methylation (2016) · cites this paper as [113]
Self-check
Percentages, sums and reported differences re-computed from the paper’s own numbers.
The self-check needs the paper’s full text.
Citations
Cites
Model-based Analysis of ChIP-Seq (MACS)
Zhang, Y., Liu, T., Meyer, C. A., Eeckhoute, J., Johnson, D. S., Bernstein, B. E., Nusbaum, C., Myers, R. M., Brown, M., Li, W., et al. (2008) · Genome Biology · doi:10.1186/gb-2008-9-9-r137 · Cited by 18,386
TopHat: discovering splice junctions with RNA-Seq
Trapnell, C., Pachter, L. S., & Salzberg, S. L. (2009) · Bioinformatics · doi:10.1093/bioinformatics/btp120 · Cited by 11,682
High-Resolution Profiling of Histone Methylations in the Human Genome
Barski, A., Cuddapah, S., Cui, K., Roh, T.-Y., Schones, D. E., Wang, Z., Wei, G., Chepelev, I., & Zhao, K. (2007) · Cell · doi:10.1016/j.cell.2007.05.009 · Cited by 6,845
Self-citationRett syndrome is caused by mutations in X-linked MECP2, encoding methyl-CpG-binding protein 2
Amir, R. E., Van den Veyver, I. B., Wan, M., Tran, C. Q., Francke, U., & Zoghbi, H. Y. (1999) · Nature Genetics · doi:10.1038/13810 · Cited by 4,990
Human DNA methylomes at base resolution show widespread epigenomic differences
Lister, R., Pelizzola, M., Dowen, R. H., Hawkins, R. D., Hon, G., Tonti-Filippini, J., Nery, J. R., Lee, L., Ye, Z., Ngo, Q.-M., et al. (2009) · Nature · doi:10.1038/nature08514 · Cited by 4,673
Nan, X., Ng, H.-H., Johnson, C. A., Laherty, C. D., Turner, B. M., Eisenman, R. N., & Bird, A. (1998) · Nature · doi:10.1038/30764 · Cited by 3,440
Genomic DNA methylation: the mark and its mediators.
Klose, R. J., & Bird, A. P. (2006) · Trends in Biochemical Sciences · doi:10.1016/j.tibs.2005.12.008 · Cited by 2,501
The Role of DNA Methylation in Mammalian Epigenetics
Jones, P. A., & Takai, D. (2001) · Science · doi:10.1126/science.1063852 · Cited by 2,125
Nascent RNA Sequencing Reveals Widespread Pausing and Divergent Initiation at Human Promoters
Core, L. J., Waterfall, J. J., & Lis, J. T. (2008) · Science · doi:10.1126/science.1162228 · Cited by 1,986
Conserved role of intragenic DNA methylation in regulating alternative promoters
Maunakea, A. K., Nagarajan, R. P., Bilenky, M., Ballinger, T. J., D’Souza, C., Fouse, S. D., Johnson, B. E., Hong, C., Nielsen, C., Zhao, Y., et al. (2010) · Nature · doi:10.1038/nature09165 · Cited by 1,743
Self-citationConservation and divergence of methylation patterning in plants and animals
Feng, S., Cokus, S. J., Zhang, X., Chen, P.-Y., Bostick, M., Goll, M. G., Hetzel, J., Jain, J., Strauss, S. H., Halpern, M. E., et al. (2010) · Proceedings of the National Academy of Sciences · doi:10.1073/pnas.1002720107 · Cited by 1,285
DNMT1 and DNMT3b cooperate to silence genes in human cancer cells
Rhee, I., Bachman, K. E., Park, B. H., Jair, K.-W., Yen, R.-W. C., Schuebel, K. E., Cui, H., Feinberg, A. P., Lengauer, C., Kinzler, K. W., et al. (2002) · Nature · doi:10.1038/416552a · Cited by 1,039
CTCF-promoted RNA polymerase II pausing links DNA methylation to splicing
Shukla, S., Kavak, E., Gregory, M., Imashimizu, M., Shutinoski, B., Kashlev, M., Oberdoerffer, P., Sandberg, R., & Oberdoerffer, S. (2011) · Nature · doi:10.1038/nature10442 · Cited by 973
Design and analysis of ChIP-seq experiments for DNA-binding proteins
Kharchenko, P. V., Tolstorukov, M. Y., & Park, P. J. (2008) · Nature Biotechnology · doi:10.1038/nbt.1508 · Cited by 914
Epigenetics in Alternative Pre-mRNA Splicing
Luco, R. F., Alló, M., Schor, I. E., Kornblihtt, A. R., & Misteli, T. (2011) · Cell · doi:10.1016/j.cell.2010.11.056 · Cited by 827
Relationship between nucleosome positioning and DNA methylation
Chodavarapu, R. K., Feng, S., Bernatavichute, Y. V., Chen, P., Stroud, H., Yu, Y., Hetzel, J., Kuo, F., Kim, J., Cokus, S. J., et al. (2010) · Nature · doi:10.1038/nature09147 · Cited by 696
A Slow RNA Polymerase II Affects Alternative Splicing In Vivo
de la Mata, M., Alonso, C. R., Kadener, S., Fededa, J. P., Blaustein, M., Pelisch, F., Cramer, P., Bentley, D., & Kornblihtt, A. R. (2003) · Molecular Cell · doi:10.1016/j.molcel.2003.08.001 · Cited by 683
A Novel CpG Island Set Identifies Tissue-Specific Methylation at Developmental Gene Loci
Illingworth, R. S., Kerr, A. R. W., DeSousa, D., Jørgensen, H. F., Ellis, P., Stalker, J., Jackson, D. K., Clee, C. M., Plumb, R. W., Rogers, J., et al. (2008) · PLoS Biology · doi:10.1371/journal.pbio.0060022 · Cited by 663
Dissection of the methyl-CpG binding domain from the chromosomal protein MeCP2
Nan, X., Meehan, R. R., & Bird, A. P. (1993) · Nucleic Acids Research · doi:10.1093/nar/21.21.4886 · Cited by 625
Alternative splicing and disease
Tazi, J., Bakkour, N., & Stamm, S. (2008) · Biochimica et Biophysica Acta (BBA) - Molecular Basis of Disease · doi:10.1016/j.bbadis.2008.09.017 · Cited by 569
Young, J. I., Hong, E. P., Castle, J. C., Crespo-Barreto, J., Bowman, A. B., Rose, M. F., Kang, D., Richman, R., Johnson, J. M., Berget, S., et al. (2005) · Proceedings of the National Academy of Sciences · doi:10.1073/pnas.0507856102 · Cited by 484
Nucleosome positioning as a determinant of exon recognition
Tilgner, H., Nikolaou, C., Althammer, S., Sammeth, M., Beato, M., Valcárcel, J., & Guigó, R. (2009) · Nature Structural & Molecular Biology · doi:10.1038/nsmb.1658 · Cited by 479
Intragenic DNA methylation alters chromatin structure and elongation efficiency in mammalian cells
Lorincz, M. C., Dickerson, D. R., Schmitt, M., & Groudine, M. T. (2004) · Nature Structural & Molecular Biology · doi:10.1038/nsmb840 · Cited by 472
Genome-wide mapping of nucleosome positioning and DNA methylation within individual DNA molecules
Kelly, T. K., Liu, Y., Lay, F. D., Liang, G., Berman, B. P., & Jones, P. A. (2012) · Genome Research · doi:10.1101/gr.143008.112 · Cited by 455
DNA Methylation and Demethylation in Mammals
Chen, Z., & Riggs, A. D. (2011) · Journal of Biological Chemistry · doi:10.1074/jbc.r110.205286 · Cited by 416
Yasui, D. H., Peddada, S., Bieda, M. C., Vallero, R. O., Hogart, A., Nagarajan, R. P., Thatcher, K. N., Farnham, P., & LaSalle, J. M. (2007) · Proceedings of the National Academy of Sciences · doi:10.1073/pnas.0707442104 · Cited by 388
Nagarajan, R., Hogart, A., Gwye, Y., Martin, M. R., & LaSalle, J. M. (2006) · Epigenetics · doi:10.4161/epi.1.4.3514 · Cited by 347
MeCP2 dysfunction in Rett syndrome and related disorders
Moretti, P. M., & Zoghbi, H. Y. (2006) · Current Opinion in Genetics & Development · doi:10.1016/j.gde.2006.04.009 · Cited by 300
Cell type–specific DNA methylation at intragenic CpG islands in the immune systemPreprint
Deaton, A. M., Webb, S., Kerr, A. R. W., Illingworth, R. S., Guy, J., Andrews, R., & Bird, A. P. (2011) · Genome Research · doi:10.1101/gr.118703.110 · Cited by 293
Schor, I. E., Rascovan, N., Pelisch, F., Alló, M., & Kornblihtt, A. R. (2009) · Proceedings of the National Academy of Sciences · doi:10.1073/pnas.0810666106 · Cited by 270
Global impact of RNA polymerase II elongation inhibition on alternative splicing regulationPreprint
Ip, J. Y. Y., Schmidt, D., Pan, Q., Ramani, A. K., Fraser, A. G., Odom, D. T., & Blencowe, B. J. (2010) · Genome Research · doi:10.1101/gr.111070.110 · Cited by 253
Lei, W., Luo, Y., Lei, W., Luo, Y., Yan, K., Zhao, S., Li, Y., Qiu, X., Zhou, Y., Long, H., et al. (2009) · Scandinavian Journal of Rheumatology · doi:10.1080/03009740902758875 · Cited by 248
Wozniak, R. J., Klimecki, W. T., Lau, S. S., Feinstein, Y., & Futscher, B. W. (2006) · Oncogene · doi:10.1038/sj.onc.1209763 · Cited by 213
Regulation of alternative polyadenylation by genomic imprintingPreprint
Wood, A. J., Schulz, R., Woodfine, K., Koltowska, K., BEECHEY, C. V., Peters, J., Bourc’his, D., & Oakey, R. J. (2008) · Genes & Development · doi:10.1101/gad.473408 · Cited by 163
Relationship between Gene Body DNA Methylation and Intragenic H3K9me3 and H3K36me3 Chromatin Marks
Hahn, M. A., Wu, X., Li, A. X., Hahn, T., & Pfeifer, G. P. (2011) · PLoS ONE · doi:10.1371/journal.pone.0018844 · Cited by 161
Liang, P., Song, F., Ghosh, S., Morien, E., Qin, M., Mahmood, S., Fujiwara, K., Igarashi, J., Nagase, H., & Held, W. A. (2011) · BMC Genomics · doi:10.1186/1471-2164-12-231 · Cited by 140
Zhou, H.-L., Hinman, M. N., Barron, V. A., Geng, C., Zhou, G., Luo, G., Siegel, R. E., & Lou, H. (2011) · Proceedings of the National Academy of Sciences · doi:10.1073/pnas.1103344108 · Cited by 136
Contrasting chromatin organization of CpG islands and exons in the human genome
Choi, J. K. (2010) · Genome biology · doi:10.1186/gb-2010-11-7-r70 · Cited by 130
MECP2 promoter methylation and X chromosome inactivation in autism
Nagarajan, R. P., Patzel, K. A., Martin, M. R., Yasui, D. H., Swanberg, S. E., Hertz‐Picciotto, I., Hansen, R. L., de Water, J. V., Pessah, I. N., Jiang, R., et al. (2008) · Autism Research · doi:10.1002/aur.24 · Cited by 109
Mossman, D., Kim, K.-T., & Scott, R. J. (2010) · BMC Cancer · doi:10.1186/1471-2407-10-366 · Cited by 105
Webb, R. D., Wren, J. D., Jeffries, M. A., Kelly, J. A., Kaufman, K. M., Tang, Y., Frank, M. B., Merrill, J. T., Kimberly, R. P., Edberg, J. C., et al. (2009) · Arthritis & Rheumatism · doi:10.1002/art.24360 · Cited by 86
MECP2 truncating mutations cause histone H4 hyperacetylation in Rett syndrome
Wan, M. (2001) · Human Molecular Genetics · doi:10.1093/hmg/10.10.1085 · Cited by 82
Anastasiadou, C., Malousi, A., Maglaveras, N., & Kouidou, S. (2011) · DNA and Cell Biology · doi:10.1089/dna.2010.1094 · Cited by 70
A brain-derived MeCP2 complex supports a role for MeCP2 in RNA processing
Long, S. W., Ooi, J. Y. Y., Yau, P. M., & Jones, P. L. (2010) · Bioscience Reports · doi:10.1042/bsr20100124 · Cited by 62
Chromatin and Alternative SplicingPreprint
Alló, M., Schor, I. E., Muñoz, M. J., de la Mata, M., Agirre, E., Valcárcel, J., Eyras, E., & Kornblihtt, A. R. (2010) · Cold Spring Harbor Symposia on Quantitative Biology · doi:10.1101/sqb.2010.75.023 · Cited by 48
Rett Syndrome: A Rosetta Stone for Understanding the Molecular Pathogenesis of Autism
LaSalle, J. M., Hogart, A., & Thatcher, K. N. (2005) · International review of neurobiology · doi:10.1016/s0074-7742(05)71006-0 · Cited by 21
Cited by
Sorted by citations
The diverse roles of DNA methylation in mammalian development and disease
Greenberg, M., & Bourc’his, D. (2019) · Nature Reviews Molecular Cell Biology · doi:10.1038/s41580-019-0159-6 · Cited by 2,272
Function and information content of DNA methylation
Schübeler, D. (2015) · Nature · doi:10.1038/nature14192 · Cited by 2,060
Intragenic DNA methylation prevents spurious transcription initiation
Neri, F., Rapelli, S., Krepelova, A., Incarnato, D., Parlato, C., Basile, G., Maldotti, M., Anselmi, F., & Oliviero, S. (2017) · Nature · doi:10.1038/nature21373 · Cited by 739
Transcription factors as readers and effectors of DNA methylation
Zhu, H., Wang, G., & Qian, J. (2016) · Nature Reviews Genetics · doi:10.1038/nrg.2016.83 · Cited by 649
Systematic identification of genetic influences on methylation across the human life course
Gaunt, T. R., Shihab, H. A., Hemani, G., Min, J. L., Woodward, G., Lyttleton, O., Zheng, J., Duggirala, A., McArdle, W. L., Ho, K., et al. (2016) · Genome Biology · doi:10.1186/s13059-016-0926-z · Cited by 598
Metadata
- Authors
- Maunakea, A. K., Chepelev, I., Cui, K., & Zhao, K.
- Affiliations
- University of Hawaiʻi at Mānoa (US)
- Cincinnati Children's Hospital Medical Center (US)
- National Institutes of Health (US)
- Corresponding author
- Zhao, Keji
- Venue
- Cell Research
- Published
- 2013-08-13
- Volume
- 23
- Issue
- 11
- Pages
- 1256-1269
- ISSN
- 1001-0602 (ISSN-L)
- 1748-7838
- PMC
- PMC3817542
- OpenAlex
- W2074898309
- Cited by
- 552
- References
- 46
- Citations by year
- 2026: 17 · 2025: 19 · 2024: 26 · 2023: 32 · 2022: 32 · 2021: 55 · 2020: 47 · 2019: 57 · 2018: 42 · 2017: 57 · 2016: 59 · 2015: 53 · 2014: 48 · 2013: 6
- FWCI
- 24.77
- Type
- journal article
- Language
- en
- Open access
- hybrid
- doi.org
- Licence
- Locations
- Cell Research (publishedVersion, cc-by-nc-nd)
- Europe PMC (PubMed Central) (publishedVersion, cc-by-nc-nd)
- PubMed Central (publishedVersion, cc-by-nc-nd)
- PubMed (publishedVersion)
- Funders
- Johns Hopkins University (HCT116)
- National Institutes of Health
- University of California, San Francisco
- National Heart, Lung, and Blood Institute
- Topics
- Life Sciences › Biochemistry, Genetics and Molecular Biology › Molecular Biology › RNA Research and Splicing
- Life Sciences › Biochemistry, Genetics and Molecular Biology › Molecular Biology › Epigenetics and DNA Methylation
- Life Sciences › Biochemistry, Genetics and Molecular Biology › Molecular Biology › Genomics and Chromatin Dynamics
- Keywords
- alternative splicing, MeCP2, exon skipping, exon recognition, histone acetylation, histone deacetylase, gene body methylation, methyl-CpG binding proteins, RNA splicing regulation
- MeSH terms
- Cell Line, Exons, Humans, Alternative Splicing, DNA Methylation, HCT116 Cells, Methyl-CpG-Binding Protein 2
About these checks
Registry, retraction, Cites and statistics results are computed, not judged, with one exception: a printed reference that no index lists is read once by a model before it counts as a citation error. Claims are extracted by a model and kept only when their quote appears verbatim in the text; each cited source is then checked, with a model’s help, for whether it says what the claim relies on. Those verdicts can be wrong — read the claim’s quote and the cited source before relying on one.
Statistics and arithmetic are recomputed, not judged.
Confidence bands are shown only for fields calibrated on our annotated test set. None is calibrated yet, so no band is shown.
What counts as a claim ›How we measure confidence ›How we check this ›
Are you an author, or do you see a problem with this page? Request a review
