Cited by 110Bioinformatics and Genomic NetworksFungal and yeast genetics researchEvolution and Genetic Dynamics

The DOI matches its Crossref record; 68 of the 69 references it cites were found in a registry or an index.

Genetic interactions reveal the evolutionary trajectories of duplicate genes

Open access

Abstract

The characterization of functional redundancy and divergence between duplicate genes is an important step in understanding the evolution of genetic systems. Large-scale genetic network analysis in Saccharomyces cerevisiae provides a powerful perspective for addressing these questions through quantitative measurements of genetic interactions between pairs of duplicated genes, and more generally, through the study of genome-wide genetic interaction profiles associated with duplicated genes. We show that duplicate genes exhibit fewer genetic interactions than other genes because they tend to buffer one another functionally, whereas observed interactions are non-overlapping and reflect their divergent roles. We also show that duplicate gene pairs are highly imbalanced in their number of genetic interactions with other genes, a pattern that appears to result from asymmetric evolution, such that one duplicate evolves or degrades faster than the other and often becomes functionally or conditionally specialized. The differences in genetic interactions are predictive of differences in several other evolutionary and physiological properties of duplicate pairs.

Overview

The claims and statistics of this paper haven’t been checked yet.

Run the check — free, no account needed. It reads the open-access text and checks the sources it cites.

A few free checks a day · papers already verified open instantly · results are public

Integrity signals

Registry

Crossref · 10.1038/msb.2010.82

Cites

68 of 68 references verified0 citation errors · 0 not checkable

Statistics

Figures

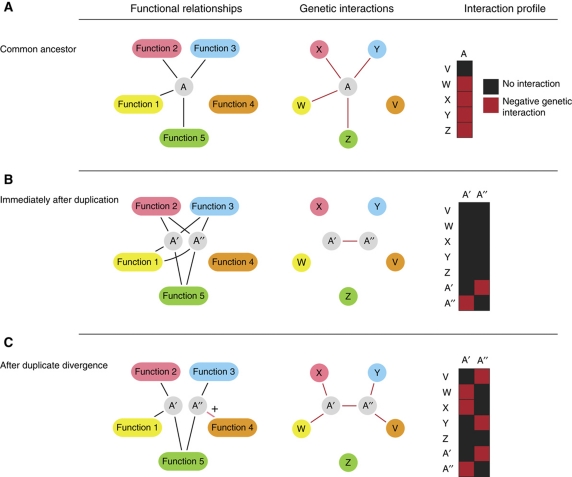
Figure 1 A model for the buffering of genetic interactions by partially redundant genes. The figure illustrates the relationship between a functional membership network, the observable genetic interaction network and the corresponding genetic interaction profiles, over the course of a duplication event and subsequent divergence. (A) Gene A has no redundant partner and its set of functional relationships is revealed through negative genetic interactions. The interaction profile for gene A is complete. (B) Immediately after duplication, genes A′ and A′′ are fully redundant and their functional relationships are shared. Because each is capable of performing their common functions without the other, the deletion of A′ and A′′ have negligible effects and do not exhibit negative interactions with any other genes. However, the simultaneous deletion of A′ and A′′ reveals the original phenotype of their ancestor, and thus shows a negative genetic interaction. (C) A′ and A′′ diverge, the redundancy becomes incomplete and unique deletion consequences emerge for each duplicate. Some of the negative genetic interactions observed for the ancestor gene A are not observed following duplication and divergence; for example, despite the functional relationship between A′ and A′′ and Z, negative interactions are not observed with Z. A′′ has evolved a new relationship with function 4(+). A′ lacks this ability and thus we see a genetic interaction between A′′ and V.
Figure 1 A model for the buffering of genetic interactions by partially redundant genes. The figure illustrates the relationship between a functional membership network, the observable genetic interaction network and the corresponding genetic interaction profiles, over the course of a duplication event and subsequent divergence. (A) Gene A has no redundant partner and its set of functional relationships is revealed through negative genetic interactions. The interaction profile for gene A is complete. (B) Immediately after duplication, genes A′ and A′′ are fully redundant and their functional relationships are shared. Because each is capable of performing their common functions without the other, the deletion of A′ and A′′ have negligible effects and do not exhibit negative interactions with any other genes. However, the simultaneous deletion of A′ and A′′ reveals the original phenotype of their ancestor, and thus shows a negative genetic interaction. (C) A′ and A′′ diverge, the redundancy becomes incomplete and unique deletion consequences emerge for each duplicate. Some of the negative genetic interactions observed for the ancestor gene A are not observed following duplication and divergence; for example, despite the functional relationship between A′ and A′′ and Z, negative interactions are not observed with Z. A′′ has evolved a new relationship with function 4(+). A′ lacks this ability and thus we see a genetic interaction between A′′ and V.CC BY-NC-SA · PubMed Central
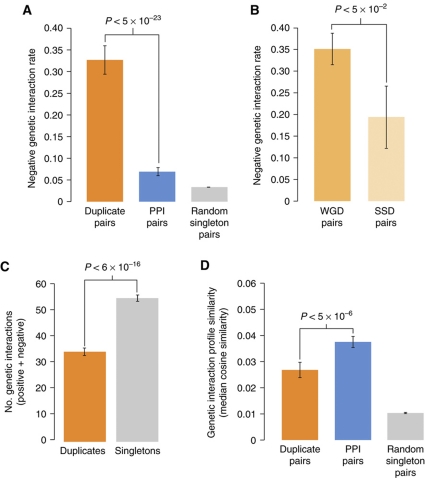
Figure 2 The distribution of genetic interactions supports the duplicate buffering hypothesis. (A) The proportion of negative interactions among screened pairs for duplicate pairs, singleton pairs with a protein–protein interaction (Materials and methods) and random singleton pairs. Error bars represent the error on a binomial proportion (P<5 × 10⁻²³; Binomial proportion test). (B) The proportion of negative interactions among duplicate pairs differs between modes of duplication. Whole-genome duplicates (WGD) exhibit a slightly higher rate of negative interaction than their small-scale duplication (SSD) counterparts (P<5 × 10⁻²; Wilcoxon rank-sum). The rate of negative interactions within SSD pairs is still much higher than related singletons (Figure 2A), indicating that the functional overlap observed within duplicate pairs is not solely driven by WGD pairs. (C) The number of genetic interactions (both positive and negative) is plotted for all non-essential duplicates and singletons. Genes shown represent those found on the SGA deletion array and thus the counts represent the number of query genes with which a given array gene shows an interaction (see Materials and methods). Means are shown and error bars represent one standard deviation of the mean over 1000 bootstrapped samples of the distribution. (P<6 × 10⁻¹⁶; Wilcoxon rank-sum), (D) Although duplicate genes show far greater profile similarity than random pairs, they show significantly less similarity than physically interacting pairs (P<5 × 10⁻⁶; Wilcoxon rank-sum). Median cosine similarity is shown (Materials and methods). Error bars represent the standard deviation of the median over 1000 bootstrapped samples.
Figure 2 The distribution of genetic interactions supports the duplicate buffering hypothesis. (A) The proportion of negative interactions among screened pairs for duplicate pairs, singleton pairs with a protein–protein interaction (Materials and methods) and random singleton pairs. Error bars represent the error on a binomial proportion (P<5 × 10⁻²³; Binomial proportion test). (B) The proportion of negative interactions among duplicate pairs differs between modes of duplication. Whole-genome duplicates (WGD) exhibit a slightly higher rate of negative interaction than their small-scale duplication (SSD) counterparts (P<5 × 10⁻²; Wilcoxon rank-sum). The rate of negative interactions within SSD pairs is still much higher than related singletons (Figure 2A), indicating that the functional overlap observed within duplicate pairs is not solely driven by WGD pairs. (C) The number of genetic interactions (both positive and negative) is plotted for all non-essential duplicates and singletons. Genes shown represent those found on the SGA deletion array and thus the counts represent the number of query genes with which a given array gene shows an interaction (see Materials and methods). Means are shown and error bars represent one standard deviation of the mean over 1000 bootstrapped samples of the distribution. (P<6 × 10⁻¹⁶; Wilcoxon rank-sum), (D) Although duplicate genes show far greater profile similarity than random pairs, they show significantly less similarity than physically interacting pairs (P<5 × 10⁻⁶; Wilcoxon rank-sum). Median cosine similarity is shown (Materials and methods). Error bars represent the standard deviation of the median over 1000 bootstrapped samples.CC BY-NC-SA · PubMed Central
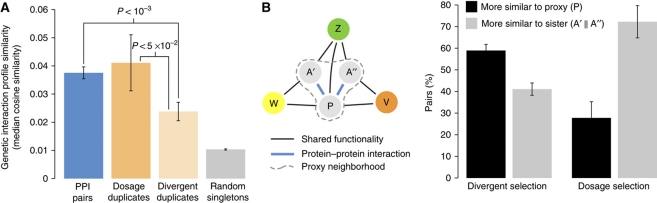
Figure 3 Global and local genetic interaction similarity comparisons support selection distinction. (A) Profile similarity shown as in Figure 2D. Duplicate pairs have been separated into dosage and non-dosage (divergent) classes (Materials and methods). Divergent duplicates show significantly less profile similarity than either dosage duplicates or singletons showing a physical interaction (P<5 × 10⁻²; P<1 × 10⁻³; Wilcoxon rank-sum test). Dosage duplicates are not statistically distinguishable from physically interacting singletons. (B) A hypothetical functional network is shown that contains a duplicate pair (A′/A′′). A proxy gene (P) is identified by finding a protein that shares protein–protein interactions with both duplicates (see Materials and methods), and P is used to approximate the genetic interaction profile of the common ancestor (that is, A). The number of times a duplicate's similarity with its sister exceeded its similarity with P is shown as a percentage, and error bars represent error on a binomial proportion. Dosage and divergent pairs are counted separately. In terms of genetic interaction profiles, divergent pairs more closely resemble their common neighbor than they do each other. In contrast, dosage pairs more closely resemble each other. The probability that these two classes come from the same binomial distribution is small (P<9 × 10⁻⁵).
Figure 3 Global and local genetic interaction similarity comparisons support selection distinction. (A) Profile similarity shown as in Figure 2D. Duplicate pairs have been separated into dosage and non-dosage (divergent) classes (Materials and methods). Divergent duplicates show significantly less profile similarity than either dosage duplicates or singletons showing a physical interaction (P<5 × 10⁻²; P<1 × 10⁻³; Wilcoxon rank-sum test). Dosage duplicates are not statistically distinguishable from physically interacting singletons. (B) A hypothetical functional network is shown that contains a duplicate pair (A′/A′′). A proxy gene (P) is identified by finding a protein that shares protein–protein interactions with both duplicates (see Materials and methods), and P is used to approximate the genetic interaction profile of the common ancestor (that is, A). The number of times a duplicate's similarity with its sister exceeded its similarity with P is shown as a percentage, and error bars represent error on a binomial proportion. Dosage and divergent pairs are counted separately. In terms of genetic interaction profiles, divergent pairs more closely resemble their common neighbor than they do each other. In contrast, dosage pairs more closely resemble each other. The probability that these two classes come from the same binomial distribution is small (P<9 × 10⁻⁵).CC BY-NC-SA · PubMed Central
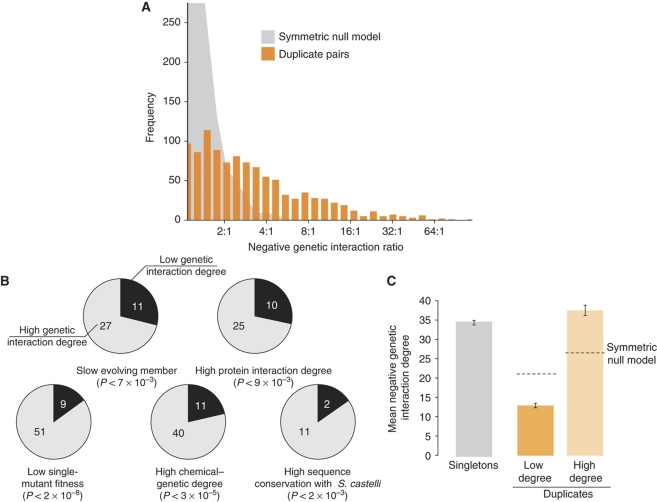
Figure 4 Genetic interactions provide evidence for asymmetric functional divergence. (A) A histogram of the duplicate interaction degree ratio. The ratio is defined for unique interactions with the higher degree in the numerator. Pairs included must have at least 10 total interactions between them, with each member having at least one interaction. Shown for comparison is another degree ratio histogram in which interactions for every duplicate pair are redistributed to either member with equal probability (symmetric null model). (B) Relating selection pressure measures on asymmetric duplicate pairs. Pairs with a unique interaction ratio exceeding 7:1 (60 pairs) are compared across several different sequence or functional genomic data sets. Each gene was put into the high or low interaction degree bin by comparison with its sister. Each pair was then examined for agreement in directionality with the indicated data set. For example, in 27 out of 38 pairs, the sister with higher genetic interaction degree also has a lower rate of sequence change. Comparisons with <60 pairs reflect missing pairs in the secondary data set. Also shown are P-values resulting from a binomial test in which genetic interaction degree is assumed independent of the other data type. (C) The number of negative genetic interactions for singletons and duplicates. Each duplicate pair was sorted by genetic interaction degree and means are shown. Dotted lines represent the same process applied to the simulated distribution from Figure 4A. The difference between high-degree duplicates and singletons is significant (34.9 versus 37.2; P<5 × 10⁻⁸; Wilcoxon rank-sum); however, the mean number of singleton interactions is reduced by a large portion of singletons with no measurable deletion effect, and the significant difference presented here subsides when controlling for gene importance (Supplementary Figure 7).
Figure 4 Genetic interactions provide evidence for asymmetric functional divergence. (A) A histogram of the duplicate interaction degree ratio. The ratio is defined for unique interactions with the higher degree in the numerator. Pairs included must have at least 10 total interactions between them, with each member having at least one interaction. Shown for comparison is another degree ratio histogram in which interactions for every duplicate pair are redistributed to either member with equal probability (symmetric null model). (B) Relating selection pressure measures on asymmetric duplicate pairs. Pairs with a unique interaction ratio exceeding 7:1 (60 pairs) are compared across several different sequence or functional genomic data sets. Each gene was put into the high or low interaction degree bin by comparison with its sister. Each pair was then examined for agreement in directionality with the indicated data set. For example, in 27 out of 38 pairs, the sister with higher genetic interaction degree also has a lower rate of sequence change. Comparisons with <60 pairs reflect missing pairs in the secondary data set. Also shown are P-values resulting from a binomial test in which genetic interaction degree is assumed independent of the other data type. (C) The number of negative genetic interactions for singletons and duplicates. Each duplicate pair was sorted by genetic interaction degree and means are shown. Dotted lines represent the same process applied to the simulated distribution from Figure 4A. The difference between high-degree duplicates and singletons is significant (34.9 versus 37.2; P<5 × 10⁻⁸; Wilcoxon rank-sum); however, the mean number of singleton interactions is reduced by a large portion of singletons with no measurable deletion effect, and the significant difference presented here subsides when controlling for gene importance (Supplementary Figure 7).CC BY-NC-SA · PubMed Central
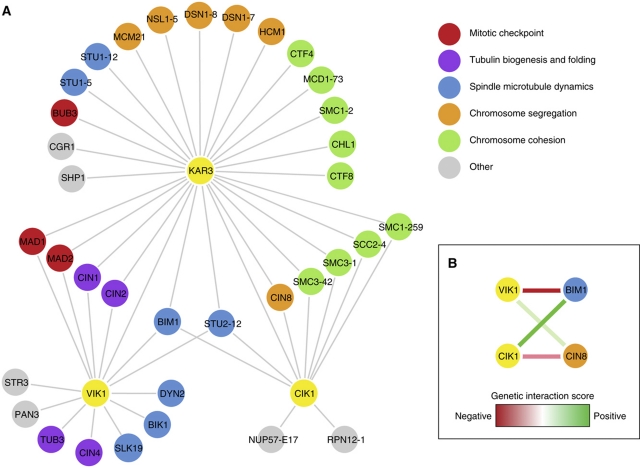
Figure 5 Functional analysis of duplicate pair CIK1–VIK1 (A) Genetic interaction profile similarity. Similarity scores were taken from Costanzo et al (2010) and represent a combination of array side and query side correlations (Materials and methods). Nodes shown include all first neighbors of the three primary genes of interest (CIK1, VIK1 and KAR3). A threshold of 0.2 was used as in Costanzo et al (2010) and edges between first neighbors of genes of interest have been removed for clarity. (B) Genetic interactions. SGA genetic interaction scores from Costanzo et al (2010) highlight differences between CIK1 and VIK1. Green lines represent positive interactions, whereas red lines represent negative interactions. The opacity of the line is proportional to the strength of the interaction.
Figure 5 Functional analysis of duplicate pair CIK1–VIK1 (A) Genetic interaction profile similarity. Similarity scores were taken from Costanzo et al (2010) and represent a combination of array side and query side correlations (Materials and methods). Nodes shown include all first neighbors of the three primary genes of interest (CIK1, VIK1 and KAR3). A threshold of 0.2 was used as in Costanzo et al (2010) and edges between first neighbors of genes of interest have been removed for clarity. (B) Genetic interactions. SGA genetic interaction scores from Costanzo et al (2010) highlight differences between CIK1 and VIK1. Green lines represent positive interactions, whereas red lines represent negative interactions. The opacity of the line is proportional to the strength of the interaction.CC BY-NC-SA · PubMed Central
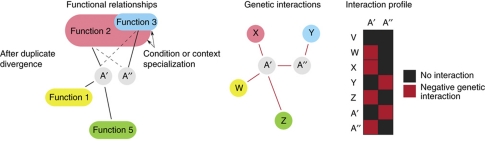
Figure 6 Updated model of asymmetric duplicate genetic interaction evolution. Asymmetry is rapidly established through the absence of purifying selection on a duplicate pair, but in rare cases, the quickly evolving duplicate confers a fitness advantage through functional or context specialization (Function 3). Subsequent selection on Function 3, however, also maintains a limited capacity of duplicate A′′ to carry out Function 2 (dotted lines). In this scenario, there is overlap in function, but the efficacy of the duplicate pair with respect to a particular function differs, and so the buffering is asymmetric. Fewer genetic interactions are observed for A′′ either because of its less constrained function or because of its role in other environmental or developmental contexts.
Figure 6 Updated model of asymmetric duplicate genetic interaction evolution. Asymmetry is rapidly established through the absence of purifying selection on a duplicate pair, but in rare cases, the quickly evolving duplicate confers a fitness advantage through functional or context specialization (Function 3). Subsequent selection on Function 3, however, also maintains a limited capacity of duplicate A′′ to carry out Function 2 (dotted lines). In this scenario, there is overlap in function, but the efficacy of the duplicate pair with respect to a particular function differs, and so the buffering is asymmetric. Fewer genetic interactions are observed for A′′ either because of its less constrained function or because of its role in other environmental or developmental contexts.CC BY-NC-SA · PubMed Central

Verification

Claims the paper makes

The claims and statistics of this paper haven’t been checked yet.

Run the check — free, no account needed. It reads the open-access text and checks the sources it cites.

A few free checks a day · papers already verified open instantly · results are public

Claims other papers make about this one

Each is checked against this paper’s own text: does it say what the citing paper says it does?

Self-check

Percentages, sums and reported differences re-computed from the paper’s own numbers.

The self-check needs the paper’s full text.

Citations

Cites

Show all 69 references

Cited by

Sorted by citations

Items 101–109 of 109

Metadata

Authors
VanderSluis, B., Bellay, J., Musso, G., Costanzo, M., Papp, B., Vizeacoumar, F. J., Baryshnikova, A., Andrews, B., Boone, C., & Myers, C. L.
Affiliations
  • University of Minnesota (US)
  • University of Toronto (CA)
  • University of Cambridge (GB)
Corresponding author
Myers, Chad L
Venue
Molecular Systems Biology
Published
2010-11-16
Volume
6
Issue
1
Pages
429-429
ISSN
1744-4292 (ISSN-L)
OpenAlex
W2148726194
Cited by
110
References
69
Citations by year
2026: 5 · 2025: 9 · 2024: 3 · 2023: 7 · 2022: 4 · 2021: 3 · 2020: 4 · 2019: 1 · 2018: 2 · 2017: 19 · 2016: 5 · 2015: 7 · 2014: 9 · 2013: 15 · 2012: 10
FWCI
4.17
Type
journal article
Language
en
Open access
Locations
  • Molecular Systems Biology (publishedVersion, cc-by-nc-sa)
  • PubMed Central (publishedVersion, cc-by-nc-sa)
  • PubMed (publishedVersion)
  • DOAJ (DOAJ: Directory of Open Access Journals) (submittedVersion)
Funders
  • University of Minnesota
  • Canadian Institute for Advanced Research
  • Genome Canada
  • Ontario Genomics
  • Ontario Genomics Institute
  • Hungarian Scientific Research Fund
  • Magyar Tudományos Akadémia
  • National Institutes of Health
  • Canadian Institutes of Health Research (GSP-415-67)
  • National Human Genome Research Institute (R01HG005084)
Topics
  • Life Sciences › Biochemistry, Genetics and Molecular Biology › Molecular Biology › Bioinformatics and Genomic Networks
  • Life Sciences › Biochemistry, Genetics and Molecular Biology › Molecular Biology › Fungal and yeast genetics research
  • Life Sciences › Biochemistry, Genetics and Molecular Biology › Genetics › Evolution and Genetic Dynamics
Keywords
duplicate genes, gene duplication, genetic interactions, functional redundancy, functional divergence, Saccharomyces cerevisiae, evolutionary trajectories
MeSH terms
Biological Evolution, Models, Genetic, Saccharomyces cerevisiae, Genetic Variation, Gene Expression, Gene Expression Regulation, Fungal, Genome, Fungal, Gene Dosage, Evolution, Molecular, Genes, Duplicate, Genome-Wide Association Study

About these checks

Registry, retraction, Cites and statistics results are computed, not judged, with one exception: a printed reference that no index lists is read once by a model before it counts as a citation error. Claims are extracted by a model and kept only when their quote appears verbatim in the text; each cited source is then checked, with a model’s help, for whether it says what the claim relies on. Those verdicts can be wrong — read the claim’s quote and the cited source before relying on one.

Statistics and arithmetic are recomputed, not judged.

Confidence bands are shown only for fields calibrated on our annotated test set. None is calibrated yet, so no band is shown.

What counts as a claim ›How we measure confidence ›How we check this ›

Are you an author, or do you see a problem with this page? Request a review