

The DOI matches its Crossref record; 2 of the 2 references it cites were found in a registry or an index.
1,003 reference genomes of bacterial and archaeal isolates expand coverage of the tree of life
Abstract
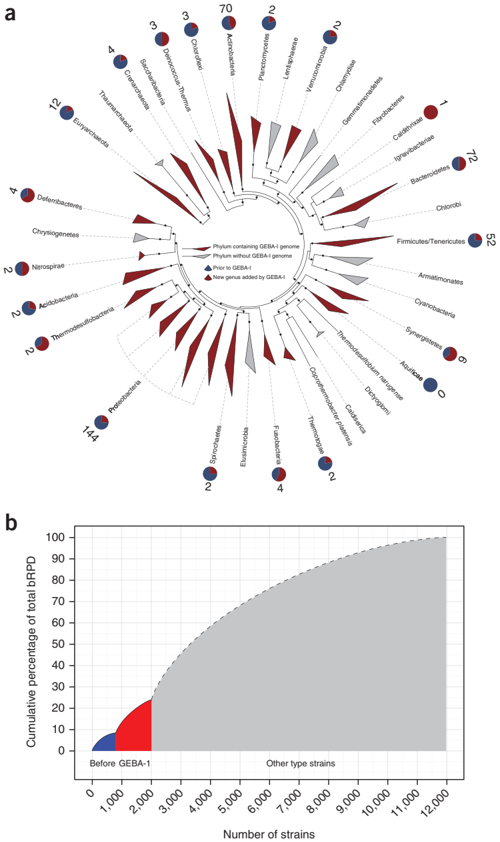
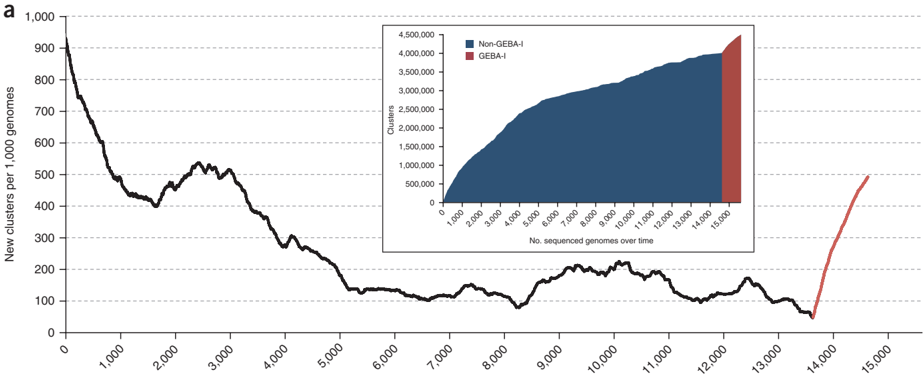
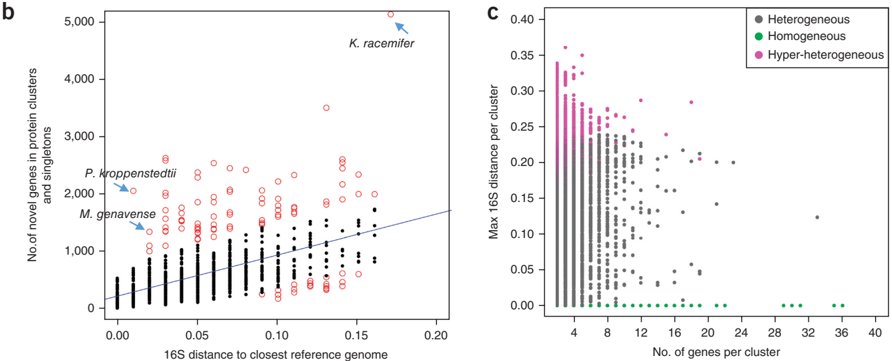
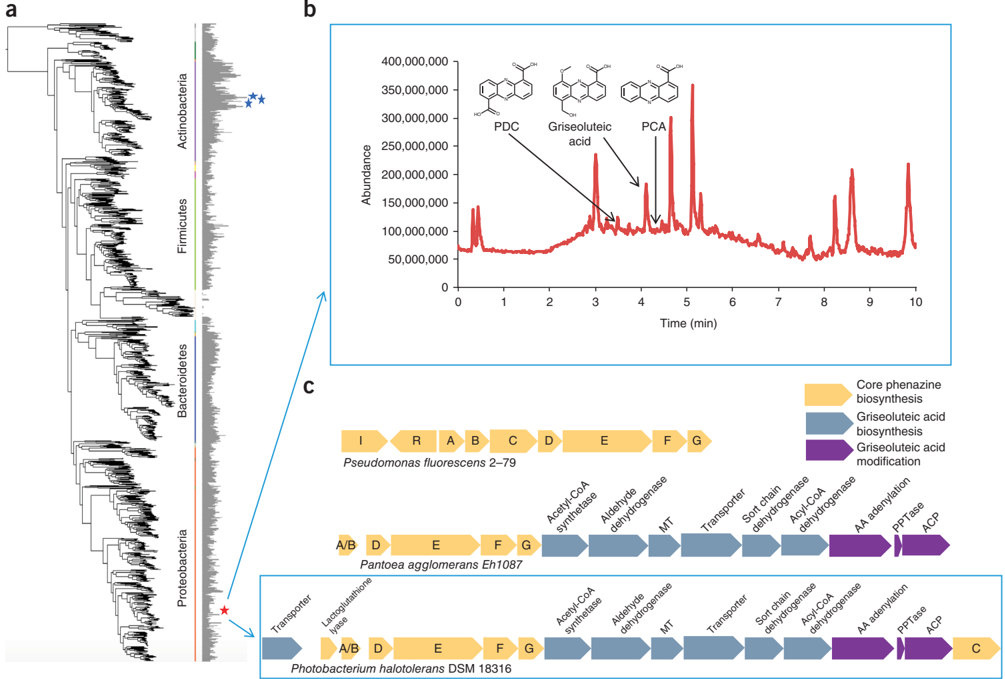
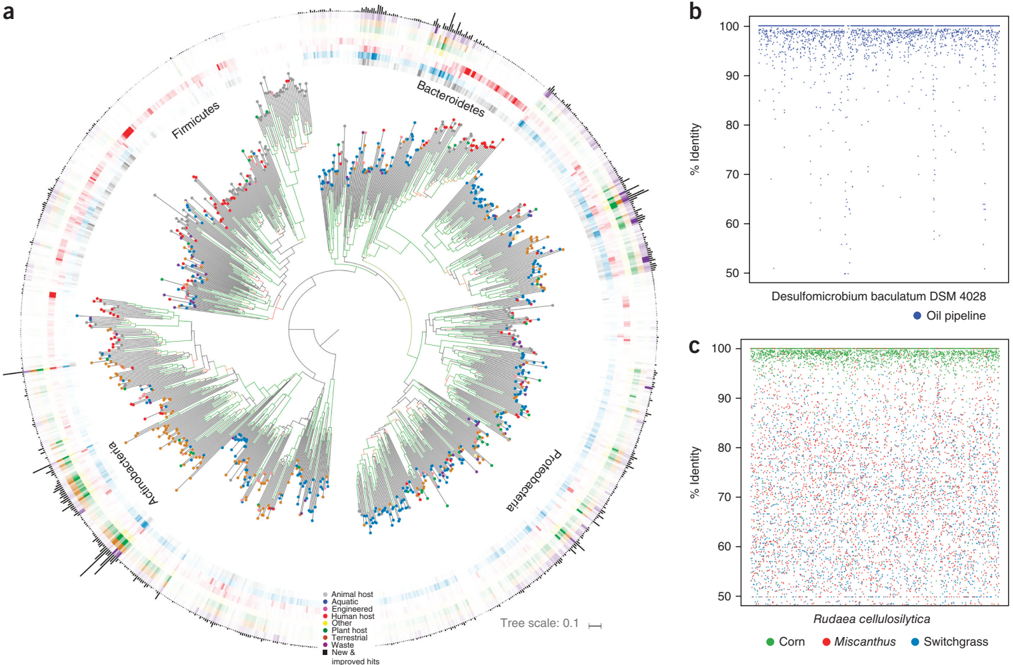
We present 1,003 reference genomes that were sequenced as part of the Genomic Encyclopedia of Bacteria and Archaea (GEBA) initiative, selected to maximize sequence coverage of phylogenetic space. These genomes double the number of existing type strains and expand their overall phylogenetic diversity by 25%. Comparative analyses with previously available finished and draft genomes reveal a 10.5% increase in novel protein families as a function of phylogenetic diversity. The GEBA genomes recruit 25 million previously unassigned metagenomic proteins from 4,650 samples, improving their phylogenetic and functional interpretation. We identify numerous biosynthetic clusters and experimentally validate a divergent phenazine cluster with potential new chemical structure and antimicrobial activity. This Resource is the largest single release of reference genomes to date. Bacterial and archaeal isolate sequence space is still far from saturated, and future endeavors in this direction will continue to be a valuable resource for scientific discovery.
Overview
The claims and statistics of this paper haven’t been checked yet.
Run the check — free, no account needed. It reads the open-access text and checks the sources it cites.
Integrity signals
Registry
Cites
Statistics
Figures
Verification
Claims the paper makes
The claims and statistics of this paper haven’t been checked yet.
Run the check — free, no account needed. It reads the open-access text and checks the sources it cites.
Claims other papers make about this one
Each is checked against this paper’s own text: does it say what the citing paper says it does?
In the citing paper
“A survey of bacterial genomes from the Joint Genome Institute’s GEBA set of representative prokaryotic genomes76 shows that >85% of strains in the collection possess a fluoride exporter (Fig. 3).”
From The link between ancient microbial fluoride resistance mechanisms and bioengineering organofluorine degradation or synthesis (2024) · cites this paper as [76]
Self-check
Percentages, sums and reported differences re-computed from the paper’s own numbers.
The self-check needs the paper’s full text.
Citations
Cites
BLAST+: architecture and applications
Camacho, C., Coulouris, G., Avagyan, V., Ma, N., Papadopoulos, J., Bealer, K., & Madden, T. L. (2009) · BMC Bioinformatics · doi:10.1186/1471-2105-10-421 · Cited by 22,074
Subsistence strategies in traditional societies distinguish gut microbiomes
Obregon-Tito, A. J., Tito, R. Y., Metcalf, J., Sankaranarayanan, K., Clemente, J. C., Ursell, L. K., Zech Xu, Z., Van Treuren, W., Knight, R., Gaffney, P. M., et al. (2015) · Nature Communications · doi:10.1038/ncomms7505 · Cited by 587
Research works printed but not linked: 70
- Mukherjee, S. et al. Genomes OnLine Database (GOLD) v.6: data updates and feature enhancements. Nucleic Acids Res. 45, D446–D456 (2017). · DOI
- Kunin, V., Cases, I., Enright, A.J., de Lorenzo, V. & Ouzounis, C.A. Myriads of protein families, and still counting. Genome Biol. 4, 401 (2003). · DOI
- Wu, D. et al. A phylogeny-driven genomic encyclopaedia of Bacteria and Archaea. Nature 462, 1056–1060 (2009). · DOI
- Kyrpides, N.C. Fifteen years of microbial genomics: meeting the challenges and fulfilling the dream. Nat. Biotechnol. 27, 627–632 (2009). · DOI
- Rinke, C. et al. Insights into the phylogeny and coding potential of microbial dark matter. Nature 499, 431–437 (2013). · DOI · Paper page
- Göker, M. & Klenk, H.-P. Phylogeny-driven target selection for large-scale genome-sequencing (and other) projects. Stand. Genomic Sci. 8, 360–374 (2013). · DOI
- Varghese, N.J. et al. Microbial species delineation using whole genome sequences. Nucleic Acids Res. 43, 6761–6771 (2015). · DOI
- Baltrus, D.A. Divorcing Strain Classification from Species Names. Trends Microbiol. 24, 431–439 (2016). · DOI
- Klenk, H.-P. & Göker, M. En route to a genome-based classification of Archaea and Bacteria? Syst. Appl. Microbiol. 33, 175–182 (2010). · DOI
- Parker, C.T., Tindall, B.J. & Garrity, G.M. International Code of Nomenclature of Prokaryotes. Int. J. Syst. Evol. Microbiol. http://dx.doi.org/10.1099/ijsem.0.000778 (2015). · DOI
- Garrity, G.M. A genomics driven taxonomy of Bacteria and Archaea: are we there, yet? J. Clin. Microbiol. 54, 1956–1963 (2016). · DOI
- Kyrpides, N.C. et al. Genomic encyclopedia of bacteria and archaea: sequencing a myriad of type strains. PLoS Biol. 12, e1001920 (2014). · DOI
- Kyrpides, N.C. et al. Genomic Encyclopedia of Type Strains, Phase I: the one thousand microbial genomes (KMG-I) project. Stand. Genomic Sci. 9, 1278–1284 (2013). · DOI
- Parks, D.H., Imelfort, M., Skennerton, C.T., Hugenholtz, P. & Tyson, G.W. CheckM: assessing the quality of microbial genomes recovered from isolates, single cells, and metagenomes. Genome Res. 25, 1043–1055 (2015). · DOI · Paper page
- Chen, I.-M.A. et al. IMG/M: integrated genome and metagenome comparative data analysis system. Nucleic Acids Res. 45, D507–D516 (2017). · DOI
- Chang, Y.-J. et al. Non-contiguous finished genome sequence and contextual data of the filamentous soil bacterium Ktedonobacter racemifer type strain (SOSP1-21). Stand. Genomic Sci. 5, 97–111 (2011). · DOI
- Roth, A. et al. Novel diagnostic algorithm for identification of mycobacteria using genus-specific amplification of the 16S-23S rRNA gene spacer and restriction endonucleases. J. Clin. Microbiol. 38, 1094–1104 (2000). · DOI
- Tortoli, E. Impact of genotypic studies on mycobacterial taxonomy: the new mycobacteria of the 1990s. Clin. Microbiol. Rev. 16, 319–354 (2003). · DOI
- Taylor, B.L. & Zhulin, I.B. PAS domains: internal sensors of oxygen, redox potential, and light. Microbiol. Mol. Biol. Rev. 63, 479–506 (1999). · DOI · Paper page
- Abt, B. et al. Complete genome sequence of the termite hindgut bacterium Spirochaeta coccoides type strain (SPN1(T)), reclassification in the genus Sphaerochaeta as Sphaerochaeta coccoides comb. nov. and emendations of the family Spirochaetaceae and the genus Sphaerochaeta. Stand. Genomic Sci. 6, 194–209 (2012). · DOI
- Cipollone, R., Ascenzi, P. & Visca, P. Common themes and variations in the rhodanese superfamily. IUBMB Life 59, 51–59 (2007). · DOI
- Galtier, N. & Daubin, V. Dealing with incongruence in phylogenomic analyses. Phil. Trans. R. Soc. Lond. B 363, 4023–4029 (2008). · DOI
- Hadjithomas, M. et al. IMG-ABC: a knowledge base to fuel discovery of biosynthetic gene clusters and novel secondary metabolites. MBio 6, e00932 (2015). · DOI
- van Wezel, G.P. & McDowall, K.J. The regulation of the secondary metabolism of Streptomyces: new links and experimental advances. Nat. Prod. Rep. 28, 1311–1333 (2011). · DOI
- Cimermancic, P. et al. Insights into secondary metabolism from a global analysis of prokaryotic biosynthetic gene clusters. Cell 158, 412–421 (2014). · DOI
- Bérdy, J. Bioactive microbial metabolites. J. Antibiot. (Tokyo) 58, 1–26 (2005). · DOI · Paper page
- Giddens, S.R., Feng, Y. & Mahanty, H.K. Characterization of a novel phenazine antibiotic gene cluster in Erwinia herbicola Eh1087. Mol. Microbiol. 45, 769–783 (2002). · DOI
- Imamura, N. et al. New anticancer antibiotics pelagiomicins, produced by a new marine bacterium Pelagiobacter variabilis. J. Antibiot. (Tokyo) 50, 8–12 (1997). · DOI
- Kim, M.K. et al. Solirubrobacter soli sp. nov., isolated from soil of a ginseng field. Int. J. Syst. Evol. Microbiol. 57, 1453–1455 (2007). · DOI
- Weon, H.-Y. et al. Rudaea cellulosilytica gen. nov., sp. nov., isolated from soil. Int. J. Syst. Evol. Microbiol. 59, 2308–2312 (2009). · DOI
- An, D. et al. Metagenomic analysis indicates epsilonproteobacteria as a potential cause of microbial corrosion in pipelines injected with bisulfite. Front. Microbiol. 7, 28 (2016). · DOI
- Deng, Z.S. et al. Diversity of endophytic bacteria within nodules of the Sphaerophysa salsula in different regions of Loess Plateau in China. FEMS Microbiol. Ecol. 76, 463–475 (2011). · DOI
- Zakhia, F. et al. Diverse bacteria associated with root nodules of spontaneous legumes in Tunisia and first report for nifH-like gene within the genera Microbacterium and Starkeya. Microb. Ecol. 51, 375–393 (2006). · DOI
- Dong, Y., Iniguez, A.L., Ahmer, B.M.M. & Triplett, E.W. Kinetics and strain specificity of rhizosphere and endophytic colonization by enteric bacteria on seedlings of Medicago sativa and Medicago truncatula. Appl. Environ. Microbiol. 69, 1783–1790 (2003). · DOI
- Schikora, A. et al. Conservation of Salmonella infection mechanisms in plants and animals. PLoS One 6, e24112 (2011). · DOI
- Han, C. et al. Complete genome sequence of Treponema succinifaciens type strain (6091). Stand. Genomic Sci. 4, 361–370 (2011). · DOI
- Delmont, T.O. et al. Reconstructing rare soil microbial genomes using in situ enrichments and metagenomics. Front. Microbiol. 6, 358 (2015).
- Mavromatis, K. et al. Complete genome sequence of Coraliomargarita akajimensis type strain (04OKA010-24). Stand. Genomic Sci. 2, 290–299 (2010). · DOI
- Satinsky, B.M. et al. The Amazon continuum dataset: quantitative metagenomic and metatranscriptomic inventories of the Amazon River plume, June 2010. Microbiome 2, 17 (2014). · DOI
- Pati, A. et al. Complete genome sequence of Sphaerobacter thermophilus type strain (S 6022). Stand. Genomic Sci. 2, 49–56 (2010). · DOI
- D'haeseleer, P. et al. Proteogenomic analysis of a thermophilic bacterial consortium adapted to deconstruct switchgrass. PLoS One 8, e68465 (2013). · DOI
- Paez-Espino, D. et al. Uncovering Earth's virome. Nature 536, 425–430 (2016). · DOI
- Yooseph, S. et al. The Sorcerer II Global Ocean Sampling expedition: expanding the universe of protein families. PLoS Biol. 5, e16 (2007). · DOI
- Rusch, D.B. et al. The Sorcerer II Global Ocean Sampling expedition: northwest Atlantic through eastern tropical Pacific. PLoS Biol. 5, e77 (2007). · DOI
- Sunagawa, S. et al. Ocean plankton. Structure and function of the global ocean microbiome. Science 348, 1261359 (2015). · DOI
- Hug, L.A. et al. A new view of the tree of life. Nat. Microbiol. 1, 16048 (2016). · DOI · Paper page
- Anantharaman, K. et al. Thousands of microbial genomes shed light on interconnected biogeochemical processes in an aquifer system. Nat. Commun. 7, 13219 (2016). · DOI
- Guo, C.-J. et al. Discovery of reactive microbiota-derived metabolites that inhibit host proteases. Cell 168, 517–526.e18 (2017). · DOI
- Li, L.-L., McCorkle, S.R., Monchy, S., Taghavi, S. & van der Lelie, D. Bioprospecting metagenomes: glycosyl hydrolases for converting biomass. Biotechnol. Biofuels 2, 10 (2009). · DOI
- Voget, S., Steele, H.L. & Streit, W.R. Characterization of a metagenome-derived halotolerant cellulase. J. Biotechnol. 126, 26–36 (2006). · DOI
- Anton, B.P., Kasif, S., Roberts, R.J. & Steffen, M. Objective: biochemical function. Front. Genet. 5, 210 (2014). · DOI
- Yarza, P. et al. The All-Species Living Tree project: a 16S rRNA-based phylogenetic tree of all sequenced type strains. Syst. Appl. Microbiol. 31, 241–250 (2008). · DOI
- Mavromatis, K. et al. The fast changing landscape of sequencing technologies and their impact on microbial genome assemblies and annotation. PLoS One 7, e48837 (2012). · DOI
- Zerbino, D.R. & Birney, E. Velvet: algorithms for de novo short read assembly using de Bruijn graphs. Genome Res. 18, 821–829 (2008). · DOI
- Butler, J. et al. ALLPATHS: de novo assembly of whole-genome shotgun microreads. Genome Res. 18, 810–820 (2008). · DOI
- Huntemann, M. et al. The standard operating procedure of the DOE-JGI Metagenome Annotation Pipeline (MAP v.4). Stand. Genomic Sci. 11, 17 (2016). · DOI
- Tripp, H.J. et al. Toward a standard in structural genome annotation for prokaryotes. Stand. Genomic Sci. 10, 45 (2015). · DOI
- Hyatt, D. et al. Prodigal: prokaryotic gene recognition and translation initiation site identification. BMC Bioinformatics 11, 119 (2010). · DOI
- Pati, A. et al. GenePRIMP: a gene prediction improvement pipeline for prokaryotic genomes. Nat. Methods 7, 455–457 (2010). · DOI
- Eloe-Fadrosh, E.A. et al. Global metagenomic survey reveals a new bacterial candidate phylum in geothermal springs. Nat. Commun. 7, 10476 (2016). · DOI
- Mistry, J., Finn, R.D., Eddy, S.R., Bateman, A. & Punta, M. Challenges in homology search: HMMER3 and convergent evolution of coiled-coil regions. Nucleic Acids Res. 41, e121 (2013). · DOI
- Darling, A.E. et al. PhyloSift: phylogenetic analysis of genomes and metagenomes. PeerJ 2, e243 (2014). · DOI
- Letunic, I. & Bork, P. Interactive Tree Of Life v2: online annotation and display of phylogenetic trees made easy. Nucleic Acids Res. 39, W475 (2011). · DOI
- Huntemann, M. et al. The standard operating procedure of the DOE-JGI Microbial Genome Annotation Pipeline (MGAP v.4). Stand. Genomic Sci. 10, 86 (2015). · DOI
- Hauser, M., Mayer, C.E. & Söding, J. kClust: fast and sensitive clustering of large protein sequence databases. BMC Bioinformatics 14, 248 (2013). · DOI
- Weber, T. et al. antiSMASH 3.0-a comprehensive resource for the genome mining of biosynthetic gene clusters. Nucleic Acids Res. 43, W237 (2015). · DOI
- Kiełbasa, S.M., Wan, R., Sato, K., Horton, P. & Frith, M.C. Adaptive seeds tame genomic sequence comparison. Genome Res. 21, 487–493 (2011). · DOI
- Meier-Kolthoff, J.P., Auch, A.F., Klenk, H.-P. & Göker, M. Highly parallelized inference of large genome-based phylogenies. Concurr. Comput. Pract. Exp. 26, 1715–1729 (2014). · DOI
- Auch, A.F., Henz, S.R., Holland, B.R. & Göker, M. Genome BLAST distance phylogenies inferred from whole plastid and whole mitochondrion genome sequences. BMC Bioinformatics 7, 350 (2006). · DOI
- Lefort, V., Desper, R. & Gascuel, O. FastME 2.0: a comprehensive, accurate, and fast distance-based phylogeny inference program. Mol. Biol. Evol. 32, 2798–2800 (2015). · DOI
Cited by
Sorted by citations
High throughput ANI analysis of 90K prokaryotic genomes reveals clear species boundaries
Jain, C., Rodriguez-R, L. M., Phillippy, A. M., Konstantinidis, K. T., & Aluru, S. (2018) · Nature Communications · doi:10.1038/s41467-018-07641-9 · Cited by 5,748
Best practices for analysing microbiomes
Knight, R., Vrbanac, A., Taylor, B. C., Aksenov, A., Callewaert, C., Debelius, J., Gonzalez, A., Kosciolek, T., McCall, L.-I., McDonald, D., et al. (2018) · Nature Reviews Microbiology · doi:10.1038/s41579-018-0029-9 · Cited by 2,030
Recovery of nearly 8,000 metagenome-assembled genomes substantially expands the tree of life
Parks, D. H., Rinke, C., Chuvochina, M., Chaumeil, P.-A., Woodcroft, B. J., Evans, P. N., Hugenholtz, P., & Tyson, G. W. (2017) · Nature Microbiology · doi:10.1038/s41564-017-0012-7 · Cited by 1,882
Self-citationThe Human Gut Microbiome: From Association to Modulation
Schmidt, T. S. B., Raes, J., & Bork, P. (2018) · Cell · doi:10.1016/j.cell.2018.02.044 · Cited by 845
Cultivation and sequencing of rumen microbiome members from the Hungate1000 Collection
Hungate1000 project collaborators, Seshadri, R., Leahy, S. C., Attwood, G. T., Teh, K. H., Lambie, S. C., Cookson, A. L., Eloe-Fadrosh, E. A., Pavlopoulos, G. A., Hadjithomas, M., et al. (2018) · Nature Biotechnology · doi:10.1038/nbt.4110 · Cited by 624
Self-citation
Metadata
- Authors
- Mukherjee, S., Seshadri, R., Varghese, N. J., Eloe-Fadrosh, E. A., Meier-Kolthoff, J. P., Göker, M., Coates, R. C., Hadjithomas, M., Pavlopoulos, G. A., Paez-Espino, D., Yoshikuni, Y., Visel, A., Whitman, W. B., Garrity, G. M., Eisen, J. A., Hugenholtz, P., Pati, A., Ivanova, N. N., Woyke, T., Klenk, H.-P., & Kyrpides, N. C.
- Venue
- Nature Biotechnology
- Published
- 2017-06-12
- Volume
- 35
- Issue
- 7
- Pages
- 676-683
- ISSN
- 1087-0156
- 1546-1696
- Cited by
- 267
- References
- 2
- Language
- en
- Update notices
- erratum (2018-04-01)
About these checks
Registry, retraction, Cites and statistics results are computed, not judged, with one exception: a printed reference that no index lists is read once by a model before it counts as a citation error. Claims are extracted by a model and kept only when their quote appears verbatim in the text; each cited source is then checked, with a model’s help, for whether it says what the claim relies on. Those verdicts can be wrong — read the claim’s quote and the cited source before relying on one.
Statistics and arithmetic are recomputed, not judged.
Confidence bands are shown only for fields calibrated on our annotated test set. None is calibrated yet, so no band is shown.
What counts as a claim ›How we measure confidence ›How we check this ›
Are you an author, or do you see a problem with this page? Request a review
