Student or educator? Sign up with your school email and get 6 months of Pro free.
CoChat

The DOI matches its Crossref record; 61 of the 61 references it cites were found in a registry or an index.

Comprehensive catecholaminergic projectome analysis reveals single-neuron integration of zebrafish ascending and descending dopaminergic systems

Open access

Abstract

Essential components of animal behaviour are modulated by dopaminergic (DA) and noradrenergic circuitry. In this study, we reveal at cellular resolution the complete set of projections ('projectome') of every single type of DA and noradrenergio neurons in the central nervous system of zebrafish larvae. The most extensive DA projections are established by posterior tubercular otp-dependent neurons, with individual somata integrating the ascending DA system, the descending diencephalospinal, as well as the endohypothalamic circuitry. These findings suggest a major role in the modulation of physiology and behaviour for otp-dependent DA neurons, which correlate with the mammalian A11 group. We further identified an endogenous subpallial DA system that not only provides most of the local DA projections, but also connects to the ventral diencephalon. The catecholaminergic projectome map provides a framework to understand the evolution and function of these neuromodulatory systems. Dopaminergic neurons, which are affected in neuronal diseases, have important roles in modulating behaviour, cognition and physiology. In this study, the authors map every projection for each type of dopaminergic neuron in zebrafish larvae, which may help to understand neurological disease.

Overview

The claims and statistics of this paper haven’t been checked yet.

Free: it reads the open-access text and checks the first 5 claims that cite a source we can check. Create a free account to check every claim.

A few free checks a day · papers already verified open instantly · results are public

Integrity signals

Registry

Crossref · 10.1038/ncomms1171

Cites

61 of 61 references verified0 citation errors · 0 not checkable

Statistics

Figures

Figure 1 Analysis of individual zebrafish larval catecholaminergic neurons and projections in the context of the intact brain. (a) Scheme of dopaminergic (DA; blue) and noradrenergic (NA; red) cell groups and catecholaminergic (CA) tracts (grey) in 4 d.p.f. zebrafish larvae12. Left: lateral view of forebrain and midbrain; right: dorsal view of CNS. Dark blue indicates dorsal-most and light blue ventral-most DA groups. Diencephalic DA groups: (DC1) ventral thalamus and periventricular posterior tuberculum; (DC2, DC4) large neurons in posterior tuberculum; (DC5, DC6) medium-sized neurons in posterior tuberculum and hypothalamus; (DC3) medial hypothalamus; (DC7) caudal hypothalamus; PO, preoptic region; POa, anterior preoptic region; Pr, dorsal pretectum; AC, retinal amacrine cells. Telencephalic DA groups: SP, subpallium; OB, olfactory bulb. NA groups: LC, locus coeruleus; MO, medulla oblongata interfascicular zone and vagal area and AP, area postrema. ac, anterior commissure; act, anterior CA tract; eht, endohypothalamic tract; mlct, medial longitudinal CA tract; pc, posterior commissure; poc, postoptic commissure; poht, preopticohypothalamic tract; prp, pretectal projections; prtep, pretectotectal projections. (b–e) In silico separation of individual neurons (arrowheads in b) and their projections from whole-mount confocal image stack raw data. (b) Unprocessed maximum intensity projection (MIP) of a 4 d.p.f. larval brain. Blue masks D and L were manually drawn on the MIPs using ImageJ to separate soma and projections, based on visual discrimination. Bottom-most panel shows an example for computation of 3D segmentation mask M for a single neuron in the AP, based on the drawn masks D and L. The resulting 3D mask M was applied to the green channel to isolate the neuron and its projections. (c) Visualization of segmented AP neuron shown in (b) with projections. Quality control (QC; cyan) was carried out in 3D space within the region of interest (between dotted lines) to ensure the masks did not omit any GFP-labelled features belonging to the particular neuron. (d, e) Visualization of segmented individual soma and projections of GFP-labelled (d) amacrine cell (arrowheads) and (e) NA neuron in the MO interfasicular zone (IZ; arrowheads). See Supplementary Movie 1. Anterior at left, dorsal at top; anti-TH (red), anti-GFP (green); Dor, dorsal view; Lat, lateral view. Scale bars, 20 μm.
Figure 1 Analysis of individual zebrafish larval catecholaminergic neurons and projections in the context of the intact brain. (a) Scheme of dopaminergic (DA; blue) and noradrenergic (NA; red) cell groups and catecholaminergic (CA) tracts (grey) in 4 d.p.f. zebrafish larvae12. Left: lateral view of forebrain and midbrain; right: dorsal view of CNS. Dark blue indicates dorsal-most and light blue ventral-most DA groups. Diencephalic DA groups: (DC1) ventral thalamus and periventricular posterior tuberculum; (DC2, DC4) large neurons in posterior tuberculum; (DC5, DC6) medium-sized neurons in posterior tuberculum and hypothalamus; (DC3) medial hypothalamus; (DC7) caudal hypothalamus; PO, preoptic region; POa, anterior preoptic region; Pr, dorsal pretectum; AC, retinal amacrine cells. Telencephalic DA groups: SP, subpallium; OB, olfactory bulb. NA groups: LC, locus coeruleus; MO, medulla oblongata interfascicular zone and vagal area and AP, area postrema. ac, anterior commissure; act, anterior CA tract; eht, endohypothalamic tract; mlct, medial longitudinal CA tract; pc, posterior commissure; poc, postoptic commissure; poht, preopticohypothalamic tract; prp, pretectal projections; prtep, pretectotectal projections. (b–e) In silico separation of individual neurons (arrowheads in b) and their projections from whole-mount confocal image stack raw data. (b) Unprocessed maximum intensity projection (MIP) of a 4 d.p.f. larval brain. Blue masks D and L were manually drawn on the MIPs using ImageJ to separate soma and projections, based on visual discrimination. Bottom-most panel shows an example for computation of 3D segmentation mask M for a single neuron in the AP, based on the drawn masks D and L. The resulting 3D mask M was applied to the green channel to isolate the neuron and its projections. (c) Visualization of segmented AP neuron shown in (b) with projections. Quality control (QC; cyan) was carried out in 3D space within the region of interest (between dotted lines) to ensure the masks did not omit any GFP-labelled features belonging to the particular neuron. (d, e) Visualization of segmented individual soma and projections of GFP-labelled (d) amacrine cell (arrowheads) and (e) NA neuron in the MO interfasicular zone (IZ; arrowheads). See Supplementary Movie 1. Anterior at left, dorsal at top; anti-TH (red), anti-GFP (green); Dor, dorsal view; Lat, lateral view. Scale bars, 20 μm.CC BY-NC-ND · PubMed Central
Figure 2 Target areas of catecholaminergic projections. The target areas (columns) of projections of each catecholaminergic (CA) neuronal group (rows) are indicated quantitatively by the colour code representing the percentage of total neurons per analysed group that project into the area. The total number of neurons analysed is shown in the furthest right column. For CA groups in which individual somata extend projections to multiple target areas, the percentages add up to more than 100. Lavender indicates the neuronal group is liquor contacting. Projections pass through the commissures with the exception of a few cases in which some processes were noted to terminate there: anterior commissure as target of locus coeruleus and area postrema noradrenergic neurons; postoptic commissure as target of anterior preoptic, preoptic, DC1, 2, 4 and 5 dopaminergic neurons. 'L' (for local projection) denotes the termination of neuronal processes within the region in which the soma is located. DC1 includes populations located in the ventral thalamus and periventricular posterior tuberculum.
Figure 2 Target areas of catecholaminergic projections. The target areas (columns) of projections of each catecholaminergic (CA) neuronal group (rows) are indicated quantitatively by the colour code representing the percentage of total neurons per analysed group that project into the area. The total number of neurons analysed is shown in the furthest right column. For CA groups in which individual somata extend projections to multiple target areas, the percentages add up to more than 100. Lavender indicates the neuronal group is liquor contacting. Projections pass through the commissures with the exception of a few cases in which some processes were noted to terminate there: anterior commissure as target of locus coeruleus and area postrema noradrenergic neurons; postoptic commissure as target of anterior preoptic, preoptic, DC1, 2, 4 and 5 dopaminergic neurons. 'L' (for local projection) denotes the termination of neuronal processes within the region in which the soma is located. DC1 includes populations located in the ventral thalamus and periventricular posterior tuberculum.CC BY-NC-ND · PubMed Central
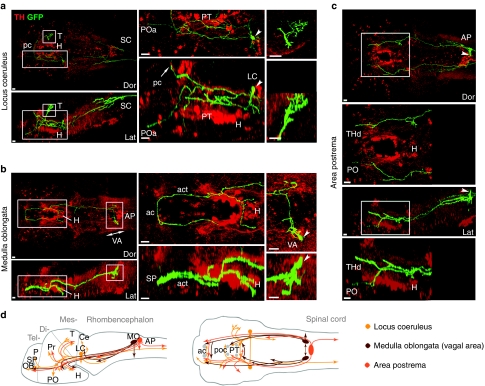
Figure 3 Long-range projections of hindbrain noradrenergic neurons. (a–c) Z projections of confocal stacks in dorsal (Dor) and lateral (Lat) views. (a) A locus coeruleus noradrenergic (NA) neuron (arrowheads) projects into multiple regions of the brain including posterior tuberculum (PT), anterior preoptic region (POa) and the spinal cord (SC) via a descending branched axon. A projection from the soma ascends and crosses the midline via the posterior commissure (pc; arrow in middle bottom panel), and forms an arbour of fine processes within the tectum (T; magnified in rightmost panels). Middle and right panels are magnification of boxes in leftmost panels. See Supplementary Movie 2. H, hypothalamus. (b) A medulla oblongata vagal area (VA) NA neuron (arrowheads) sends a far-reaching axon into the tel- and diencephalon. The long axon forms branches within the posterior tuberculum to innervate the hypothalamus as well as the contralateral side via the anterior catecholaminergic tract (act) and the anterior commissure (ac). A short, branched process (top right panel) appears to target the rhombencephalon. Local fibres emanate from the proximal part of the axon. Middle and right panels are magnification of boxes in left panels. (c) A single area postrema (AP) NA soma (arrowheads) sends long ascending axons terminating in contra- and ipsilateral sides of the diencephalon. The right projection ends in the dorsal thalamus (THd), whereas the left innervates the preoptic region (PO; magnified in below dor and lat panels). See Supplementary Movie 3. Anterior at left, dorsal at top; 4 d.p.f. larvae; anti-TH (red), anti-GFP (green). Scale bars, 20 μm. (d) Schematic overview of NA projections in 4 d.p.f. zebrafish larvae. Projection pathways (indicated by lines) and target areas (indicated by arrowheads) are depicted in lateral (left) and dorsal (right) views. Short arrows (see MO and AP) denote formation of local arbours or processes. For visual clarity in dorsal views, lines and arrows are not depicted left–right reciprocally. Our data indicate no asymmetry. Ce, cerebellum; OB, olfactory bulb; P, pallium; poc, postoptic commissure; Pr, pretectum; SP, subpallium.
Figure 3 Long-range projections of hindbrain noradrenergic neurons. (a–c) Z projections of confocal stacks in dorsal (Dor) and lateral (Lat) views. (a) A locus coeruleus noradrenergic (NA) neuron (arrowheads) projects into multiple regions of the brain including posterior tuberculum (PT), anterior preoptic region (POa) and the spinal cord (SC) via a descending branched axon. A projection from the soma ascends and crosses the midline via the posterior commissure (pc; arrow in middle bottom panel), and forms an arbour of fine processes within the tectum (T; magnified in rightmost panels). Middle and right panels are magnification of boxes in leftmost panels. See Supplementary Movie 2. H, hypothalamus. (b) A medulla oblongata vagal area (VA) NA neuron (arrowheads) sends a far-reaching axon into the tel- and diencephalon. The long axon forms branches within the posterior tuberculum to innervate the hypothalamus as well as the contralateral side via the anterior catecholaminergic tract (act) and the anterior commissure (ac). A short, branched process (top right panel) appears to target the rhombencephalon. Local fibres emanate from the proximal part of the axon. Middle and right panels are magnification of boxes in left panels. (c) A single area postrema (AP) NA soma (arrowheads) sends long ascending axons terminating in contra- and ipsilateral sides of the diencephalon. The right projection ends in the dorsal thalamus (THd), whereas the left innervates the preoptic region (PO; magnified in below dor and lat panels). See Supplementary Movie 3. Anterior at left, dorsal at top; 4 d.p.f. larvae; anti-TH (red), anti-GFP (green). Scale bars, 20 μm. (d) Schematic overview of NA projections in 4 d.p.f. zebrafish larvae. Projection pathways (indicated by lines) and target areas (indicated by arrowheads) are depicted in lateral (left) and dorsal (right) views. Short arrows (see MO and AP) denote formation of local arbours or processes. For visual clarity in dorsal views, lines and arrows are not depicted left–right reciprocally. Our data indicate no asymmetry. Ce, cerebellum; OB, olfactory bulb; P, pallium; poc, postoptic commissure; Pr, pretectum; SP, subpallium.CC BY-NC-ND · PubMed Central
Figure 4 Dopaminergic groups with characteristic short-range or local projection behaviours. (a–e) Z projections of confocal stacks in dorsal (Dor) and lateral (Lat) views. (a) A pretectal dopaminergic (DA) neuron (arrowheads) forms a local arbour within the pretectum (Pr) and projects into the ipsilateral tectum (T; magnified in right panel) and across the posterior commissure (pc) to the contralateral tectum (left panel). H, hypothalamus. (b) A diencephalic cluster (DC) 1 neuron (arrowheads) sends short proximal processes within the ventral thalamus (THv), into the endohypothalamic tract (eht) (magnified in middle and rightmost panels), and descending projections into the rhombencephalon (r). (c) A preoptic DA neuron (arrowhead) projects into the postoptic commissure (poc) and eht (magnified in right panel). (d) A DC3 neuron (arrowhead) located in the paraventricular organ (PVO) is liquor contacting (arrows pointing to end-foot) and contributes to the eht and hypothalamus (magnified in right panel; inset shows GFP signal). (e) Liquor-contacting DC7 soma (arrowhead) within the posterior recess possesses sparse processes (magnified in right panel) that target locally in the caudal hypothalamus (Hc). Anterior at left, dorsal at top; 4 d.p.f. larvae; anti-TH (red), anti-GFP (green, white in panels with black contrast). Scale bars, 20 μm. (f) Scheme of DA groups with local and intermediate projections (4 d.p.f.). Projection pathways (lines) and target areas (arrowheads) are depicted in lateral (left) and dorsal (right) views. Short arrows and 'L' denote local arbours or processes. An asterisk (*) marks liquor-contacting DA groups. For visual clarity, lines and arrows are not depicted left–right reciprocally in dorsal views. Our data indicate no asymmetry. ac, anterior commissure; AP, area postrema; LC, locus coeruleus; and MO, medulla oblongata.
Figure 4 Dopaminergic groups with characteristic short-range or local projection behaviours. (a–e) Z projections of confocal stacks in dorsal (Dor) and lateral (Lat) views. (a) A pretectal dopaminergic (DA) neuron (arrowheads) forms a local arbour within the pretectum (Pr) and projects into the ipsilateral tectum (T; magnified in right panel) and across the posterior commissure (pc) to the contralateral tectum (left panel). H, hypothalamus. (b) A diencephalic cluster (DC) 1 neuron (arrowheads) sends short proximal processes within the ventral thalamus (THv), into the endohypothalamic tract (eht) (magnified in middle and rightmost panels), and descending projections into the rhombencephalon (r). (c) A preoptic DA neuron (arrowhead) projects into the postoptic commissure (poc) and eht (magnified in right panel). (d) A DC3 neuron (arrowhead) located in the paraventricular organ (PVO) is liquor contacting (arrows pointing to end-foot) and contributes to the eht and hypothalamus (magnified in right panel; inset shows GFP signal). (e) Liquor-contacting DC7 soma (arrowhead) within the posterior recess possesses sparse processes (magnified in right panel) that target locally in the caudal hypothalamus (Hc). Anterior at left, dorsal at top; 4 d.p.f. larvae; anti-TH (red), anti-GFP (green, white in panels with black contrast). Scale bars, 20 μm. (f) Scheme of DA groups with local and intermediate projections (4 d.p.f.). Projection pathways (lines) and target areas (arrowheads) are depicted in lateral (left) and dorsal (right) views. Short arrows and 'L' denote local arbours or processes. An asterisk (*) marks liquor-contacting DA groups. For visual clarity, lines and arrows are not depicted left–right reciprocally in dorsal views. Our data indicate no asymmetry. ac, anterior commissure; AP, area postrema; LC, locus coeruleus; and MO, medulla oblongata.CC BY-NC-ND · PubMed Central
Figure 5 Projection behaviours of otp-dependent dopaminergic diencephalic clusters. (a–d) Z projections of confocal stacks in dorsal (Dor) and lateral (Lat) views. Lateral views correspond to magnified regions (middle panels). (a) A DC2 neuron (arrowheads) contributes to the endohypothalamic tract (eht), forms local arbours and ventral processes into preoptic region (PO) and hypothalamus (H) (magnified in middle panel). A long axon descends into the hindbrain with branches (arrows) across the midline, and into the spinal cord (not shown). (b) A DC4 soma (arrowheads) with short processes contributing to the eht and connecting within the hypothalamus (magnified in middle panel), a dorsal branch extending towards the lateral pretectum (Pr) and tectum (T) (bottom panel), and long descending axons (arrows) into left and right hindbrain. (c) A DC5 soma (arrowheads) with ipsilateral and contralateral contributions to the eht (magnified in middle panel). From the ipsilateral eht, a branch (arrow) extends dorsoposteriorly into the medial longitudinal catecholaminergic tract to the hindbrain. (d) A DC6 axon (arrowheads) arbourizes extensively in the hypothalamus (magnified in middle panel) and projects towards the caudal midbrain and anterior hindbrain (bottom panel). r, rhombencephalon. Anterior at left, dorsal at top; 4 d.p.f. larvae; anti-TH (red), anti-GFP (green). Scale bars, 20 μm. (e) Schematic overview of DC2, DC4, DC5, and DC6 projection pathways (lines) and target areas (arrowheads) in lateral (left) and dorsal (right) views. 'L' denotes local arbours or processes. For visual clarity, lines and arrows are not depicted left–right reciprocally in dorsal views. Our data indicate no asymmetry. AP, area postrema; dl, lateral diencephalon; LC, locus coeruleus; MO, medulla oblongata; PT, posterior tuberculum; SP, subpallium.
Figure 5 Projection behaviours of otp-dependent dopaminergic diencephalic clusters. (a–d) Z projections of confocal stacks in dorsal (Dor) and lateral (Lat) views. Lateral views correspond to magnified regions (middle panels). (a) A DC2 neuron (arrowheads) contributes to the endohypothalamic tract (eht), forms local arbours and ventral processes into preoptic region (PO) and hypothalamus (H) (magnified in middle panel). A long axon descends into the hindbrain with branches (arrows) across the midline, and into the spinal cord (not shown). (b) A DC4 soma (arrowheads) with short processes contributing to the eht and connecting within the hypothalamus (magnified in middle panel), a dorsal branch extending towards the lateral pretectum (Pr) and tectum (T) (bottom panel), and long descending axons (arrows) into left and right hindbrain. (c) A DC5 soma (arrowheads) with ipsilateral and contralateral contributions to the eht (magnified in middle panel). From the ipsilateral eht, a branch (arrow) extends dorsoposteriorly into the medial longitudinal catecholaminergic tract to the hindbrain. (d) A DC6 axon (arrowheads) arbourizes extensively in the hypothalamus (magnified in middle panel) and projects towards the caudal midbrain and anterior hindbrain (bottom panel). r, rhombencephalon. Anterior at left, dorsal at top; 4 d.p.f. larvae; anti-TH (red), anti-GFP (green). Scale bars, 20 μm. (e) Schematic overview of DC2, DC4, DC5, and DC6 projection pathways (lines) and target areas (arrowheads) in lateral (left) and dorsal (right) views. 'L' denotes local arbours or processes. For visual clarity, lines and arrows are not depicted left–right reciprocally in dorsal views. Our data indicate no asymmetry. AP, area postrema; dl, lateral diencephalon; LC, locus coeruleus; MO, medulla oblongata; PT, posterior tuberculum; SP, subpallium.CC BY-NC-ND · PubMed Central
Figure 6 Individual somata of DC2 and DC4 emanate both ascending and descending projections. (a, b) Z projections of confocal stacks in dorsal (Dor) and lateral (Lat) views. (a) A DC2 neuron (arrowheads) within the posterior tuberculum (PT) projects both an ascending axon (single arrows) to the subpallium (SP) and a descending axon into the spinal cord. This neuron also forms a local arbour in the PT and ventral processes targeting the preoptic region (PO). Branches derived from the main descending axon were observed in the rhombencephalon (r), however, this region (double arrows) could not be clearly segmented because of the presence of a second GFP-labelled DC2 cell in the left PT, which contributed a midline-crossing branch into this area (inset). See Supplementary Movie 4. (b) A DC4 neuron (arrowheads) in the PT sends long ascending (single arrows) as well as descending (broad arrow) projections. Local processes in the PT and hypothalamus (H) also originate from this DC4 soma (double arrows). Its ascending projection arbourizes within the SP (magnified in the right panels). Anterior at left, dorsal at top; 4 d.p.f. larvae; anti-TH (red), anti-GFP (green). Scale bars, 20 μm. (c) Schematic overview of DC2 and DC4 projection pathways (lines) and target areas (arrowheads). Dorsal (top) and lateral (bottom) views. 'L' denotes local arbours or processes. DC2 and DC4 neurons contribute to wide-ranging ipsilateral and contralateral projections into all major brain subdivisions. For visual clarity, lines and arrows are not depicted left–right reciprocally in dorsal views. Our data indicate no asymmetry. AP, area postrema; dl, lateral diencephalon; LC, locus coeruleus; MO, medulla oblongata; Pr, pretectum; T, tectum.
Figure 6 Individual somata of DC2 and DC4 emanate both ascending and descending projections. (a, b) Z projections of confocal stacks in dorsal (Dor) and lateral (Lat) views. (a) A DC2 neuron (arrowheads) within the posterior tuberculum (PT) projects both an ascending axon (single arrows) to the subpallium (SP) and a descending axon into the spinal cord. This neuron also forms a local arbour in the PT and ventral processes targeting the preoptic region (PO). Branches derived from the main descending axon were observed in the rhombencephalon (r), however, this region (double arrows) could not be clearly segmented because of the presence of a second GFP-labelled DC2 cell in the left PT, which contributed a midline-crossing branch into this area (inset). See Supplementary Movie 4. (b) A DC4 neuron (arrowheads) in the PT sends long ascending (single arrows) as well as descending (broad arrow) projections. Local processes in the PT and hypothalamus (H) also originate from this DC4 soma (double arrows). Its ascending projection arbourizes within the SP (magnified in the right panels). Anterior at left, dorsal at top; 4 d.p.f. larvae; anti-TH (red), anti-GFP (green). Scale bars, 20 μm. (c) Schematic overview of DC2 and DC4 projection pathways (lines) and target areas (arrowheads). Dorsal (top) and lateral (bottom) views. 'L' denotes local arbours or processes. DC2 and DC4 neurons contribute to wide-ranging ipsilateral and contralateral projections into all major brain subdivisions. For visual clarity, lines and arrows are not depicted left–right reciprocally in dorsal views. Our data indicate no asymmetry. AP, area postrema; dl, lateral diencephalon; LC, locus coeruleus; MO, medulla oblongata; Pr, pretectum; T, tectum.CC BY-NC-ND · PubMed Central
Figure 7 Diversity of projection behaviour subtypes of individual DC2 and DC4 neurons. DA neurons of one anatomical group express high diversity of projection behaviours within defined repertoires. DC2 (69 somata) and DC4 (42 somata) neurons were analysed and shown to connect to tel-, di-, mes- and rhombencephalon. Individual somata usually connect through the endohypothalamic tract and send different combinations of projections to the subpallium, lateral forebrain, lateral tectum, hindbrain and/or spinal cord. DA innervation in the preoptic region and lateral forebrain primarily derives from DC2 cells. Individual somata were classified on the basis of their major projections (green), but smaller deviations in branching pattern and targets were allowed (yellow and light green). The rightmost column indicates the number of cells observed for each specific pattern (rows), and in parentheses the total number of cells analysed for DC2 and DC4. Dor, dorsal projections; lat, lateral projections; single in endohypothalamic tract indicates contribution of single axon to tract; (#) ipsilateral distal branch that crosses the midline to target the contralateral side.
Figure 7 Diversity of projection behaviour subtypes of individual DC2 and DC4 neurons. DA neurons of one anatomical group express high diversity of projection behaviours within defined repertoires. DC2 (69 somata) and DC4 (42 somata) neurons were analysed and shown to connect to tel-, di-, mes- and rhombencephalon. Individual somata usually connect through the endohypothalamic tract and send different combinations of projections to the subpallium, lateral forebrain, lateral tectum, hindbrain and/or spinal cord. DA innervation in the preoptic region and lateral forebrain primarily derives from DC2 cells. Individual somata were classified on the basis of their major projections (green), but smaller deviations in branching pattern and targets were allowed (yellow and light green). The rightmost column indicates the number of cells observed for each specific pattern (rows), and in parentheses the total number of cells analysed for DC2 and DC4. Dor, dorsal projections; lat, lateral projections; single in endohypothalamic tract indicates contribution of single axon to tract; (#) ipsilateral distal branch that crosses the midline to target the contralateral side.CC BY-NC-ND · PubMed Central
Figure 8 Extensive arbourization of subpallial DA neurons in the telencephalon. (a–c) Z projections of confocal stacks in dorsal (Dor) and lateral (Lat) views. (a) Three GFP-tagged subpallial neurons (arrowheads) reveal extensive arbourization within the subpallium. Subpallial neurons also frequently connect the left and right subpallium through the anterior commissure (ac; magnified in right panel). Furthermore, one of the subpallial DA neurons sends a descending projection into the hypothalamus (H; arrows). (b) Two subpallial DA neurons (arrowheads) form dense local arbours but no distant projections (magnified in middle and right panels). (c) A single subpallial soma (arrowheads) radiates dense local processes ventrally into telencephalic territories (magnified in middle and right panels), projects in the anterior commissure across the midline to the right subpallium (SP), and sends a descending axon into the hypothalamus (arrows). See Supplementary Movie 5. Anterior at left, dorsal at top; 4 d.p.f. larvae; anti-TH (red), anti-GFP (green; white in middle panels with black contrast). Scale bars, 20 μm.
Figure 8 Extensive arbourization of subpallial DA neurons in the telencephalon. (a–c) Z projections of confocal stacks in dorsal (Dor) and lateral (Lat) views. (a) Three GFP-tagged subpallial neurons (arrowheads) reveal extensive arbourization within the subpallium. Subpallial neurons also frequently connect the left and right subpallium through the anterior commissure (ac; magnified in right panel). Furthermore, one of the subpallial DA neurons sends a descending projection into the hypothalamus (H; arrows). (b) Two subpallial DA neurons (arrowheads) form dense local arbours but no distant projections (magnified in middle and right panels). (c) A single subpallial soma (arrowheads) radiates dense local processes ventrally into telencephalic territories (magnified in middle and right panels), projects in the anterior commissure across the midline to the right subpallium (SP), and sends a descending axon into the hypothalamus (arrows). See Supplementary Movie 5. Anterior at left, dorsal at top; 4 d.p.f. larvae; anti-TH (red), anti-GFP (green; white in middle panels with black contrast). Scale bars, 20 μm.CC BY-NC-ND · PubMed Central

Verification

Claims the paper makes

The claims and statistics of this paper haven’t been checked yet.

Free: it reads the open-access text and checks the first 5 claims that cite a source we can check. Create a free account to check every claim.

A few free checks a day · papers already verified open instantly · results are public

Claims other papers make about this one

Each is checked against this paper’s own text: does it say what the citing paper says it does?

Self-check

Percentages, sums and reported differences re-computed from the paper’s own numbers.

The self-check needs the paper’s full text.

Citations

Cites

Show all 60 references

Research works printed but not linked: 1

  1. Kapsimali, M., Bourrat, F. & Vernier, P. Distribution of the orphan nuclear receptor Nurr1 in medaka (Oryzias latipes): cues to the definition of homologous cell groups in the vertebrate brain. J. Comp. Neurol. 431, 276–292 (2001). · doi:10.1002/1096-9861(20010312)431:3<276::aid-cne1070>3.0.co;2-s

Cited by

See all 342

Metadata

Authors
Tay, T. L., Ronneberger, O., Ryu, S., Nitschke, R., & Driever, W.
Affiliations
University of Freiburg (DE)
Corresponding author
Driever, Wolfgang
Venue
Nature Communications
Published
2011-01-25
Volume
2
Issue
1
Pages
171-171
ISSN
2041-1723 (ISSN-L)
OpenAlex
W2132610577
Cited by
307
References
60
Citations by year
2026: 11 · 2025: 18 · 2024: 17 · 2023: 20 · 2022: 31 · 2021: 25 · 2020: 27 · 2019: 18 · 2018: 15 · 2017: 22 · 2016: 20 · 2015: 19 · 2014: 15 · 2013: 23 · 2012: 19
FWCI
9.66
Type
journal article
Language
en
Open access
Licence
Locations
  • Nature Communications (publishedVersion, cc-by-nc-nd)
  • PubMed Central (publishedVersion, cc-by-nc-nd)
  • PubMed (publishedVersion)
  • RePEc: Research Papers in Economics (submittedVersion)
Funders
Deutsche Forschungsgemeinschaft (SFB 592, SFB780, (EXC 294))
Topics
  • Life Sciences › Biochemistry, Genetics and Molecular Biology › Cell Biology › Zebrafish Biomedical Research Applications
  • Life Sciences › Neuroscience › Cellular and Molecular Neuroscience › Neuroscience and Neuropharmacology Research
  • Life Sciences › Neuroscience › Cellular and Molecular Neuroscience › Neurotransmitter Receptor Influence on Behavior
Keywords
dopaminergic neurons, noradrenergic neurons, zebrafish larvae, ventral diencephalon, neuromodulatory systems

About these checks

Registry, retraction, Cites and statistics results are computed, not judged, with one exception: a printed reference that no index lists is read once by a model before it counts as a citation error. Claims are extracted by a model and kept only when their quote appears verbatim in the text; each cited source is then checked, with a model’s help, for whether it says what the claim relies on. Those verdicts can be wrong — read the claim’s quote and the cited source before relying on one.

Statistics and arithmetic are recomputed, not judged.

Confidence bands are shown only for fields calibrated on our annotated test set. None is calibrated yet, so no band is shown.

What counts as a claim ›How we measure confidence ›How we check this ›

Are you an author, or do you see a problem with this page? Request a review

How to cite

Cite CoChat for the checks on this page, and the paper for its own findings.

This page
CoChat. (2026). Citation check: Comprehensive catecholaminergic projectome analysis reveals single-neuron integration of zebrafish ascending and descending dopaminergic systems. https://app.cochat.ai/papers/10.1038/ncomms1171
The paper
Tay, T. L., Ronneberger, O., Ryu, S., Nitschke, R., & Driever, W. (2011). Comprehensive catecholaminergic projectome analysis reveals single-neuron integration of zebrafish ascending and descending dopaminergic systems. Nature Communications. https://doi.org/10.1038/ncomms1171

Data sources

Bibliographic data: Semantic Scholar, OpenAlex, Crossref.

Contains information from the Semantic Scholar Academic Graph Datasets, made available under the ODC Attribution License (ODC-BY 1.0).

Semantic Scholar’s data is described in: Kinney, R., et al. (2023). The Semantic Scholar Open Data Platform. arXiv:2301.10140.