

The DOI matches its Crossref record; 6 of the 6 references it cites were found in a registry or an index.
Future climate forcing potentially without precedent in the last 420 million years
Abstract
The evolution of Earth’s climate on geological timescales is largely driven by variations in the magnitude of total solar irradiance (TSI) and changes in the greenhouse gas content of the atmosphere. Here we show that the slow ∼50 Wm −2 increase in TSI over the last ∼420 million years (an increase of ∼9 Wm −2 of radiative forcing) was almost completely negated by a long-term decline in atmospheric CO 2 . This was likely due to the silicate weathering-negative feedback and the expansion of land plants that together ensured Earth’s long-term habitability. Humanity’s fossil-fuel use, if unabated, risks taking us, by the middle of the twenty-first century, to values of CO 2 not seen since the early Eocene (50 million years ago). If CO 2 continues to rise further into the twenty-third century, then the associated large increase in radiative forcing, and how the Earth system would respond, would likely be without geological precedent in the last half a billion years.
Overview
The claims and statistics of this paper haven’t been checked yet.
Run the check — free, no account needed. It reads the open-access text and checks the sources it cites.
Integrity signals
Registry
Cites
Statistics
Figures
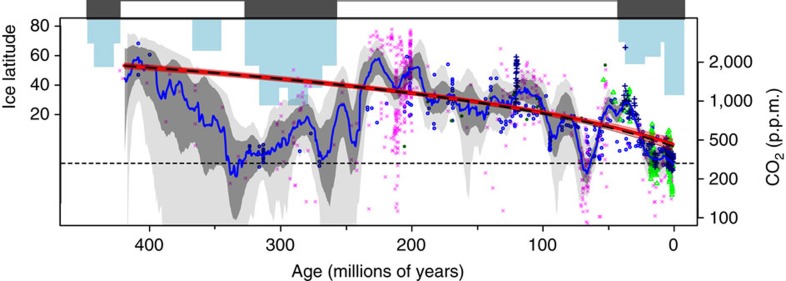
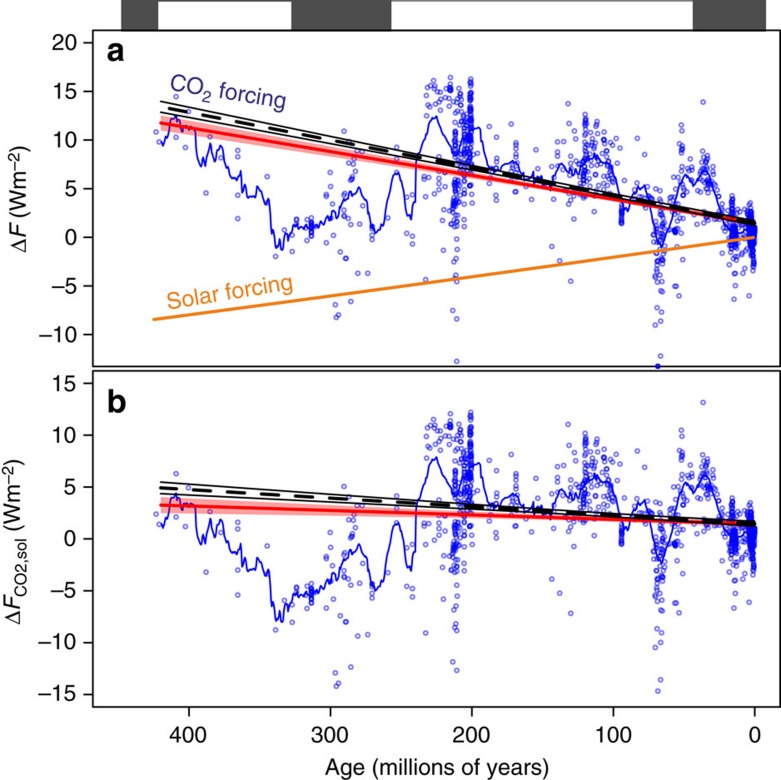
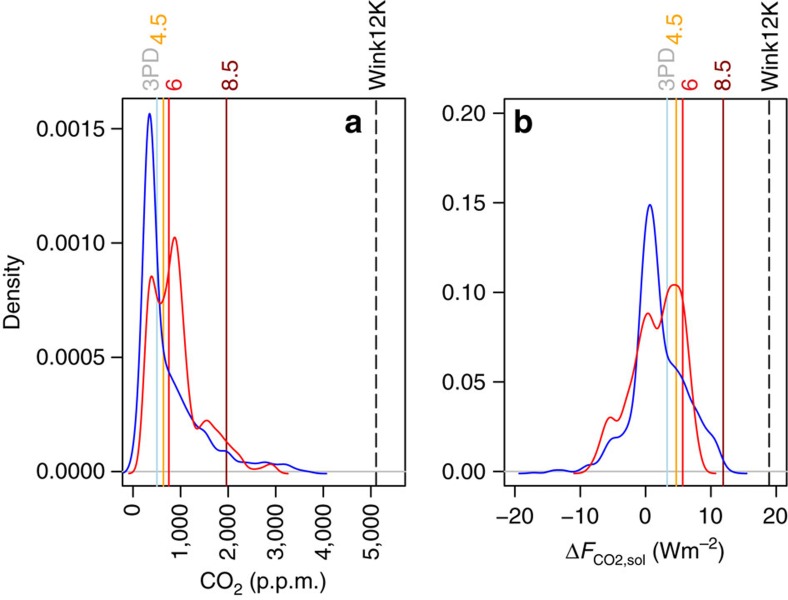
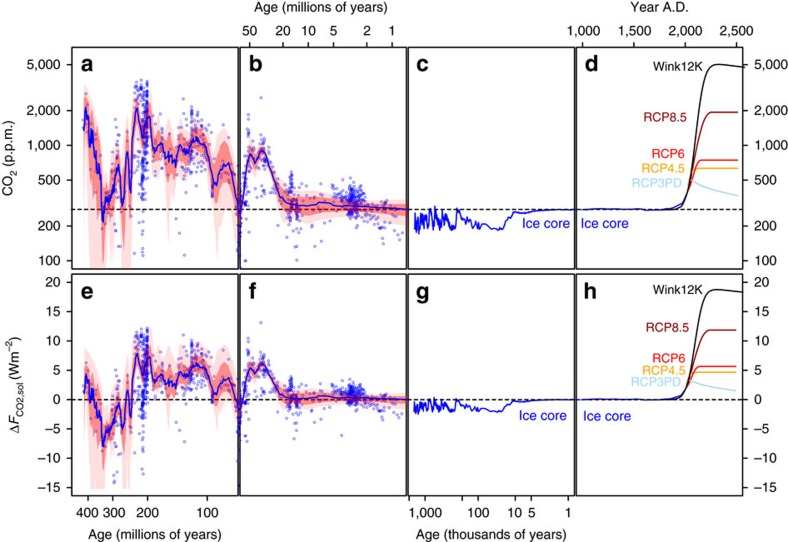
Verification
Claims the paper makes
The claims and statistics of this paper haven’t been checked yet.
Run the check — free, no account needed. It reads the open-access text and checks the sources it cites.
Claims other papers make about this one
Each is checked against this paper’s own text: does it say what the citing paper says it does?
In the citing paper
“A reduction in solar radiation equal to 5 to 15% has been hypothesized to be comparable for Deccan volcanism (without CO2 release) (24, 79–81).”
From Asteroid impact, not volcanism, caused the end-Cretaceous dinosaur extinction (2020) · cites this paper as [80]
In the citing paper
“CO2 concentrations at the end-Cretaceous were set to 560 ppm, within the range of recent pCO2 (partial pressure of carbon dioxide) reconstructions (79, 80).”
From Asteroid impact, not volcanism, caused the end-Cretaceous dinosaur extinction (2020) · cites this paper as [80]
Self-check
Percentages, sums and reported differences re-computed from the paper’s own numbers.
The self-check needs the paper’s full text.
Citations
Cites
A negative feedback mechanism for the long‐term stabilization of Earth's surface temperature
Walker, J. C. G., Hays, P. B., & Kasting, J. F. (1981) · Journal of Geophysical Research: Oceans · doi:10.1029/jc086ic10p09776 · Cited by 2,310
Atmospheric carbon dioxide concentrations over the past 60 million years
Pearson, P. N., & Palmer, M. R. (2000) · Nature · doi:10.1038/35021000 · Cited by 1,771
Solar interior structure and luminosity variations
Gough, D. O. (1981) · Solar Physics · doi:10.1007/bf00151270 · Cited by 798
Phosphate oxygen isotopic evidence for a temperate and biologically active Archaean ocean
Blake, R. E., Chang, S. J., & Lepland, A. (2010) · Nature · doi:10.1038/nature08952 · Cited by 230
Oxygen and hydrogen isotope evidence for a temperate climate 3.42 billion years ago
Hren, M. T., Tice, M. M., & Chamberlain, C. P. (2009) · Nature · doi:10.1038/nature08518 · Cited by 186
Error analysis of CO2 and O2 estimates from the long-term geochemical model GEOCARBSULF
Royer, D. L., Donnadieu, Y., Park, J., Kowalczyk, J., & Godderis, Y. (2014) · American Journal of Science · doi:10.2475/09.2014.01 · Cited by 156
Self-citation
Research works printed but not linked: 74
- Stephens, G. L. et al. The albedo of Earth. Rev. Geophys 53, 141–163 (2015). · DOI
- Jones, P. D., New, M., Parker, D. E., Martin, S. & Rigor, I. G. Surface air temperature and its changes over the past 150 years. Rev Geophys 37, 173–199 (1999). · DOI
- Lacis, A. A., Schmidt, G. A., Rind, D. & Ruedy, R. A. Atmospheric CO2: principal control knob governing Earth’s temperature. Science 330, 356–359 (2010). · DOI
- Kohler, P. et al. What caused Earth’s temperature variations during the last 800,000 years? Data-based evidence on radiative forcing and constraints on climate sensitivity. Quart. Sci. Rev. 29, 129–145 (2010). · DOI
- Connelly, J. N. et al. The absolute chronology and thermal processing of solids in the solar protoplanetary disk. Science 338, 651–655 (2012). · DOI
- Rohling, E. J. et al. Making sense of palaeoclimate sensitivity. Nature 491, 683–691 (2012). · DOI
- Roe, G. Feedbacks timescales, and seeing red. Annu. Rev. Earth Planet. Sci. 37, 93–115 (2009). · DOI
- Hansen, J. et al. Target atmospheric CO2: where should humanity aim? Open Atmos. Sci. J. 2, 217–231 (2008). · DOI
- Royer, D. L., Berner, R. A. & Park, J. Climate sensitivity constrained by CO2 concentrations over the past 420 million years. Nature 446, 530–532 (2007). · DOI
- Martínez-Botí, M. A. et al. Plio-Pleistocene climate sensitivity evaluated using high-resolution CO2 records. Nature 518, 49–54 (2015). · DOI
- Grossman, E. L. in Reconstructing Earth’s Deep-time Climate: The State of the Art in 2012: Presented as a Paleontological Society Shor t Course at the Annual Meeting of the Geological Society of America, Charlotte, North Carolina, November 3, 2012, Vol. 18 (eds Ivany, L. C. & Huber, B. T.) 39–67 (The Paleontological Society, 2012).
- Schwartzman, D. W. & Volk, T. Biotic enhancement of weathering and the habitability of Earth. Nature 340, 457–459 (1989). · DOI
- Byrne, B. & Goldblatt, C. Radiative forcing at high concentrations of well-mixed greenhouse gases. Geophys. Res. Lett. 41, 152–160 (2013). · DOI
- Beerling, D. J., Fox, A., Stevenson, D. S. & Valdes, P. J. Enhanced chemistry-climate feedbacks in past greenhouse worlds. Proc. Natl Acad. Sci. USA 108, 9770–9775 (2011). · DOI · Paper page
- Anagnostou, E. et al. Changing atmospheric CO2 concentration was the primary driver of early Cenozoic climate. Nature 533, 380–384 (2016). · DOI
- Bartdorff, O., Wallmann, K., Latif, M. & Semenov, V. Phanerozoic evolution of atmospheric methane. Global Biogeochem. Cycles 22, GB1008 (2008). · DOI
- Nguyen, K. D. T. et al. Upper temperature limits of tropical marine ectotherms: global warming implications. PLoS ONE 6, e29340 (2011). · DOI · Paper page
- Raup, D. M. & Sepkoski, J. J. Jr Periodicity of extinctions in the geologic past. Proc. Natl Acad. Sci. USA 81, 801–805 (1984). · DOI
- Crowley, T. J. in Tectonic Boundary Conditions for Climatic Reconstructions (eds Crowley, J. L. & Burke, K.) 3–17 (Oxford University Press, 1998). · DOI
- Came, R. E. et al. Coupling of surface temperatures and atmospheric CO2 concentrations during the Palaeozoic era. Nature 449, 198–201 (2007). · DOI
- Gothmann, A. M. et al. Fossil corals as an archive of secular variations in seawater chemistry since the Mesozoic. Geochim. Cosmochim. Acta 160, 188–208 (2015). · DOI
- Cummins, R. C., Finnegan, S., Fike, D. A., Eiler, J. M. & Fischer, W. W. Carbonate clumped isotope constraints on Silurian ocean temperature and seawater δ18O. Geochim. Cosmochim. Acta 140, 241–258 (2014). · DOI · Paper page
- Veizer, J. & Prokoph, A. Temperatures and oxygen isotopic composition of the Phanerzoic oceans. Earth-Sci. Rev. 146, 92–104 (2015). · DOI
- Royer, D. L. et al. CO2 as a primary driver of Phanerozoic climate. GSA Today 14, 4–10 (2004). · DOI
- Breecker, D. O., Sharp, Z. D. & McFadden, L. D. Atmospheric CO2 concentrations during ancient greenhouse climates were similar to those predicted for A.D. 2100. Proc. Natl Acad. Sci. USA 107, 576–580 (2010). · DOI
- Chandler, R. & Scott, M. Statistical Methods for Trend Detection and Analysis in the Environmental Sciences Wiley (2011). · DOI
- Crowley, T. J. & Berner, R. A. CO2 and climate change. Science 292, 870–872 (2001). · DOI
- Royer, D. L. CO2-forced climate thresholds during the Phanerozoic. Geochim. Cosmochim. Acta 70, 5665–5675 (2006). · DOI
- West, A. J., Galy, A. & Bickle, M. Tectonic and climatic controls on silicate weathering. Earth Planet. Sci. Lett. 235, 211–228 (2005). · DOI
- Foley, B. J. The role of plate tectonic-climate coupling and exposed land area in the development of habitable climates on rocky planets. Astrophys. J. 812, 1–23 (2015). · DOI
- Berner, R. A. & Kothavala, Z. GEOCARB III: a revised model of atmospheric CO2 over Phanerozoic time. Am. J. Sci. 301, 182–204 (2001). · DOI · Paper page
- McKanzie, N. R. et al. Continental arc volcanism the prinicpal driver of icehouse-greenhouse variability. Science 352, 444–447 (2016). · DOI
- Berner, R. A. The rise of plants and their effect on weathering and atmospheric CO2 . Science 276, 544–546 (1997). · DOI · Paper page
- Meinshausen, M. et al. The RCP greenhouse gas concentrations and their extensions from 1765 to 2300. Clim. Change 109, 213–241 (2011). · DOI
- Rogner, H. H.- et al. in Global Energy Assessment—Toward a Sustainable Future. (eds Johansson, T. B. et al.) 423–512 (Cambridge University Press and the International Institute for Applied Systems Analysis, 2012).
- Winklemann, R., Levermann, A., Ridgwell, A. & Caldeira, K. Combustion of available fossil fuel resources sufficient to eliminate the Antarctic Ice Sheet. Sci. Adv. e1500589 (2015). · DOI
- Lenton, T. M. et al. Millennial timescale carbon cycle and climate change in an efficient Earth system model. Clim. Dyn. 26, 687–711 (2006). · DOI
- Zalasiewicz, J., Williams, M., Haywood, A. & Ellis, M. The Anthropocene: a new epoch of geological time? Philos. Trans. R. Soc. A 369, 835–841 (2011). · DOI · Paper page
- Zeebe, R. M., Ridgwell, A. & Zachos, J. C. Anthropogenic carbon release rate unprecedented during the past 66 million years. Nat. Geosci. 9, 325–329 (2016). · DOI
- Yapp, C. J. & Poths, H. Carbon isotopes in continental weathering environments and variations in ancient atmospheric CO2 pressure. Earth Planet. Sci. Lett. 137, 71–82 (1996). · DOI
- Yapp, C. J. Fe(CO3)OH in goethite from a mid-latitude North American Oxisol: estimate of atmospheric CO2 concentration in the Early Eocene ‘climatic optimum’. Geochim. Cosmochim. Acta 68, 935–947 (2004). · DOI
- Tabor, N. J. & Yapp, C. J. Coexisting goethite and gibbsite from a high-paleolatitude (55° N) Late Paleocene laterite: concentration and 13C/12C ratios of occluded CO2 and associated organic matter. Geochim. Cosmochim. Acta 69, 5495–5510 (2005). · DOI
- Feng, W. & Yapp, C. J. Paleoenvironmental implications of concentration and 13C/12C ratios of Fe(CO3)OH in goethite from a mid-latitude Cenomanian laterite in southwestern Minnesota. Geochim. Cosmochim. Acta 73, 2559–2580 (2009). · DOI
- Rustad, J. R. & Zarzycki, P. Calculation of site-specific carbon-isotope fractionation in pedogenic oxide minerals. Proc. Natl Acad. Sci. USA 105, 10297–10301 (2008). · DOI
- Tripati, A. K., Roberts, C. D. & Eagle, R. A. Coupling of CO2 and ice sheet stability over major climate transitions of the last 20 million years. Science 326, 1394–1397 (2009). · DOI
- Allen, K. A. & Hönisch, B. The planktic foraminiferal B/Ca proxy for seawater carbonate chemistry: a critical evaluation. Earth Planet. Sci. Lett. 345–348, 203–211 (2012). · DOI
- Lowenstein, T. K. & Demicco, R. V. Elevated Eocene atmospheric CO2 and its subsequent decline. Science 313, 1928 (2006). · DOI
- Pagani, M., Arthur, M. A. & Freeman, K. H. Miocene evolution of atmospheric carbon dioxide. Paleoceanography 14, 273–292 (1999). · DOI
- Pagani, M., Freeman, K. H. & Arthur, M. A. Late Miocene atmospheric CO2 concentrations and the expansion of C4 grasses. Science 285, 876–879 (1999). · DOI
- Pagani, M., Zachos, J. C., Freeman, K. H., Tipple, B. & Bohaty, S. Marked decline in atmospheric carbon dioxide concentrations during the Paleogene. Science 309, 600–603 (2005). · DOI
- Pagani, M. et al. The role of carbon dioxide during the onset of Antarctic glaciation. Science 334, 1261–1264 (2011). · DOI
- Zhang, Y. G., Pagani, M., Liu, Z., Bohaty, S. M. & DeConto, R. A 40-million-year history of atmospheric CO2 . Philos. Trans. R. Soc. A 371, 20130096 (2013). · DOI
- Fletcher, B. J., Brentnall, S. J., Anderson, C. W., Berner, R. A. & Beerling, D. J. Atmospheric carbon dioxide linked with Mesozoic and early Cenozoic climate change. Nat. Geosci. 1, 43–48 (2008). · DOI
- Tipple, B. J., Meyers, S. R. & Pagani, M. Carbon isotope ratio of Cenozoic CO2: a comparative evaluation of available geochemical proxies. Paleoceanography 25, PA3202 (2010). · DOI
- McElwain, J. C. & Chaloner, W. G. The fossil cuticle as a skeletal record of environmental change. Palaios 11, 376–388 (1996). · DOI
- McElwain, J. C. Do fossil plants signal palaeoatmospheric CO2 concentration in the geological past? Philos. Trans. R. Soc. Lond. B 353, 83–96 (1998). · DOI
- Beerling, D. J. & Royer, D. L. Fossil plants as indicators of the Phanerozoic global carbon cycle. Annu. Rev. Earth Planet. Sci. 30, 527–556 (2002). · DOI
- Retallack, G. J. Greenhouse crises of the past 300 million years. Geol. Soc. Am. Bull. 121, 1441–1455 (2009). · DOI
- Tralau, H. Evolutionary trends in the genus Ginkgo. Lethaia 1, 63–101 (1968). · DOI
- Vörding, B. & Kerp, H. Stomatal indices of Peltaspermum martinsii (Pteridospermopsida, Peltaspermaceae) from the Upper Permian Bletterbach Gorge and their possible applicability as CO2 proxies. Neues Jahrb. Geol. Paläontol. 248, 245–255 (2008). · DOI
- Breecker, D. O., Sharp, Z. D. & McFadden, L. D. Seasonal bias in the formation and stable isotopic composition of pedogenic carbonate in modern soils from central New Mexico, USA. Geol. Soc. Am. Bull 121, 630–640 (2009). · DOI · Paper page
- Montañez, I. P. Modern soil system constraints on reconstructing deep-time atmospheric CO2 . Geochim. Cosmochim. Acta 101, 57–75 (2013). · DOI
- Royer, D. L. Fossil soils constrain ancient climate sensitivity. Proc. Natl Acad. Sci. USA 107, 517–518 (2010). · DOI
- Retallack, G. J. Refining a pedogenic-carbonate CO2 paleobarometer to quantify a middle Miocene greenhouse spike. Paleogeogr. Paleoclimatol. Paleoecol. 281, 57–65 (2009). · DOI
- Cotton, J. M. & Sheldon, N. D. New constraints on using paleosols to reconstruct atmospheric pCO2 . Geol. Soc. Am. Bull 124, 1411–1423 (2012). · DOI
- Ekart, D. D., Cerling, T. E., Montañez, I. P. & Tabor, N. J. A 400 million year carbon isotope record of pedogenic carbonate: implications for paleoatmospheric carbon dioxide. Am. J. Sci. 299, 805–827 (1999). · DOI
- Tabor, N. J., Yapp, C. J. & Montañez, I. P. Goethite, calcite, and organic matter from Permian and Triassic soils: Carbon isotopes and CO2 concentrations. Geochim. Cosmochim. Acta 68, 1503–1517 (2004). · DOI
- Montañez, I. P. et al. CO2-forced climate and vegetation instability during late Paleozoic deglaciation. Science 315, 87–91 (2007). · DOI
- Doria, G. et al. Declining atmospheric CO2 during the late Middle Eocene climate transition. Am. J. Sci. 311, 63–75 (2011). · DOI
- Beerling, D. J., Fox, A. & Anderson, C. W. Quantitative uncertainty analyses of ancient atmospheric CO2 estimates from fossil leaves. Am. J. Sci. 309, 775–787 (2009). · DOI
- Breecker, D. O. Quantifying and understanding the uncertainty of atmospheric CO2 concentrations determined from calcic paleosols. Geochem. Geophys. Geosyst. 14, 3210–3220 (2013). · DOI
- Gradstein F. M., Ogg J. G., Schmitz M. D., Ogg G. M. (eds). The Geologic Time Scale 2012 (Elsevier, 2012). · DOI
- Schaller, M. F., Wright, J. D., Kent, D. V. & Olsen, P. E. Rapid emplacement of the Central Atlantic Magmatic Province as a net sink for CO2 . Earth Planet. Sci. Lett. 323–324, 27–39 (2012). · DOI
- Bereiter, B. et al. Revision of the EPICA Dome C CO2 record from 800 to 600 kyr before present. Geophys. Res. Lett. 42, 542–549 (2015). · DOI
Cited by
Report of the Lancet Commission on the Value of Death: Bringing death back into life
Sallnow, L., Smith, R., Ahmedzai, S. H., Bhadelia, A., Chamberlain, C., Cong, Y., Doble, B., Dullie, L., Durie, R., Finkelstein, E. A., et al. (2022) · The Lancet · doi:10.1016/s0140-6736(21)02314-x · Cited by 807
A high resolution summary of Cambrian to early Triassic marine invertebrate biodiversity
Fan, J.-X., Shen, S.-Z., Erwin, D. H., Sadler, P. M., MacLeod, N., Cheng, Q.-M., Hou, X.-D., Yang, J., Wang, X.-D., Wang, Y., et al. (2020) · Science · doi:10.1126/science.aax4953 · Cited by 583
Catling, D. C., & Zahnle, K. J. (2020) · Science Advances · doi:10.1126/sciadv.aax1420 · Cited by 568
Arc-continent collisions in the tropics set Earth’s climate state
Macdonald, F. A., Swanson-Hysell, N. L., Park, Y., Lisiecki, L., & Jagoutz, O. (2019) · Science · doi:10.1126/science.aav5300 · Cited by 279
Asteroid impact, not volcanism, caused the end-Cretaceous dinosaur extinction
Chiarenza, A. A., Farnsworth, A., Mannion, P. D., Lunt, D. J., Valdes, P. J., Morgan, J. V., & Allison, P. A. (2020) · Proceedings of the National Academy of Sciences · doi:10.1073/pnas.2006087117 · Cited by 228
Self-citation
Metadata
- Authors
- Foster, G. L., Royer, D. L., & Lunt, D. J.
- Venue
- Nature Communications
- Published
- 2017-04-04
- Volume
- 8
- Issue
- 1
- ISSN
- 2041-1723
- PMC
- PMC5382278
- Cited by
- 774
- References
- 6
- Language
- en
About these checks
Registry, retraction, Cites and statistics results are computed, not judged, with one exception: a printed reference that no index lists is read once by a model before it counts as a citation error. Claims are extracted by a model and kept only when their quote appears verbatim in the text; each cited source is then checked, with a model’s help, for whether it says what the claim relies on. Those verdicts can be wrong — read the claim’s quote and the cited source before relying on one.
Statistics and arithmetic are recomputed, not judged.
Confidence bands are shown only for fields calibrated on our annotated test set. None is calibrated yet, so no band is shown.
What counts as a claim ›How we measure confidence ›How we check this ›
Are you an author, or do you see a problem with this page? Request a review
How to cite
Cite CoChat for the checks on this page, and the paper for its own findings.
- This page
- CoChat. (2026). Citation check: Future climate forcing potentially without precedent in the last 420 million years. https://app.cochat.ai/papers/10.1038/ncomms14845
- The paper
- Foster, G. L., Royer, D. L., & Lunt, D. J. (2017). Future climate forcing potentially without precedent in the last 420 million years. Nature Communications. https://doi.org/10.1038/ncomms14845
