

The DOI matches its Crossref record; 50 of the 51 references it cites were found in a registry or an index.
Graphene-based carbon-layered electrode array technology for neural imaging and optogenetic applications
Open accessAbstract
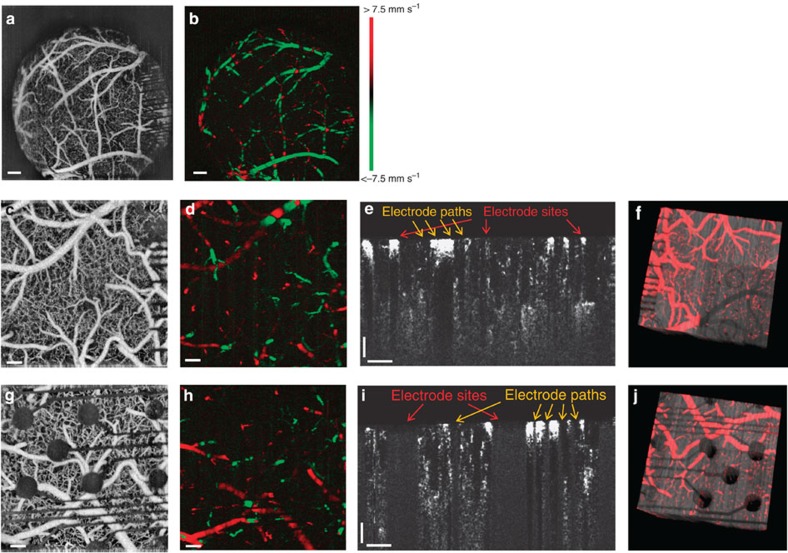
Neural micro-electrode arrays that are transparent over a broad wavelength spectrum from ultraviolet to infrared could allow for simultaneous electrophysiology and optical imaging, as well as optogenetic modulation of the underlying brain tissue. The long-term biocompatibility and reliability of neural micro-electrodes also require their mechanical flexibility and compliance with soft tissues. Here we present a graphene-based, carbon-layered electrode array (CLEAR) device, which can be implanted on the brain surface in rodents for high-resolution neurophysiological recording. We characterize optical transparency of the device at >90% transmission over the ultraviolet to infrared spectrum and demonstrate its utility through optical interface experiments that use this broad spectrum transparency. These include optogenetic activation of focal cortical areas directly beneath electrodes, in vivo imaging of the cortical vasculature via fluorescence microscopy and 3D optical coherence tomography. This study demonstrates an array of interfacing abilities of the CLEAR device and its utility for neural applications.
Overview
The claims and statistics of this paper haven’t been checked yet.
Free: it reads the open-access text and checks the first 5 claims that cite a source we can check. Create a free account to check every claim.
Integrity signals
Registry
Cites
Statistics
Figures
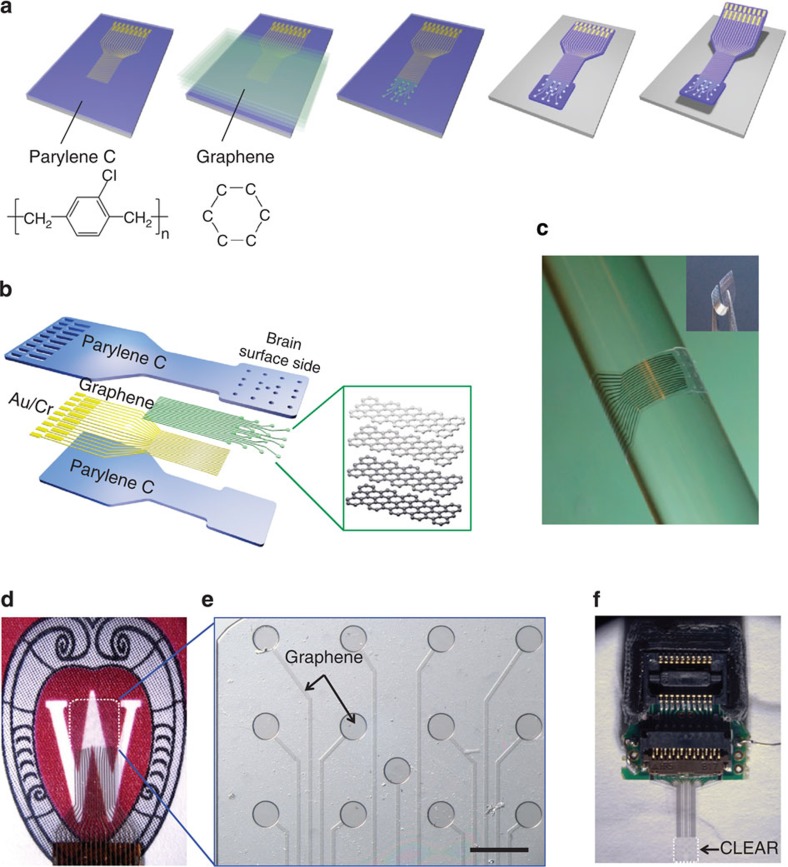
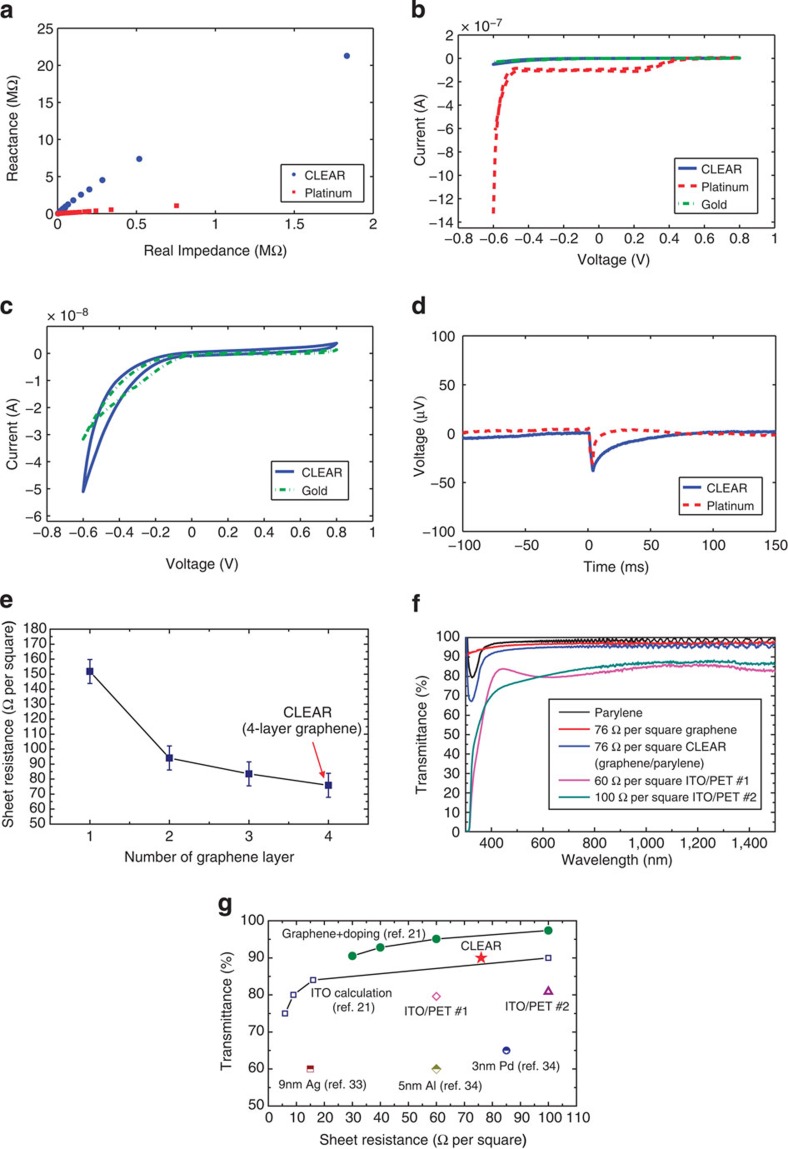

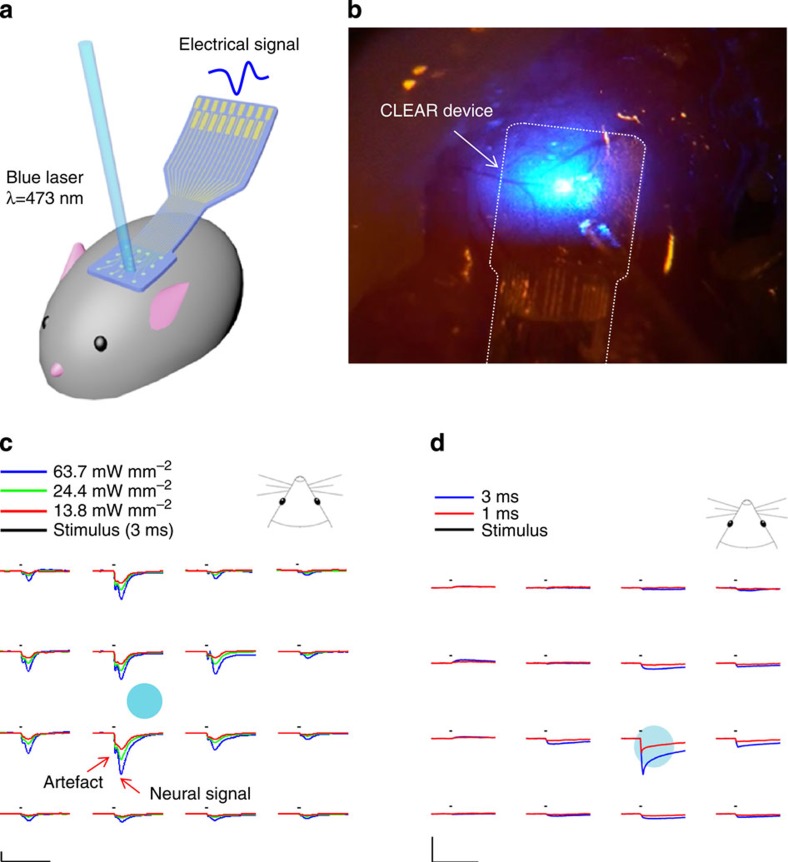
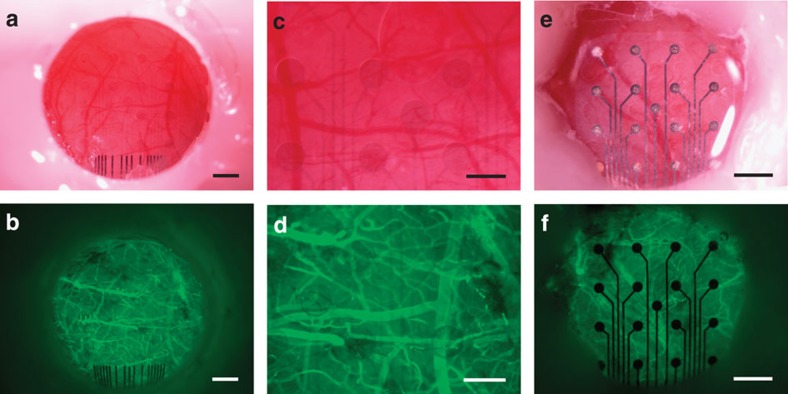
Verification
Claims the paper makes
The claims and statistics of this paper haven’t been checked yet.
Free: it reads the open-access text and checks the first 5 claims that cite a source we can check. Create a free account to check every claim.
Claims other papers make about this one
Each is checked against this paper’s own text: does it say what the citing paper says it does?
The cited source says what the claim attributes to it.
In the citing paper
“Recent advancements in soft and nanomaterials have opened up more options for flexible recording electrodes, like conductive polymers (e.g., PEDOT)[302,312] and nanomaterial composites (metal-based, CNT, graphene)[313–317].”
From Flexible Electronics and Devices as Human–Machine Interfaces for Medical Robotics (2022) · cites this paper as [316]
Experimental — accuracy not yet measured
Self-check
Percentages, sums and reported differences re-computed from the paper’s own numbers.
The self-check needs the paper’s full text.
Citations
Cites
Geim, A. K., & Novoselov, K. S. (2007) · Nature Materials · doi:10.1038/nmat1849 · Cited by 39,979
Measurement of the Elastic Properties and Intrinsic Strength of Monolayer Graphene
Lee, C., Wei, X., Kysar, J. W., & Hone, J. (2008) · Science · doi:10.1126/science.1157996 · Cited by 20,847
Grätzel, M. (2001) · Nature · doi:10.1038/35104607 · Cited by 12,687
Large-scale pattern growth of graphene films for stretchable transparent electrodes
Kim, K. S., Zhao, Y., Jang, H., Lee, S. Y., Kim, J. M., Kim, K. S., Ahn, J.-H., Kim, P., Choi, J.-Y., & Hong, B. H. (2009) · Nature · doi:10.1038/nature07719 · Cited by 10,452
Roll-to-roll production of 30-inch graphene films for transparent electrodes
Bae, S., Kim, H., Lee, Y., Xu, X., Park, J.-S., Zheng, Y., Balakrishnan, J., Lei, T., Ri Kim, H., Song, Y. I., et al. (2010) · Nature Nanotechnology · doi:10.1038/nnano.2010.132 · Cited by 8,136
Graphene photonics and optoelectronics
Bonaccorso, F., Sun, Z., Hasan, T., & Ferrari, A. C. (2010) · Nature Photonics · doi:10.1038/nphoton.2010.186 · Cited by 7,726
Transfer of Large-Area Graphene Films for High-Performance Transparent Conductive Electrodes
Li, X., Zhu, Y., Cai, W., Borysiak, M., Han, B., Chen, D., Piner, R. D., Colombo, L., & Ruoff, R. S. (2009) · Nano Letters · doi:10.1021/nl902623y · Cited by 3,081
Mechanically Strong, Electrically Conductive, and Biocompatible Graphene Paper
Chen, H., Müller, M. B., Gilmore, K. J., Wallace, G. G., & Li, D. (2008) · Advanced Materials · doi:10.1002/adma.200800757 · Cited by 2,040
The development and application of optogenetics
Fenno, L., Yizhar, O., & Deisseroth, K. (2011) · Annual Review of Neuroscience · doi:10.1146/annurev-neuro-061010-113817 · Cited by 1,822
A brain–computer interface using electrocorticographic signals in humans
Leuthardt, E. C., Schalk, G., Wolpaw, J. R., Ojemann, J. G., & Moran, D. W. (2004) · Journal of Neural Engineering · doi:10.1088/1741-2560/1/2/001 · Cited by 1,188
Cited by
The rise of plastic bioelectronics
Someya, T., Bao, Z., & Malliaras, G. G. (2016) · Nature · doi:10.1038/nature21004 · Cited by 1,884
Lee, H., Choi, T. K., Lee, Y. B., Cho, H. R., Ghaffari, R., Wang, L., Choi, H. J., Chung, T. D., Lu, N., Hyeon, T., et al. (2016) · Nature Nanotechnology · doi:10.1038/nnano.2016.38 · Cited by 1,802
Yang, J. C., Mun, J., Kwon, S. Y., Park, S., Bao, Z., & Park, S. (2019) · Advanced Materials · doi:10.1002/adma.201904765 · Cited by 1,641
A review on mechanics and mechanical properties of 2D materials—Graphene and beyond
Akinwande, D., Brennan, C. J., Bunch, J. S., Egberts, P., Felts, J. R., Gao, H., Huang, R., Kim, J.-S., Li, T., Li, Y., et al. (2017) · Extreme Mechanics Letters · doi:10.1016/j.eml.2017.01.008 · Cited by 1,342
Electronic dura mater for long-term multimodal neural interfaces
Minev, I. R., Musienko, P., Hirsch, A., Barraud, Q., Wenger, N., Moraud, E. M., Gandar, J., Capogrosso, M., Milekovic, T., Asboth, L., et al. (2015) · Science · doi:10.1126/science.1260318 · Cited by 1,082
Metadata
- Authors
- Park, D.-W., Schendel, A. A., Mikael, S., Brodnick, S. K., Richner, T. J., Ness, J. P., Hayat, M. R., Atry, F., Frye, S. T., Pashaie, R., Thongpang, S., Ma, Z., & Williams, J. C.
- Affiliations
- University of Wisconsin–Madison (US)
- University of Wisconsin–Milwaukee (US)
- Mahidol University (TH)
- Corresponding author
- Ma, Zhenqiang
- Williams, Justin C.
- ORCID
- Venue
- Nature Communications
- Published
- 2014-10-20
- Volume
- 5
- Issue
- 1
- Pages
- 5258-5258
- ISSN
- 2041-1723 (ISSN-L)
- PMC
- PMC4218963
- OpenAlex
- W2044169471
- Semantic Scholar
- c6809f059fc4af9861de1575d14b18959185a6ae
- Cited by
- 565
- References
- 51
- Citations by year
- 2026: 18 · 2025: 24 · 2024: 41 · 2023: 55 · 2022: 53 · 2021: 63 · 2020: 57 · 2019: 53 · 2018: 99 · 2017: 51 · 2016: 35 · 2015: 16
- FWCI
- 15.53
- Type
- journal article
- Language
- en
- Open access
- hybrid
- doi.org
- Licence
- cc-by
- creativecommons.org/licenses/by/4.0 (tdm)
- creativecommons.org/licenses/by/4.0 (vor)
- Locations
- Nature Communications (publishedVersion, cc-by)
- PubMed Central (publishedVersion, cc-by)
- PubMed (publishedVersion)
- RePEc: Research Papers in Economics (submittedVersion)
- Funders
- Henan Institute of Science and Technology
- National Institutes of Health
- Defense Advanced Research Projects Agency (N66001-11-1-4013, N66001-12-C-4025)
- Advanced Research Projects Agency
- Office of Naval Research (N000140910803, N00014)
- National Institute of Biomedical Imaging and Bioengineering (T32EB011434, R01EB000856, R01EB009103)
- Topics
- Life Sciences › Neuroscience › Cellular and Molecular Neuroscience › Neuroscience and Neural Engineering
- Social Sciences › Education › Undergraduate Neuroscience Education and Research
- Physical Sciences › Chemistry › Analytical Chemistry › Electrochemical sensors and biosensors
- Keywords
- graphene, optogenetics, neuroimaging, optical transparency, fluorescence microscopy, optical coherence tomography, electrophysiology, biocompatibility, flexible electrodes
- MeSH terms
- Animals, Biocompatible Materials, Carbon, Electrodes, Equipment Design, Female, Graphite, Male, Microscopy, Fluorescence, Silicon, Artifacts, Rats, Sprague-Dawley, Imaging, Three-Dimensional, Tomography, Optical Coherence, Mice, Rats, Optics and Photonics, Neuroimaging, Optogenetics
About these checks
Registry, retraction, Cites and statistics results are computed, not judged, with one exception: a printed reference that no index lists is read once by a model before it counts as a citation error. Claims are extracted by a model and kept only when their quote appears verbatim in the text; each cited source is then checked, with a model’s help, for whether it says what the claim relies on. Those verdicts can be wrong — read the claim’s quote and the cited source before relying on one.
Statistics and arithmetic are recomputed, not judged.
Confidence bands are shown only for fields calibrated on our annotated test set. None is calibrated yet, so no band is shown.
What counts as a claim ›How we measure confidence ›How we check this ›
Are you an author, or do you see a problem with this page? Request a review
How to cite
Cite CoChat for the checks on this page, and the paper for its own findings.
- This page
- CoChat. (2026). Citation check: Graphene-based carbon-layered electrode array technology for neural imaging and optogenetic applications. https://app.cochat.ai/papers/10.1038/ncomms6258
- The paper
- Park, D.-W., Schendel, A. A., Mikael, S., Brodnick, S. K., Richner, T. J., Ness, J. P., Hayat, M. R., Atry, F., Frye, S. T., Pashaie, R., Thongpang, S., Ma, Z., & Williams, J. C. (2014). Graphene-based carbon-layered electrode array technology for neural imaging and optogenetic applications. Nature Communications. https://doi.org/10.1038/ncomms6258
Data sources
Bibliographic data: Semantic Scholar, OpenAlex, Crossref.
Contains information from the Semantic Scholar Academic Graph Datasets, made available under the ODC Attribution License (ODC-BY 1.0).
Semantic Scholar’s data is described in: Kinney, R., et al. (2023). The Semantic Scholar Open Data Platform. arXiv:2301.10140.
