

The DOI matches its Crossref record; 11 of the 11 references it cites were found in a registry or an index.
Large-scale recent expansion of European patrilineages shown by population resequencing
Abstract
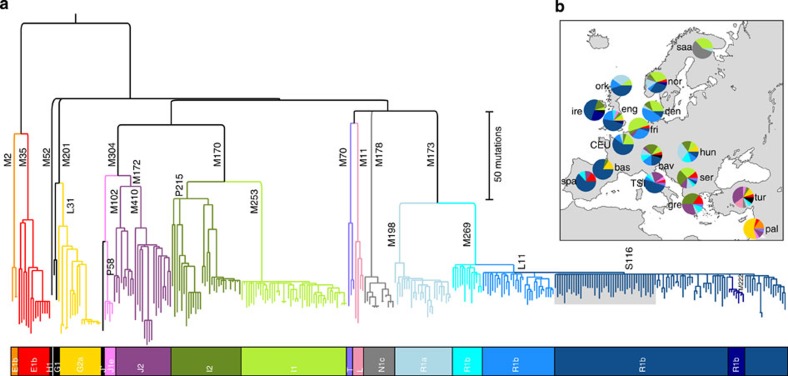
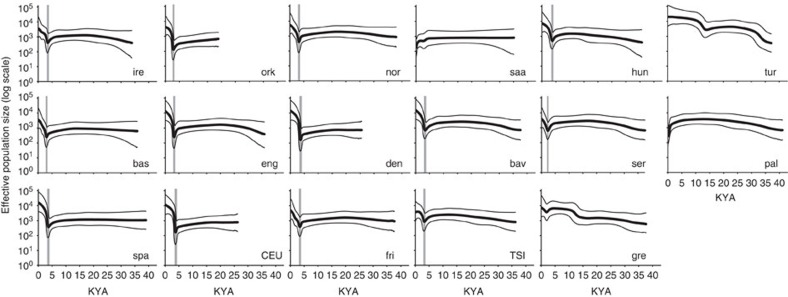
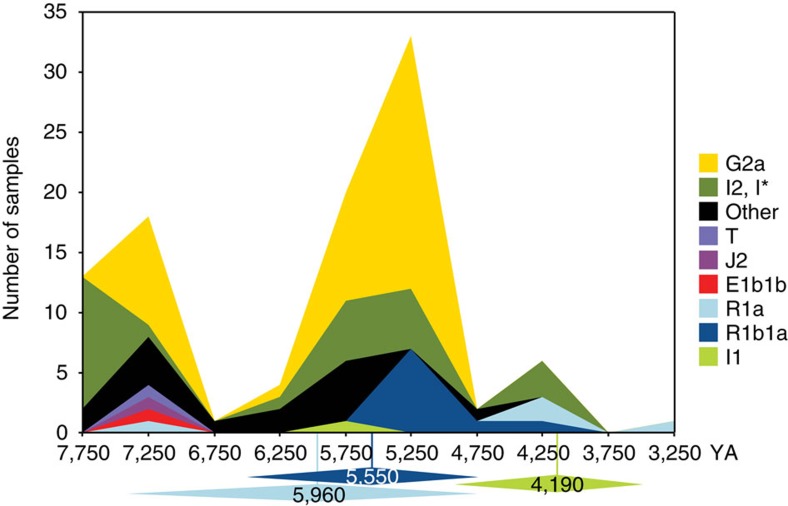
The proportion of Europeans descending from Neolithic farmers ∼10 thousand years ago (KYA) or Palaeolithic hunter-gatherers has been much debated. The male-specific region of the Y chromosome (MSY) has been widely applied to this question, but unbiased estimates of diversity and time depth have been lacking. Here we show that European patrilineages underwent a recent continent-wide expansion. Resequencing of 3.7 Mb of MSY DNA in 334 males, comprising 17 European and Middle Eastern populations, defines a phylogeny containing 5,996 single-nucleotide polymorphisms. Dating indicates that three major lineages (I1, R1a and R1b), accounting for 64% of our sample, have very recent coalescent times, ranging between 3.5 and 7.3 KYA. A continuous swathe of 13/17 populations share similar histories featuring a demographic expansion starting ∼2.1–4.2 KYA. Our results are compatible with ancient MSY DNA data, and contrast with data on mitochondrial DNA, indicating a widespread male-specific phenomenon that focuses interest on the social structure of Bronze Age Europe.
Overview
The claims and statistics of this paper haven’t been checked yet.
Run the check — free, no account needed. It reads the open-access text and checks the sources it cites.
Integrity signals
Registry
Cites
Statistics
Figures
Verification
Claims the paper makes
The claims and statistics of this paper haven’t been checked yet.
Run the check — free, no account needed. It reads the open-access text and checks the sources it cites.
Claims other papers make about this one
Each is checked against this paper’s own text: does it say what the citing paper says it does?
In the citing paper
“Using a slightly higher mutation rate (1.0 × 10⁻⁹ mutations/bp/year), Batini et al.3 estimated more recent dates for this bottleneck (ranging from 4200 to 2100 BP for the Near Eastern and European populations)3.”
From Patrilineal segmentary systems provide a peaceful explanation for the post-Neolithic Y-chromosome bottleneck (2024) · cites this paper as Batini et al. [3]
In the citing paper
“Similarly, Batini et al. analysed genetic diversity from 17 populations from Europe and the Near East, and showed similar Y chromosome pattern3,4.”
From Patrilineal segmentary systems provide a peaceful explanation for the post-Neolithic Y-chromosome bottleneck (2024) · cites this paper as Batini et al. [3]
In the citing paper
“Using a slightly higher mutation rate, Batini et al.3 dated this bottleneck between 4200 and 2100 BP (i.e. between 140 and 70 generations ago) for Near Eastern and European populations3.”
From Patrilineal segmentary systems provide a peaceful explanation for the post-Neolithic Y-chromosome bottleneck (2024) · cites this paper as [3]
In the citing paper
“Scenario 4a produced a Y chromosome bottleneck that reached its minimum 40 generations ago (i.e. around 1000 years ago using a generation time of 25 years), while the scenarios 4b and 4c produced a bottleneck around 130 and 110 generations ago (i.e. 3250 and 2750 years ago), respectively, which is more consistent with the timing of bottlenecks inferred from real data by Karmin et al.1 and Batini”
From Patrilineal segmentary systems provide a peaceful explanation for the post-Neolithic Y-chromosome bottleneck (2024) · cites this paper as [3]
Self-check
Percentages, sums and reported differences re-computed from the paper’s own numbers.
The self-check needs the paper’s full text.
Citations
Cites
Integrating common and rare genetic variation in diverse human populations
The International HapMap 3 Consortium (2010) · Nature · doi:10.1038/nature09298 · Cited by 3,026
Massive migration from the steppe was a source for Indo-European languages in Europe
Haak, W., Lazaridis, I., Patterson, N., Rohland, N., Mallick, S., Llamas, B., Brandt, G., Nordenfelt, S., Harney, E., Stewardson, K., et al. (2015) · Nature · doi:10.1038/nature14317 · Cited by 1,940
Genes mirror geography within Europe
Novembre, J., Johnson, T., Bryc, K., Kutalik, Z., Boyko, A. R., Auton, A., Indap, A., King, K. S., Bergmann, S., Nelson, M. R., et al. (2008) · Nature · doi:10.1038/nature07331 · Cited by 1,479
Ancient human genomes suggest three ancestral populations for present-day Europeans
Lazaridis, I., Patterson, N., Mittnik, A., Renaud, G., Mallick, S., Kirsanow, K., Sudmant, P. H., Schraiber, J. G., Castellano, S., Lipson, M., et al. (2014) · Nature · doi:10.1038/nature13673 · Cited by 1,357
Self-citationHuman Genome Sequencing Using Unchained Base Reads on Self-Assembling DNA Nanoarrays
Drmanac, R., Sparks, A. B., Callow, M. J., Halpern, A. L., Burns, N. L., Kermani, B. G., Carnevali, P., Nazarenko, I., Nilsen, G. B., Yeung, G., et al. (2010) · Science · doi:10.1126/science.1181498 · Cited by 1,212
Genome sequence of a 45,000-year-old modern human from western Siberia
Fu, Q., Li, H., Moorjani, P., Jay, F., Slepchenko, S. M., Bondarev, A. A., Johnson, P. L. F., Aximu-Petri, A., Prüfer, K., de Filippo, C., et al. (2014) · Nature · doi:10.1038/nature13810 · Cited by 1,023
The Genetic Legacy of the Mongols
Zerjal, T., Xue, Y., Bertorelle, G., Wells, R. S., Bao, W., Zhu, S., Qamar, R., Ayub, Q., Mohyuddin, A., Fu, S., et al. (2003) · The American Journal of Human Genetics · doi:10.1086/367774 · Cited by 563
Fenner, J. N. (2005) · American Journal of Physical Anthropology · doi:10.1002/ajpa.20188 · Cited by 508
Correlation between Genetic and Geographic Structure in Europe
Lao, O., Lu, T. T., Nothnagel, M., Junge, O., Freitag-Wolf, S., Caliebe, A., Balascakova, M., Bertranpetit, J., Bindoff, L. A., Comas, D., et al. (2008) · Current Biology · doi:10.1016/j.cub.2008.07.049 · Cited by 503
Self-citationDerived immune and ancestral pigmentation alleles in a 7,000-year-old Mesolithic European
Olalde, I., Allentoft, M. E., Sánchez-Quinto, F., Santpere, G., Chiang, C. W. K., DeGiorgio, M., Prado-Martinez, J., Rodríguez, J. A., Rasmussen, S., Quilez, J., et al. (2014) · Nature · doi:10.1038/nature12960 · Cited by 360
Research works printed but not linked: 45
- Ammerman, A. J. & Cavalli-Sforza, L. L. Neolithic transition and the genetics of populations in Europe Princeton University Press (1984). · DOI
- Richards, M. et al. Paleolithic and neolithic lineages in the European mitochondrial gene pool. Am. J. Hum. Genet. 59, 185–203 (1996).
- Hellenthal, G. et al. A genetic atlas of human admixture history. Science 343, 747–751 (2014). · DOI · Paper page
- Richards, M. et al. Tracing European founder lineages in the near eastern mtDNA pool. Am. J. Hum. Genet. 67, 1251–1276 (2000). · DOI
- Rosser, Z. H. et al. Y-chromosomal diversity within Europe is clinal and influenced primarily by geography, rather than by language. Am. J. Hum. Genet. 67, 1526–1543 (2000). · DOI · Paper page
- Rootsi, S. et al. Phylogeography of Y-chromosome haplogroup I reveals distinct domains of prehistoric gene flow in Europe. Am. J. Hum. Genet. 75, 128–137 (2004). · DOI
- Semino, O. et al. Origin, diffusion, and differentiation of Y-chromosome haplogroups E and J: inferences on the neolithization of Europe and later migratory events in the Mediterranean area. Am. J. Hum. Genet. 74, 1023–1034 (2004). · DOI
- Semino, O. et al. The genetic legacy of Paleolithic Homo sapiens sapiens in extant Europeans: a Y chromosome perspective. Science 290, 1155–1159 (2000). · DOI
- Balaresque, P. et al. A predominantly Neolithic origin for European paternal lineages. PLoS Biol. 8, e1000285 (2010). · DOI · Paper page
- Busby, G. B. et al. The peopling of Europe and the cautionary tale of Y chromosome lineage R-M269. Proc. Biol. Sci. 279, 884–892 (2012). · DOI
- Hallast, P. et al. The Y-chromosome tree bursts into leaf: 13,000 high-confidence SNPs covering the majority of known clades. Mol. Biol. Evol. 32, 661–673 (2015). · DOI
- Veeramah, K. R. & Hammer, M. F. The impact of whole-genome sequencing on the reconstruction of human population history. Nat. Rev. Genet. 15, 149–162 (2014). · DOI
- Francalacci, P. et al. Low-pass DNA sequencing of 1200 Sardinians reconstructs European Y-chromosome phylogeny. Science 341, 565–569 (2013). · DOI
- Lippold, S. et al. Human paternal and maternal demographic histories: insights from high-resolution Y chromosome and mtDNA sequences. Investig. Genet. 5, 13 (2014). · DOI · Paper page
- Drummond, A. J. & Rambaut, A. BEAST: Bayesian evolutionary analysis by sampling trees. BMC Evol. Biol. 7, 214 (2007). · DOI
- Brandt, G. et al. Ancient DNA reveals key stages in the formation of central European mitochondrial genetic diversity. Science 342, 257–261 (2013). · DOI · Paper page
- Karafet, T. M. et al. New binary polymorphisms reshape and increase resolution of the human Y-chromosomal haplogroup tree. Genome Res. 18, 830–838 (2008). · DOI · Paper page
- Ho, S. Y. & Shapiro, B. Skyline-plot methods for estimating demographic history from nucleotide sequences. Mol. Ecol. Resour. 11, 423–434 (2011). · DOI
- Beaumont, M. A., Zhang, W. & Balding, D. J. Approximate Bayesian computation in population genetics. Genetics 162, 2025–2035 (2002). · DOI · Paper page
- Bertorelle, G., Benazzo, A. & Mona, S. ABC as a flexible framework to estimate demography over space and time: some cons, many pros. Mol. Ecol. 19, 2609–2625 (2010). · DOI
- Helgason, A. et al. The Y-chromosome point mutation rate in humans. Nat. Genet. doi:10.1038/ng.3171 (2015). · DOI
- Xue, Y. et al. Human Y chromosome base-substitution mutation rate measured by direct sequencing in a deep-rooting pedigree. Curr. Biol. 19, 1453–1457 (2009). · DOI
- Mendez, F. L. et al. An African American paternal lineage adds an extremely ancient root to the human Y chromosome phylogenetic tree. Am. J. Hum. Genet. 92, 454–459 (2013). · DOI
- Scozzari, R. et al. An unbiased resource of novel SNP markers provides a new chronology for the human Y chromosome and reveals a deep phylogenetic structure in Africa. Genome Res. 24, 535–544 (2014). · DOI
- Elhaik, E., Tatarinova, T. V., Klyosov, A. A. & Graur, D. The 'extremely ancient' chromosome that isn't: a forensic bioinformatic investigation of Albert Perry's X-degenerate portion of the Y chromosome. Eur. J. Hum. Genet. 22, 1111–1116 (2014). · DOI
- Kuroki, Y. et al. Comparative analysis of chimpanzee and human Y chromosomes unveils complex evolutionary pathway. Nat. Genet. 38, 158–167 (2006). · DOI
- Skaletsky, H. et al. The male-specific region of the human Y chromosome: a mosaic of discrete sequence classes. Nature 423, 825–837 (2003). · DOI
- Poznik, G. D. et al. Sequencing Y chromosomes resolves discrepancy in time to common ancestor of males versus females. Science 341, 562–565 (2013). · DOI · Paper page
- Cunliffe, B. Europe Between the Oceans: 9000 BC-AD 1000 Yale University Press (2011).
- Winney, B. et al. People of the British Isles: preliminary analysis of genotypes and surnames in a UK-control population. Eur. J. Hum. Genet. 20, 203–210 (2012). · DOI
- Kao, W. C., Stevens, K. & Song, Y. S. BayesCall: a model-based base-calling algorithm for high-throughput short-read sequencing. Genome Res. 19, 1884–1895 (2009). · DOI
- Lunter, G. & Goodson, M. Stampy: a statistical algorithm for sensitive and fast mapping of Illumina sequence reads. Genome Res. 21, 936–939 (2011). · DOI · Paper page
- DePristo, M. A. et al. A framework for variation discovery and genotyping using next-generation DNA sequencing data. Nat. Genet. 43, 491–498 (2011). · DOI
- Danecek, P. et al. The variant call format and VCFtools. Bioinformatics 27, 2156–2158 (2011). · DOI
- 1000 Genomes Project Consortium. An integrated map of genetic variation from 1,092 human genomes. Nature 491, 56–65 (2012). · DOI · Paper page
- Van Geystelen, A., Decorte, R. & Larmuseau, M. H. AMY-tree: an algorithm to use whole genome SNP calling for Y chromosomal phylogenetic applications. BMC Genomics 14, 101 (2013). · DOI
- Van Geystelen, A., Decorte, R. & Larmuseau, M. H. Updating the Y-chromosomal phylogenetic tree for forensic applications based on whole genome SNPs. Forensic Sci. Int. Genet. 7, 573–580 (2013). · DOI
- Drummond, A. J., Rambaut, A., Shapiro, B. & Pybus, O. G. Bayesian coalescent inference of past population dynamics from molecular sequences. Mol. Biol. Evol. 22, 1185–1192 (2005). · DOI
- Forster, P., Harding, R., Torroni, A. & Bandelt, H.-J. Origin and evolution of Native American mtDNA variation: a reappraisal. Am. J. Hum. Genet. 59, 935–945 (1996).
- Saillard, J., Forster, P., Lynnerup, N., Bandelt, H.-J. & Nørby, S. mtDNA variation among Greenland Eskimos: the edge of the Beringian expansion. Am. J. Hum. Genet. 67, 718–726 (2000). · DOI · Paper page
- Tajima, F. Statistical method for testing the neutral mutation hypothesis by DNA polymorphism. Genetics 123, 585–595 (1989). · DOI
- Fu, Y. X. & Li, W. H. Statistical tests of neutrality of mutations. Genetics 133, 693–709 (1993). · DOI
- Excoffier, L. & Lischer, H. E. Arlequin suite ver 3.5: a new series of programs to perform population genetics analyses under Linux and Windows. Mol. Ecol. Resour. 10, 564–567 (2010). · DOI
- Excoffier, L., Dupanloup, I., Huerta-Sanchez, E., Sousa, V. C. & Foll, M. Robust demographic inference from genomic and SNP data. PLoS Genet. 9, e1003905 (2013). · DOI
- Hamilton, G., Stoneking, M. & Excoffier, L. Molecular analysis reveals tighter social regulation of immigration in patrilocal populations than in matrilocal populations. Proc. Natl Acad. Sci. USA 102, 7476–7480 (2005). · DOI · Paper page
Cited by
Ancient DNA and the rewriting of human history: be sparing with Occam’s razor
Haber, M., Mezzavilla, M., Xue, Y., & Tyler-Smith, C. (2016) · Genome Biology · doi:10.1186/s13059-015-0866-z · Cited by 1,924
Punctuated bursts in human male demography inferred from 1,244 worldwide Y-chromosome sequences
The 1000 Genomes Project Consortium, Poznik, G. D., Xue, Y., Mendez, F. L., Willems, T. F., Massaia, A., Wilson Sayres, M. A., Ayub, Q., McCarthy, S. A., Narechania, A., et al. (2016) · Nature Genetics · doi:10.1038/ng.3559 · Cited by 331
Zeng, T. C., Aw, A. J., & Feldman, M. W. (2018) · Nature Communications · doi:10.1038/s41467-018-04375-6 · Cited by 121
Guyon, L., Guez, J., Toupance, B., Heyer, E., & Chaix, R. (2024) · Nature Communications · doi:10.1038/s41467-024-47618-5 · Cited by 28
Metadata
- Authors
- Batini, C., Hallast, P., Zadik, D., Delser, P. M., Benazzo, A., Ghirotto, S., Arroyo-Pardo, E., Cavalleri, G. L., de Knijff, P., Dupuy, B. M., Eriksen, H. A., King, T. E., de Munain, A. L., López-Parra, A. M., Loutradis, A., Milasin, J., Novelletto, A., Pamjav, H., Sajantila, A., Tolun, A., Winney, B., & Jobling, M. A.
- Venue
- Nature Communications
- Published
- 2015-05-19
- Volume
- 6
- Issue
- 1
- ISSN
- 2041-1723
- PMC
- PMC4441248
- Cited by
- 91
- References
- 11
- Language
- en
About these checks
Registry, retraction, Cites and statistics results are computed, not judged, with one exception: a printed reference that no index lists is read once by a model before it counts as a citation error. Claims are extracted by a model and kept only when their quote appears verbatim in the text; each cited source is then checked, with a model’s help, for whether it says what the claim relies on. Those verdicts can be wrong — read the claim’s quote and the cited source before relying on one.
Statistics and arithmetic are recomputed, not judged.
Confidence bands are shown only for fields calibrated on our annotated test set. None is calibrated yet, so no band is shown.
What counts as a claim ›How we measure confidence ›How we check this ›
Are you an author, or do you see a problem with this page? Request a review
