

The links between ecosystem multifunctionality and above- and belowground biodiversity are mediated by climate
Open accessThe DOI matches its Crossref record; 72 of the 72 references it cites were found in a registry or an index; 4 of the 24 sources its claims cite were checked for support.
Abstract
Plant biodiversity is often correlated with ecosystem functioning in terrestrial ecosystems. However, we know little about the relative and combined effects of above- and belowground biodiversity on multiple ecosystem functions (for example, ecosystem multifunctionality, EMF) or how climate might mediate those relationships. Here we tease apart the effects of biotic and abiotic factors, both above- and belowground, on EMF on the Tibetan Plateau, China. We found that a suite of biotic and abiotic variables account for up to 86% of the variation in EMF, with the combined effects of above- and belowground biodiversity accounting for 45% of the variation in EMF. Our results have two important implications: first, including belowground biodiversity in models can improve the ability to explain and predict EMF. Second, regional-scale variation in climate, and perhaps climate change, can determine, or at least modify, the effects of biodiversity on EMF in natural ecosystems.
Overview
CoChat Summary
TL;DR
Across 60 Tibetan Plateau alpine grassland sites, above- and belowground biodiversity together explained 45% of variation in ecosystem multifunctionality (EMF), while models including climate and soil factors explained up to 86%. Climate and soil variables mediated biodiversity–EMF relationships, with soil moisture the strongest driver.
Key findings
- Plant species richness and belowground biodiversity were positively correlated with EMF; plant richness explained 42% of EMF variation versus 32% for soil biodiversity in OLS regressions. Among belowground groups, bacteria and fauna were positively related to EMF, whereas archaea and arbuscular mycorrhizal fungi were not.
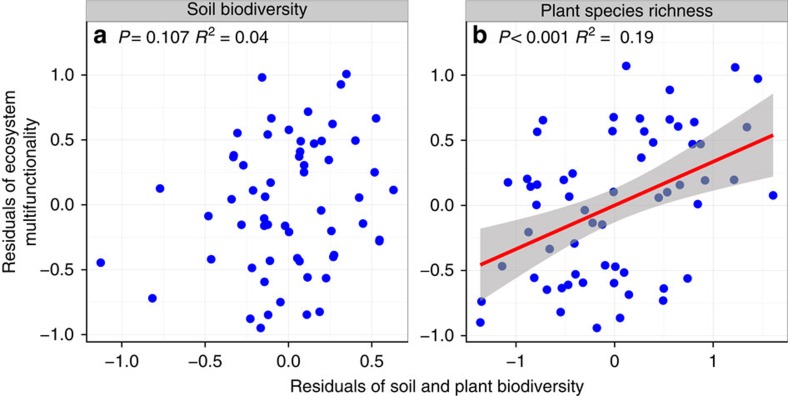
- Combined above- and belowground biodiversity accounted for 45% of EMF variation. In partial linear regression, plant species richness accounted for 19%, soil biodiversity 4% (not statistically significant, P=0.107), and their combined effects 22%.
- A full model with seven PCA components accounted for 86% of EMF variation; the best-fit two-component model accounted for 84%. Soil moisture was the most important single driver, accounting for 65% of EMF variation; MAP explained 43%, soil pH 30%, and soil CaCO3 33%. MAT had no isolated relationship with EMF but improved models when combined with other factors.
- Piecewise SEM showed soil moisture had the strongest influence on EMF (β=0.62), MAP was strongly related to belowground biodiversity (β=0.79), MAT directly affected EMF (β=0.16) and indirectly through soil pH (β=−0.27), and soil pH was negatively related to EMF (β=−0.11).
Methods
- Observational survey of 60 sites spanning >1,000,000 km² in Tibetan Plateau alpine grasslands during July–August 2011; 180 soil samples/plots were collected across alpine meadow, alpine steppe, and desert steppe vegetation types.
- Biodiversity measures included plant species richness, bacterial and archaeal OTUs, AM fungal virtual taxa, and soil faunal richness at order level. EMF was calculated as an averaging index from Z-scores of eight ecosystem functions: aboveground biomass, root biomass, soil organic carbon, soil nitrogen, soil available nitrogen, soil phosphorus, plant nitrogen, and plant phosphorus.
- Analyses used site means (n=60) and included OLS regressions, general linear models, partial linear regression, PCA, and piecewise structural equation modeling; climate data were compiled from 1951–2010 records from 716 stations.
Limitations
- Stated: belowground biodiversity is only a rough estimate because sequencing methods did not detect all taxa; future studies should use higher-resolution sequencing and target active communities. Soil moisture came from a single measurement and was not integrated across the season. The EMF index is not a single best metric of multifunctionality, and the measured functions were often correlated.
- Stated: the observational design cannot fully disentangle causal factors; the authors note that experimental work is needed to further disentangle these relationships.
- Evident: the study is correlational and relies on SEM for inferred direct and indirect effects, so causal claims about climate mediation remain model-based rather than experimentally tested.
Model-written summary. Check it against the paper before relying on it.
Integrity signals
Registry
Cites
Statistics
Figures


Verification
Claims the paper makes
2 Valid · 0 Not valid · 16 Not checked · 60 Own results and interpretations
A result the paper reports from its own data — it cites no other source for it, so there is none to check. The quote shows it is in the paper.
In the paper
“We found that a suite of biotic and abiotic variables account for up to 86% of the variation in EMF”
- Also stated in: § The effects of biodiversity and abiotic factors on EMF · plain
“The full model, with the seven components, accounted for 86% of the variation in EMF”
- Also stated in: § Discussion · plain
“The best-fitting models accounted for 86% of the variation in EMF and included soil moisture, soil pH, above- and belowground biodiversity as well as climatic variables (MAT).”
§ The links between ecosystem multifunctionality and above- and belowground biodiversity are mediated by climate > Abstract
plainstates an association- Asserted: passes — The authors put it forward as true.
- Checkable: passes — It can be checked against evidence.
- Load-bearing: passes — The paper’s conclusions depend on it.
- Based: passes — The paper gives a reason why it holds.
- Also stated in: § The effects of biodiversity and abiotic factors on EMF · plain
A result the paper reports from its own data — it cites no other source for it, so there is none to check. The quote shows it is in the paper.
In the paper
“Plant species richness accounted for 19% of the variation in EMF.”
§ The links between ecosystem multifunctionality and above- and belowground biodiversity are mediated by climate > Results > The effects of above- and belowground biodiversity on EMF
plainstates an association- Asserted: passes — The authors put it forward as true.
- Checkable: passes — It can be checked against evidence.
- Load-bearing: passes — The paper’s conclusions depend on it.
- Based: passes — The paper gives a reason why it holds.
A result the paper reports from its own data — it cites no other source for it, so there is none to check. The quote shows it is in the paper.
In the paper
“We found that soil moisture was the most important driver, accounting for 65% of the variation in EMF (Supplementary Fig. 9).”
§ The links between ecosystem multifunctionality and above- and belowground biodiversity are mediated by climate > Results > The effects of biodiversity and abiotic factors on EMF
plainstates a cause- Asserted: passes — The authors put it forward as true.
- Checkable: passes — It can be checked against evidence.
- Load-bearing: passes — The paper’s conclusions depend on it.
- Based: passes — The paper gives a reason why it holds.
A result the paper reports from its own data — it cites no other source for it, so there is none to check. The quote shows it is in the paper.
In the paper
“the best-fit model with two components (PC1 and PC4) accounted for 84% of the variation in EMF.”
§ The links between ecosystem multifunctionality and above- and belowground biodiversity are mediated by climate > Results > The effects of biodiversity and abiotic factors on EMF
plainstates an association- Asserted: passes — The authors put it forward as true.
- Checkable: passes — It can be checked against evidence.
- Load-bearing: passes — The paper’s conclusions depend on it.
- Based: passes — The paper gives a reason why it holds.
A result the paper reports from its own data — it cites no other source for it, so there is none to check. The quote shows it is in the paper.
In the paper
“PC4 represented MAT, soil moisture and soil CaCO3 (Supplementary Fig. 11).”
§ The links between ecosystem multifunctionality and above- and belowground biodiversity are mediated by climate > Results > The effects of biodiversity and abiotic factors on EMF
plain- Asserted: passes — The authors put it forward as true.
- Checkable: passes — It can be checked against evidence.
- Load-bearing: passes — The paper’s conclusions depend on it.
- Based: passes — The paper gives a reason why it holds.
27 more claims
Create a free account to see all 78 claims and to verify the 20 references still open.
- Probably not a substantial claim. 28
- It may state two separate claims as one. 29
Claims other papers make about this one
Each is checked against this paper’s own text: does it say what the citing paper says it does?
The source backs part of the claim, not all of it — or backs it for a different population, condition or comparison.
In the citing paper
“diversity effects of plants and microbes are complementary, maximising rates of nutrient cycling 11”
From Biodiversity at multiple trophic levels is needed for ecosystem multifunctionality (2016) · cites this paper as [11]
Experimental — accuracy not yet measuredThe cited source says what the claim attributes to it.
In the citing paper
“Consequently, we know very little about the relative effect of changes in the diversity of different trophic groups on the provision of individual 2,5,6,9,13,14 or multiple (multifunctionality) 11,15 ecosystem services.”
From Biodiversity at multiple trophic levels is needed for ecosystem multifunctionality (2016) · cites this paper as [11]
The cited source says what the claim attributes to it.
In the citing paper
“These results agree with other studies that have identified plants and soil microorganisms as key drivers of ecosystem functioning 11,14,15,29 , extending these findings to the richness and abundance of different trophic groups, including primary producers and consumers both above-and belowground.”
From Biodiversity at multiple trophic levels is needed for ecosystem multifunctionality (2016) · cites this paper as [11]
Self-check
Percentages, sums and reported differences re-computed from the paper’s own numbers.
Each contradiction between two passages listed here was confirmed by an independent check.
Rated major: it would touch a result — a value a result rests on, reported and recomputed p-values on opposite sides of the significance level, two passages that conflict with no sign which is right, or a cited work retracted before this paper was published.
In the paper
§ The links between ecosystem multifunctionality and above- and belowground biodiversity are mediated by climate > Results > The effects of biodiversity and abiotic factors on EMF
“the best-fit model with two components (PC1 and PC4) accounted for 84% of the variation in EMF.”
§ The links between ecosystem multifunctionality and above- and belowground biodiversity are mediated by climate > Methods > Statistical analyses
“the other one is a reduced model with two components (PC1 and PC2) (Supplementary Fig. 11).”
Citations
Cites
QIIME allows analysis of high-throughput community sequencing data
Caporaso, J. G., Kuczynski, J., Stombaugh, J., Bittinger, K., Bushman, F. D., Costello, E. K., Fierer, N., Peña, A. G., Goodrich, J. K., Gordon, J. I., et al. (2010) · Nature Methods · doi:10.1038/nmeth.f.303 · Cited by 34,887
Search and clustering orders of magnitude faster than BLAST
Edgar, R. C. (2010) · Bioinformatics · doi:10.1093/bioinformatics/btq461 · Cited by 20,826
Schloss, P. D., Westcott, S. L., Ryabin, T., Hall, J. R., Hartmann, M., Hollister, E. B., Lesniewski, R. A., Oakley, B. B., Parks, D. H., Robinson, C. J., et al. (2009) · Applied and Environmental Microbiology · doi:10.1128/aem.01541-09 · Cited by 19,549
UCHIME improves sensitivity and speed of chimera detection
Edgar, R. C., Haas, B. J., Clemente, J. C., Quince, C., & Knight, R. (2011) · Bioinformatics · doi:10.1093/bioinformatics/btr381 · Cited by 15,114
Experimental Design and Data Analysis for Biologists
Quinn, G. P., & Keough, M. J. (2002) · doi:10.1017/cbo9780511806384 · Cited by 10,674
Global patterns of 16S rRNA diversity at a depth of millions of sequences per sample
Caporaso, J. G., Lauber, C. L., Walters, W. A., Berg-Lyons, D., Lozupone, C. A., Turnbaugh, P. J., Fierer, N., & Knight, R. (2011) · Proceedings of the National Academy of Sciences · doi:10.1073/pnas.1000080107 · Cited by 9,711
EFFECTS OF BIODIVERSITY ON ECOSYSTEM FUNCTIONING: A CONSENSUS OF CURRENT KNOWLEDGE
Hooper, D. U., Chapin, F. S., Ewel, J. J., Hector, A., Inchausti, P., Lavorel, S., Lawton, J. H., Lodge, D. M., Loreau, M., Naeem, S., et al. (2005) · Ecological Monographs · doi:10.1890/04-0922 · Cited by 8,046
Biodiversity loss and its impact on humanity
Cardinale, B. J., Duffy, J. E., Gonzalez, A., Hooper, D. U., Perrings, C., Venail, P., Narwani, A., Mace, G. M., Tilman, D., Wardle, D. A., et al. (2012) · Nature · doi:10.1038/nature11148 · Cited by 7,457
Pruesse, E., Quast, C., Knittel, K., Fuchs, B. M., Ludwig, W., Peplies, J., & Glockner, F. O. (2007) · Nucleic Acids Research · doi:10.1093/nar/gkm864 · Cited by 6,668
The diversity and biogeography of soil bacterial communities
Fierer, N., & Jackson, R. B. (2006) · Proceedings of the National Academy of Sciences · doi:10.1073/pnas.0507535103 · Cited by 5,711
Research works printed but not linked: 1
- Smith, S. E. & Read, D. J. Mycorrhizal Symbiosis Academic Press (2010).
Cited by
Items 301–400 of 894
Distinct patterns of abundant and rare subcommunities in paddy soil during wetting–drying cycles
Li, H., Li, H., Zhou, X., Shen, Y., & Su, J. (2021) · The Science of The Total Environment · doi:10.1016/j.scitotenv.2021.147298 · Cited by 28
Velmourougane, K., Thapa, S., & Prasanna, R. (2022) · Pedosphere · doi:10.1016/j.pedsph.2022.06.037 · Cited by 34
Li, Z., Yang, Y., Zheng, H., Hu, B., Dai, X., Meng, N., Zhu, J., & Yan, D. (2023) · CATENA · doi:10.1016/j.catena.2023.107175 · Cited by 28
Cao, X., Chai, L., Jiang, D., Wang, J., Liu, Y., & Huang, Y. (2018) · Ecosphere · doi:10.1002/ecs2.2445 · Cited by 34
Han, L., Qin, H., Wang, J., Yao, D., Zhang, L., Guo, J., & Zhu, B. (2023) · Frontiers in Microbiology · doi:10.3389/fmicb.2023.1130298 · Cited by 30
“While several studies have examined the long-term impact of nitrogen addition on soil microbial diversity and richness in different environments, the results have been inconsistent (Fierer and Jackson, 2006; Jing et al., 2015).”
Yang, W., Qu, G., Kelly, A. R., Wu, G., & Zhao, J. (2023) · CATENA · doi:10.1016/j.catena.2023.107745 · Cited by 26
Shi, L., Lin, Z., Yao, Z., Peng, C., Hu, M., Yin, N., Lu, X., Zhou, H., Liu, K., & Shao, X. (2023) · Plant and Soil · doi:10.1007/s11104-023-06441-5 · Cited by 31
“Increased plant aboveground N and P pools provide a primary nutrient source for soil organic matter, which may improve the capacity of alpine meadow ecosystems to provide multiple ecological functions (Jing et al. 2015).”
InfluentialZhao, J., Yang, W., Tian, L., Qu, G., & Wu, G. (2024) · The Science of The Total Environment · doi:10.1016/j.scitotenv.2024.170061 · Cited by 27
Zhou, X., Cai, J., Xu, J., Liu, S., Wang, B., Zhang, H., Yue, L., Wu, L., Wu, Y., & Chen, D. (2024) · Journal of Applied Ecology · doi:10.1111/1365-2664.14722 · Cited by 29
Jing, X., Chen, X., Xiao, W., Lin, L., Wang, C., He, J.-S., & Zhu, B. (2018) · Pedobiologia · doi:10.1016/j.pedobi.2018.10.001 · Cited by 28
Self-citationMa, T., Dai, G., Zhu, S., Chen, D., Chen, L., Lü, X., Wang, X., Zhu, J., Zhang, Y., Ma, W., et al. (2019) · Journal of Geophysical Research Biogeosciences · doi:10.1029/2018jg004915 · Cited by 32
“167 that was used for a similar alpine grassland transect previously (Jing et al., 2015).”
MethodInfluentialSelf-citationGuan, P., Mahamood, M., Yang, Y., & Wu, D. (2021) · Agriculture Ecosystems & Environment · doi:10.1016/j.agee.2021.107426 · Cited by 29
Ecosystem restoration and belowground multifunctionality: A network view
Tian, D., Xiang, Y., Seabloom, E. W., Chen, H. Y. H., Wang, J., Yu, G., Deng, Y., Li, Z., & Niu, S. (2022) · Ecological Applications · doi:10.1002/eap.2575 · Cited by 33
Du, X., Liu, H.-W., Li, Y., Li, B., Han, X., Li, Y., Mahamood, M., & Li, Q. (2022) · Ecological Indicators · doi:10.1016/j.ecolind.2022.108900 · Cited by 30
Li, L., He, X. Z., Zhang, X., Hu, J., Wang, M., Wang, Z., & Hou, F. (2022) · Plant and Soil · doi:10.1007/s11104-022-05624-w · Cited by 29
Microbiota assembly patterns and diversity of nine plateau lakes in Yunnan, southwestern China
Liu, Q., Chang, F., Xie, P., Zhang, Y., Duan, L., Li, H., Zhang, X., Zhang, Y., Li, D., & Zhang, H. (2022) · Chemosphere · doi:10.1016/j.chemosphere.2022.137700 · Cited by 27
Tian, L., Yang, W., Ji‐Shi, A., Ma, Y., Wenxue, Z., Chen, Y., Zhou, Q., Qu, G., Zhao, J., & Wu, G. (2022) · Land Degradation and Development · doi:10.1002/ldr.4588 · Cited by 27
“Higher levels of plant biodiversity are often proposed to result in complementarity effects that can promote greater performance in ecosystem functioning (Jing et al., 2015; Ma et al., 2022).”
BackgroundThe drought-induced succession decreased ecosystem multifunctionality of alpine swamp meadow
Yang, W., Zhao, J., Qu, G., Li, R., & Wu, G. (2023) · CATENA · doi:10.1016/j.catena.2023.107358 · Cited by 27
Wang, J., Peñuelas, J., Shi, X., Liu, Y., Delgado‐Baquerizo, M., Mao, J., Zhang, G., Liu, C., & Pan, G. (2024) · Communications Earth & Environment · doi:10.1038/s43247-024-01767-z · Cited by 31
“The results indicated the close association among ecosystem stability, functions, and soil microbial communities, and highlighted the positive effects of soil microbial traits on ecosystem stability and multifunctionality underclimate change 60,61 .”
Luo, W., Wang, P., Liu, J., & Tao, J. (2025) · CATENA · doi:10.1016/j.catena.2025.109115 · Cited by 31
The spatial patterns of litter turnover time in Chinese terrestrial ecosystems
Cai, A., Chang, N., Zhang, W., Liang, G., Zhang, X., Hou, E., Jiang, L., Chen, X., Xu, M., & Luo, Y. (2019) · European Journal of Soil Science · doi:10.1111/ejss.12922 · Cited by 27
Su, X., Li, G., Cotner, J. B., Wei, L., Wang, Y., Pan, T., & Ding, K. (2021) · Journal of Soils and Sediments · doi:10.1007/s11368-020-02854-2 · Cited by 26
“Soil multifunctionality is critical to reflect soil health, nutrient cycles, organic substance decomposition, and climate changes (Chen et al. 2020; Jing et al. 2015).”
BackgroundJing, X., Prager, C. M., Chen, L., Chu, H., Gotelli, N. J., He, J., Shi, Y., Yang, T., Zhu, B., Classen, A. T., et al. (2021) · Global Ecology and Biogeography · doi:10.1111/geb.13442 · Cited by 27
Self-citationFernández‐Guisuraga, J. M., Fernández‐García, V., Tárrega, R., Marcos, E., Valbuena, L., Pinto, R., Monte, P., Beltrán-Marcos, D., Huerta, S., & Calvo, L. (2022) · Frontiers in Ecology and Evolution · doi:10.3389/fevo.2022.861611 · Cited by 29
The impacts of agroforestry on soil multi-functionality depending on practices and duration
Li, S., Gong, S., Hou, Y., Li, X., & Wang, C. (2022) · The Science of The Total Environment · doi:10.1016/j.scitotenv.2022.157438 · Cited by 33
Lin, L., Ruan, Z., Jing, X., Wang, Y., & Feng, W. (2023) · Soil Ecology Letters · doi:10.1007/s42832-023-0175-5 · Cited by 27
“We use the mean value of 0-1 standardized β-D-cellobiohydrolase, β-1, 4-N-acetyl-glucosaminidase, and alkaline phosphatase to characterize soil hydrolytic enzyme activities (Jing et al., 2015).”
MethodSelf-citationXu, Y., Zhou, J., Liu, C., Jia, R., Ji, H., Dippold, M. A., Zhao, T., Pavinato, P. S., Peixoxo, L., Yang, Y., et al. (2023) · Industrial Crops and Products · doi:10.1016/j.indcrop.2023.117980 · Cited by 30
Chao, H., Cai, A., Heimburger, B., Wu, Y., Zhao, D., Sun, M., & Hu, F. (2024) · Journal of Environmental Management · doi:10.1016/j.jenvman.2024.120664 · Cited by 30
Li, J., Hao, M., Cheng, Y., Zhao, X., von Gadow, K., & Zhang, C. (2024) · Global Ecology and Biogeography · doi:10.1111/geb.13880 · Cited by 33
Pan, Y. J., Wu, J., Luo, L., Tu, Y., Yu, C., Zhang, X., Miao, Y., Zhao, Y., & Yang, J.-L. (2017) · Journal of Mountain Science · doi:10.1007/s11629-016-4242-6 · Cited by 27
Hydrologic and Edaphic Controls on Soil Carbon Emission in Dongting Lake Floodplain, China
Deng, Z., Li, Y., Xie, Y., Peng, C. H., Chen, X., Li, F., Ren, Y., Pan, B., & Zhang, C. (2018) · Journal of Geophysical Research Biogeosciences · doi:10.1029/2018jg004515 · Cited by 25
“Compared with the traditional variance covariance-based SEM, the piecewise SEM could (1) piece multiple separate (generalized) linear models together to a single causal network, (2) use Shipley’s test of d-separation to test whether any paths are missing from the model, and (3) use Akaike information criterion to comp…”
MethodMarín-Guirao, J. I., García, M. D. C., Crisol‐Martínez, E., Gómez-Tenorio, M. A., García‐Raya, P., & Tello‐Marquina, J. C. (2019) · Annals of Applied Biology · doi:10.1111/aab.12501 · Cited by 32
Livestock grazing promotes ecosystem multifunctionality of a coastal salt marsh
Zhang, P., Yang, Z., & Wu, J. (2021) · Journal of Applied Ecology · doi:10.1111/1365-2664.13957 · Cited by 26
Tree species diversity enhances plant-soil interactions in a temperate forest in northeast China
Sanaei, A., Yuan, Z., Ali, A., Loreau, M., Mori, A., Reich, P. B., Jucker, T., Lin, F., Ye, J., Fang, S., et al. (2021) · Forest Ecology and Management · doi:10.1016/j.foreco.2021.119160 · Cited by 26
Wang, T., Dong, L., & Liu, Z. (2024) · Frontiers in Forests and Global Change · doi:10.3389/ffgc.2024.1354508 · Cited by 31
Wang, N., Cheng, J., Liu, Y., Xu, Q., Zhu, C., Ling, N., Guo, J., Li, R., Huang, W., Guo, S., et al. (2024) · Plant and Soil · doi:10.1007/s11104-024-06641-7 · Cited by 25
“An investigation at high altitude demonstrated that soil acidification associated with pedogenesis reduced the soil organic carbon decomposition (Jing et al. 2015), and resulted in high organic matter accumulation and our soil organic carbon results (Fig.”
Wang, K., Xue, K., Liu, W., Zhang, B., Wu, W., Zhao, R., Cui, L., Wang, Z., Zhou, S., Li, T., et al. (2024) · Agriculture Ecosystems & Environment · doi:10.1016/j.agee.2024.109189 · Cited by 25
Zhang, Y., Luo, Z., Li, L., Nian, L., Li, L., Niu, Y., He, R., & Liu, J. (2025) · Microorganisms · doi:10.3390/microorganisms13030540 · Cited by 33
“In natural ecosystems, both controlled indoor experiments [13] and in situ surveys [14] have demonstrated a positive correlation between soil microbial diversity and ecosystem multifunctionality (EMF).”
Shi, Z., Yin, K., Wang, F., Mickan, B. S., Wang, X., Zhou, W., & Li, Y. (2019) · Diversity · doi:10.3390/d11100181 · Cited by 24
Wan, B., Mei, X., Hu, Z., Guo, H. J., Chen, X., Griffiths, B. S., & Liu, M. (2021) · Applied Soil Ecology · doi:10.1016/j.apsoil.2021.104161 · Cited by 23
Zhao, Y., Liao, J., Bao, X., & Ma, M. (2021) · Biological Conservation · doi:10.1016/j.biocon.2021.109360 · Cited by 29
Lan, J., Lei, X., He, X., Gao, W., & Guo, H. M. (2023) · European Journal of Forest Research · doi:10.1007/s10342-023-01537-0 · Cited by 25
Dai, W., Liu, Y., Yao, D., Wang, N., Shao, J., Ye, X., Cui, Z., Zong, H., Tian, L., Chen, X., et al. (2023) · The Science of The Total Environment · doi:10.1016/j.scitotenv.2023.167255 · Cited by 26
Mao, H., Whalen, J. K., Zhang, Z., Sheng, X., Hu, G., Chen, B., & Ma, M. (2024) · Soil Biology and Biochemistry · doi:10.1016/j.soilbio.2024.109555 · Cited by 25
Li, W., Wang, H., Lv, G., Wang, J., & Li, J. (2024) · The Science of The Total Environment · doi:10.1016/j.scitotenv.2024.176148 · Cited by 23
Nitrogen effects on plant productivity change at decadal time‐scales
Liang, G., Luo, Y., Zhou, Z., & Waring, B. G. (2021) · Global Ecology and Biogeography · doi:10.1111/geb.13391 · Cited by 24
“Climatic variables, such as MAT and MAP, affect these patterns indirectly, through their influences on soil pH, soil nutrient availability, soil microbial community structure and plant diversity (Crowther et al., 2019; Hou et al., 2018; Jing et al., 2015).”
BackgroundYang, J., Wang, S., Su, W., Yu, Q., Wang, X., Han, Q., Zheng, Y., Qu, J., Li, X., & Li, H. (2022) · Frontiers in Microbiology · doi:10.3389/fmicb.2022.950811 · Cited by 27
Kaur, M., Li, J., Zhang, P., Yang, H., Wang, L., & Xu, M. (2022) · Frontiers in Ecology and Evolution · doi:10.3389/fevo.2022.1026771 · Cited by 28
“Soil ecosystem provides various functional services, such as maintenance of soil fertility, promoting ecosystem stability, and regulating climate change (Medan et al., 2011; Jing et al., 2015).”
BackgroundHe, P., Ling, N., Lü, X., Zhang, H., Wang, C., Wang, R., Wei, C., Yao, J. T., Wang, X., Han, X., et al. (2023) · Applied Soil Ecology · doi:10.1016/j.apsoil.2023.104881 · Cited by 35
Fernández‐Guisuraga, J. M., Marcos, E., de Miera, L. E. S., Ansola, G., Pinto, R., & Calvo, L. (2023) · The Science of The Total Environment · doi:10.1016/j.scitotenv.2023.165477 · Cited by 26
Microbial diversity is especially important for supporting soil function in low nitrogen ecosystems
Dong, L., Yao, X., Zhang, H., Deng, Y., Hu, T., Delgado‐Baquerizo, M., & Wang, W. (2024) · Soil Biology and Biochemistry · doi:10.1016/j.soilbio.2024.109442 · Cited by 24
Gori, A., Tattini, M., Centritto, M., Ferrini, F., Marino, G., Mori, J., Guidi, L., & Brunetti, C. (2019) · Conservation Physiology · doi:10.1093/conphys/coz070 · Cited by 23
“, 2011) and, therefore, is a major driver of multifunctionality in areas characterised by strong environmental stresses (Jing et al., 2015; Maestre et al., 2012).”
BackgroundOn the controls of abundance for soil‐dwelling organisms on the Tibetan Plateau
Zhao, K., Jing, X., Sanders, N. J., Chen, L., Shi, Y., Flynn, D. F. B., Wang, Y., Chu, H., Liang, W., & He, J. (2017) · Ecosphere · doi:10.1002/ecs2.1901 · Cited by 23
Self-citationZhang, Y., Cao, H., Zhao, P., Wei, X., Ding, G., Gao, G., & Shi, M. (2021) · Frontiers in Environmental Science · doi:10.3389/fenvs.2021.589068 · Cited by 22
Direct and indirect effects of dominant plants on ecosystem multifunctionality
Chen, J., Liu, Z., Cui, H., Song, H., Wang, J., Gao, H., Chen, S., Liu, K., Yang, Z. Y., Wang, Y., et al. (2023) · Frontiers in Plant Science · doi:10.3389/fpls.2023.1117903 · Cited by 26
“Also, the absence of effect of belowground biodiversity may arise from the consideration of nematodes only as an indicator of belowground biodiversity, while multiple trophic levels are needed to promote EMF (Jing et al., 2015; Schuldt et al., 2018).”
BackgroundIzydorczyk, K., Michalska-Hejduk, D., Jarosiewicz, P., Bydałek, F., & Frątczak, W. (2018) · Agricultural Water Management · doi:10.1016/j.agwat.2018.03.021 · Cited by 25
Liu, X., Huang, Z., Havrilla, C. A., Liu, Y., & Wu, G. (2021) · Land Degradation and Development · doi:10.1002/ldr.3973 · Cited by 25
Zhou, G., Long, F., Lei, Z. K., Jarvie, S., Peng, Y., Zang, L., Chen, D., Zhang, G., Sui, M., He, Y., et al. (2024) · The Science of The Total Environment · doi:10.1016/j.scitotenv.2024.173504 · Cited by 21
Jing, X., Prager, C. M., Borer, E. T., Gotelli, N. J., Gruner, D. S., He, J., Kirkman, K. P., MacDougall, A. S., McCulley, R. L., Prober, S. M., et al. (2021) · Ecosphere · doi:10.1002/ecs2.3644 · Cited by 26
“Above-ground plant live biomass, plant N, plant P, root biomass, soil total N, and soil extractable P were selected as the indicators of ecosystem functions (Spehn et al. 2005, Allan et al. 2013, Jing et al. 2015, Delgado-Baquerizo et al. 2016, Hautier et al. 2018, Garland et al. 2021).”
MethodSelf-citationWang, Y., Liu, M., Chen, Y., Zeng, T., Lu, X., Yang, B., Wang, Y., Zhang, L., Nie, X., Xiao, F., et al. (2021) · Frontiers in Plant Science · doi:10.3389/fpls.2021.760599 · Cited by 27
“, 2015), plant communities (Diaz et al., 2007; Jing et al., 2015), soil microbes (Bonkowski and Roy, 2005), and mycorrhizal fungi (van der Heijden et al.”
BackgroundZhang, M., Yang, M., Shi, Z., Gao, J., & Wang, X. (2022) · Diversity · doi:10.3390/d14080626 · Cited by 21
Kuang, J., Deng, D., Han, S., Bates, C. T., Ning, D., Shu, W., & Zhou, J. Z. (2022) · mLife · doi:10.1002/mlf2.12042 · Cited by 23
Grass-microbial inter-domain ecological networks associated with alpine grassland productivity
Wang, Y., Dang, N., Feng, K., Wang, J., Jin, X., Yao, S., Wang, L., Gu, S., Zheng, H., Lu, G., et al. (2023) · Frontiers in Microbiology · doi:10.3389/fmicb.2023.1109128 · Cited by 22
Xu, D., Zhang, X., Yuan, X., Han, H., Xue, Y., & Guo, X. (2023) · Environmental Pollution · doi:10.1016/j.envpol.2023.122671 · Cited by 22
Decoupling the effects of air temperature change on soil erosion in Northeast China
Cao, Y., Li, H., Peng, D., Liu, Y., Jiang, L., Tang, Q., & Cai, C. (2023) · Journal of Environmental Management · doi:10.1016/j.jenvman.2023.119626 · Cited by 22
Zeng, Q., Yin, M., Fu, L., Singh, B. K., Liu, S., Chen, H., Ge, A., Han, L., & Zhang, L. (2023) · Plant and Soil · doi:10.1007/s11104-023-06445-1 · Cited by 21
“…archaea, bacteria, fungi, and protists, etc. are extremely complex and diverse, and serve as the key driver of multiple ecosystem functions (i.e. EMF), including nutrient cycling, litter decomposition, path-ogen suppression and primary production (Jing et al. 2015; Delgado-Baquerizo et al. 2016).”
Zhang, C., Ndungu, C. N., Feng, L., Huang, J., Ba, S., Liu, W., & Cai, M. (2024) · Journal of Environmental Management · doi:10.1016/j.jenvman.2024.121509 · Cited by 23
Zhang, L., Du, H., Song, T., Yang, Z., Peng, W., Gong, J., Huang, G., & Yun, L. (2024) · Scientific Reports · doi:10.1038/s41598-024-68883-w · Cited by 28
Li, Z., Guo, X. Y., Ma, Y., Hu, B., Yang, Y., Tian, H., Liu, X., Meng, N., Zhu, J., Yan, D., et al. (2024) · Environment International · doi:10.1016/j.envint.2024.108516 · Cited by 27
Effect of selective logging on soil microbial communities in a Pinus yunnanensis forest
Li, S., Huang, X., Lang, X., Xu, F., HongYun, L., Zheng, M., & Su, J. (2020) · Land Degradation and Development · doi:10.1002/ldr.3600 · Cited by 22
“…2019), the soil C:N ratio (Nakayama et al., 2019; Wang et al., 2015), soil moisture (Xue, Ren, Li, Leng, & Yao, 2017), climate (Delgado-Baquerizo et al., 2016; Jing et al., 2015), and aboveground vegetation traits (e.g., plant cover and diversity) (DelgadoBaquerizo et al., 2019; Guo et al., 2019).”
BackgroundMethodXiao, Y.-L., Liu, M., Miao, L., Yang, C., Wang, Q., & Wang, M. (2023) · Ecological Research · doi:10.1111/1440-1703.12417 · Cited by 20
A new perspective on the concept of grassland management
Wang, D., & Wang, L. (2019) · Chinese Science Bulletin (Chinese Version) · doi:10.1360/n972018-01036 · Cited by 19
Degradation dynamics and microbial processes in yak dung on the Tibetan Plateau
Zhang, Z., Jiao, Y., & Kolb, S. (2024) · Soil Biology and Biochemistry · doi:10.1016/j.soilbio.2024.109675 · Cited by 19
Plant Diversity Reduces the Risk of Antibiotic Resistance Genes in Agroecosystems
Li, S., Zhou, X., Liu, L., Su, Z., Zhao, J., Zhang, J., Cai, Z., Peñuelas, J., & Huang, X. (2025) · Advanced Science · doi:10.1002/advs.202410990 · Cited by 29
Yan, Y., Qi, Z., & Zhang, Q. (2025) · Journal of Ecology · doi:10.1111/1365-2745.70045 · Cited by 19
“These indicators represent the net balance of ecosystem inputs and outputs, reflecting the overall performance of an eco - system and are widely used to evaluate the multifunctionality of grassland ecosystems (Hautier et al., 2018 ; Jing et al., 2015 ; Maestre et al., 2012 ).”
Hou, Z., Lv, G., & Jiang, L. (2021) · Sustainability · doi:10.3390/su13052858 · Cited by 21
“The multi-functions of ecosystem are the result of many factors, and ecosystem functions are complementary or relative [50], As such, it is necessary to discuss the functions of multiple ecosystems.”
BackgroundHuang, X., Lang, X., Li, S., Liu, W., & Su, J. (2021) · Biodiversity Science · doi:10.17520/biods.2021111 · Cited by 18
Xu, Y., Dong, S., Gao, X., Wu, S., Yang, M., Li, S., Shen, H., Xiao, J., Zhi, Y., Zhao, X., et al. (2022) · Ecological Indicators · doi:10.1016/j.ecolind.2021.108487 · Cited by 19
Jia, J., Zhang, J., Li, Y., Xie, M., Wang, G., & Zhang, J. (2022) · Plant and Soil · doi:10.1007/s11104-022-05853-z · Cited by 21
“Many studies have provided evidence that SMF is positively correlated with microbial diversity in both natural and agricultural ecosystems (Jing et al. 2015; Mori et al. 2016; Delgado-Baquerizo et al. 2017; Luo et al. 2018; Chen et al. 2020b; Li et al. 2021a, b, c).”
Guo, H., Zhou, X., Tao, Y., Yin, J., Zhang, L., Guo, X., Liu, C., Lin, Y., & Zhang, Y. (2023) · Frontiers in Ecology and Evolution · doi:10.3389/fevo.2023.1084949 · Cited by 23
“Many studies have provided extensive evidence for the positive effects of diversity on ecosystem function (Loreau et al., 2001; Hooper et al., 2005; Jing et al., 2015).”
BackgroundSun, C., Qiu, M., Lu, X., & Wang, Y. (2023) · Land Degradation and Development · doi:10.1002/ldr.4987 · Cited by 19
“These variables deliver some of the fundamental support for nutrient cycling and the build-up of nutrient pools (Jing et al., 2015; Maestre et al., 2012).”
BackgroundGao, H., Chen, J., Wang, C., Wang, P., Wang, R., & Feng, B. (2024) · Journal of Hazardous Materials · doi:10.1016/j.jhazmat.2024.135792 · Cited by 19
Bamboo forest management leads to a shift in the soil energy channel
Zhao, C., Zhao, J., Wu, J., Classen, A. T., Li, Y., Lou, Y., Zhang, W., Jing, X., Shao, Y., & Fu, S. (2019) · Geoderma · doi:10.1016/j.geoderma.2019.07.001 · Cited by 19
Self-citationA review on the measurement of ecosystem multifunctionality
Xu, W. L., Jing, X., Ma, Z., & He, J.-S. (2016) · Biodiversity Science · doi:10.17520/biods.2015170 · Cited by 26
Self-citationLinking biodiversity and biotic interactions to ecosystem functioning
Jayaramaiah, R. H., Egidi, E., Macdonald, C. A., & Singh, B. K. (2024) · Journal of Sustainable Agriculture and Environment · doi:10.1002/sae2.12119 · Cited by 28
Liu, Y., Li, C., Zhao, X., Liu, W., Yang, X., Lv, W., Sun, S., Cao, Q., & Dong, Q. (2025) · CATENA · doi:10.1016/j.catena.2025.109109 · Cited by 21
Qiao, Y., Bai, Y., She, W., Liu, L., Miao, C., Zhu, G., Qin, S., & Zhang, Y. (2021) · Applied Soil Ecology · doi:10.1016/j.apsoil.2021.104323 · Cited by 18
Nitrogen deficiency in soil mediates multifunctionality responses to global climatic drivers
Dong, L., Yao, X., Deng, Y., Zhang, H., Zeng, W., Li, X., Tang, J., & Wang, W. (2022) · The Science of The Total Environment · doi:10.1016/j.scitotenv.2022.156533 · Cited by 18
Tian, C., Wang, W., Wang, W., Chen, H., & Tian, J. (2023) · CATENA · doi:10.1016/j.catena.2023.107118 · Cited by 18
Ke, W., Li, C., Zhu, F., Luo, X., Li, X., Wu, C., Hartley, W., & Xue, S. (2023) · The Science of The Total Environment · doi:10.1016/j.scitotenv.2023.164932 · Cited by 20
Yu, L., Sun, W., Zhang, H., Cong, N., Yuan, C., Hu, J., & Jing, X. (2024) · Agriculture Ecosystems & Environment · doi:10.1016/j.agee.2024.108883 · Cited by 19
Self-citationAllart, L., Dumont, B., Joly, F., Mosnier, C., Alvarez, G., Galliot, J.-N., Luna, D. A., Pottier, J., & Gross, N. (2024) · Journal of Applied Ecology · doi:10.1111/1365-2664.14627 · Cited by 24
Ding, K., Chen, L., Zhang, Y., Ge, S., Zhang, Y., Lu, M., Shen, Z., Tong, Z., & Zhang, J. (2024) · CATENA · doi:10.1016/j.catena.2024.108252 · Cited by 27
Self-citationTemporal asynchrony of plant and soil biota determines ecosystem multifunctional stability
Wang, B., Wang, S., Wu, L., Wu, Y., Wang, S., Bai, Y., & Chen, D. (2024) · Global Change Biology · doi:10.1111/gcb.17483 · Cited by 23
“…and water addition regulated total multifunctionality, above-and belowground multifunctionality by changing soil moisture, highlighting the obvious fact that soil moisture influences ecosystem multifunctionality in our semi-arid grass-lands (Chen et al., 2021 ; Jing et al., 2015; Wu et al., 2023).”
Cai, M., Peng, X., Cheng, X., Liu, L., Xing, S., Shang, T., & Han, H. (2020) · Forests · doi:10.3390/f11030261 · Cited by 18
“The variation in vegetation community characteristics has been found to be closely interrelated to microbial biomass and diversity [15,16].”
BackgroundMamabolo, E., Makwela, M. M., & Tsilo, T. J. (2020) · European Journal of Sustainable Development · doi:10.14207/ejsd.2020.v9n3p616 · Cited by 21
“Because soil biodiversity is responsive to management and environmental changes, it is regarded as the bioindicator, providing stability and resilience against disturbances and soil stresses caused by anthropogenic activities and climate change (FAO, 2008; Jing et al., 2015).”
BackgroundWang, Y., Sun, Y., Liu, Y., Wang, Z., Chang, S., Qian, Y., Chu, J., & Hou, F. (2022) · Journal of Environmental Management · doi:10.1016/j.jenvman.2022.116167 · Cited by 17
Liu, R., Yao, Y., Li, Q., Cai, Z., Wei, D., Wang, X., & Zhang, S. (2022) · CATENA · doi:10.1016/j.catena.2022.106705 · Cited by 18
Complex relationships and feedback mechanisms between climate change and biodiversity
Jing, X., Jiang, S., Liu, H., Li, Y., & He, J.-S. (2022) · Biodiversity Science · doi:10.17520/biods.2022462 · Cited by 18
Self-citationLi, F., Shi, Z., Liu, S., Xu, G., Zhang, M., Cao, X., Chen, M., Chen, J., Xing, H., & Gong, S. (2023) · Plant and Soil · doi:10.1007/s11104-023-06222-0 · Cited by 18
“Additionally, a lack of soil water content will cause a series of stresses on plant physiological and ecological processes, including photosynthesis, which hinders plant metabolism and impedes EMF (Jing et al. 2015).”
BackgroundResultInfluential
Metadata
- Authors
- Jing, X., Sanders, N. J., Shi, Y., Chu, H., Classen, A. T., Zhao, K., Chen, L., Shi, Y., Jiang, Y., & He, J.-S.
- Affiliations
- Peking University (CN)
- University of Copenhagen (DK)
- Chinese Academy of Sciences (CN)
- Northwest Institute of Plateau Biology (CN)
- Chinese Academy of Forestry (CN)
- Corresponding author
- He, Jin-Sheng
- Venue
- Nature Communications
- Published
- 2015-09-02
- Volume
- 6
- Issue
- 1
- Pages
- 8159-8159
- ISSN
- 2041-1723 (ISSN-L)
- PMC
- PMC4569729
- OpenAlex
- W2263248977
- Cited by
- 895
- References
- 72
- Citations by year
- 2026: 122 · 2025: 142 · 2024: 145 · 2023: 124 · 2022: 87 · 2021: 87 · 2020: 57 · 2019: 45 · 2018: 37 · 2017: 29 · 2016: 15 · 2015: 3
- FWCI
- 29.02
- Type
- journal article
- Language
- en
- Open access
- gold
- doi.org
- Licence
- cc-by
- creativecommons.org/licenses/by/4.0 (tdm)
- creativecommons.org/licenses/by/4.0 (vor)
- Locations
- Nature Communications (publishedVersion, cc-by)
- Europe PMC (PubMed Central) (publishedVersion, cc-by)
- PubMed Central (publishedVersion, cc-by)
- PubMed (publishedVersion)
- Research at the University of Copenhagen (University of Copenhagen) (publishedVersion, cc-by)
- OSTI OAI (U.S. Department of Energy Office of Scientific and Technical Information) (submittedVersion)
- RePEc: Research Papers in Economics (submittedVersion)
- Institute of Botany, CAS Institutional Repository (submittedVersion)
- Greater South Information System
- Funders
- National Science Foundation (1136703)
- U.S. Department of Energy (DESC0010562)
- National Research Foundation
- Danmarks Grundforskningsfond
- National Natural Science Foundation of China (31321061, 111 Project, XDB03030403, 41071167, 2014CB954004, 31025005)
- Chinese Academy of Sciences (XDA05050404, 31321061, XDB03030403)
- Higher Education Discipline Innovation Project
- Office of Science (DESC0010562)
- Center for Makroøkologi, Evolution og Klima
- National Key Research and Development Program of China (2014CB954004, #2014CB954002, 111 project)
- Biological and Environmental Research (DE-SC0010562)
- Topics
- Physical Sciences › Environmental Science › Nature and Landscape Conservation › Ecology and Vegetation Dynamics Studies
- Life Sciences › Agricultural and Biological Sciences › Soil Science › Soil Carbon and Nitrogen Dynamics
- Physical Sciences › Environmental Science › Global and Planetary Change › Land Use and Ecosystem Services
- Keywords
- ecosystem multifunctionality, soil biodiversity, plant diversity, ecosystem functioning, Tibetan Plateau, biotic and abiotic factors
- MeSH terms
- Bacteria, Climate, Fungi, Plants, Soil Microbiology, Ecosystem, Tibet, Biodiversity, Climate Change, Biota, Grassland
About these checks
Registry, retraction, Cites and statistics results are computed, not judged, with one exception: a printed reference that no index lists is read once by a model before it counts as a citation error. Claims are extracted by a model and kept only when their quote appears verbatim in the text; each cited source is then checked, with a model’s help, for whether it says what the claim relies on. Those verdicts can be wrong — read the claim’s quote and the cited source before relying on one.
The claim verdicts this report counts are experimental: their accuracy is not yet measured.
A language model drew the claims from the paper on 2026-10-07, under version 3 of the claim definition (model deepseek-v4.1-flash, prompt extract-v3).
A second model labelled each claim on 2026-10-07 (model jev-1.13-20260917, definition revision gold-guideline-v0.2).
Statistics and arithmetic are recomputed, not judged.
Confidence bands are shown only for fields calibrated on our annotated test set. None is calibrated yet, so no band is shown.
What counts as a claim ›How we measure confidence ›How we check this ›
Are you an author, or do you see a problem with this page? Request a review
Data sources
Bibliographic data: Semantic Scholar, OpenAlex, Crossref.
Contains information from the Semantic Scholar Academic Graph Datasets, made available under the ODC Attribution License (ODC-BY 1.0).
Semantic Scholar’s data is described in: Kinney, R., et al. (2023). The Semantic Scholar Open Data Platform. arXiv:2301.10140.
