

The DOI matches its Crossref record; 63 of the 63 references it cites were found in a registry or an index.
Lifestyle transitions in plant pathogenic Colletotrichum fungi deciphered by genome and transcriptome analyses
Open accessAbstract
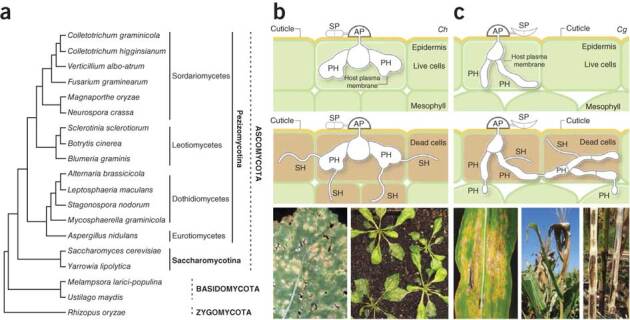
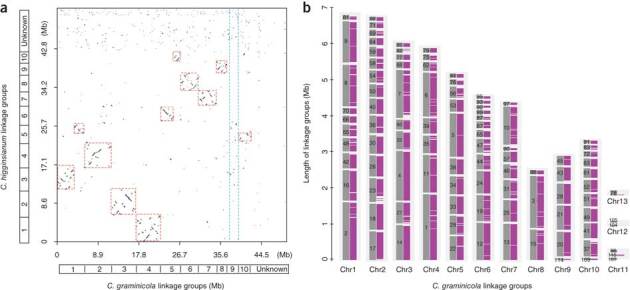
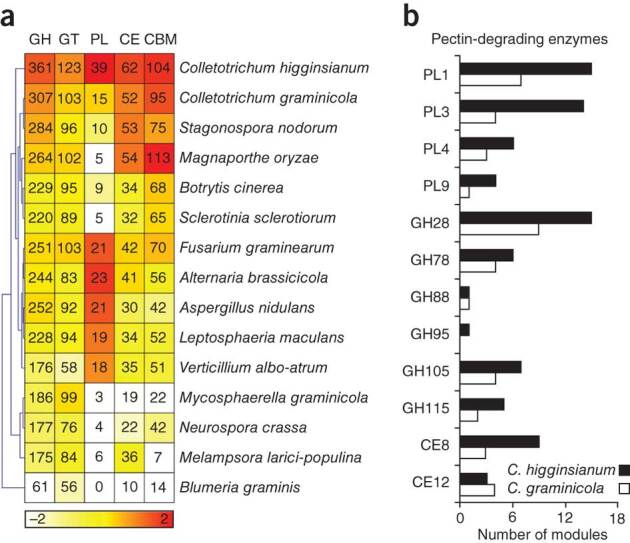
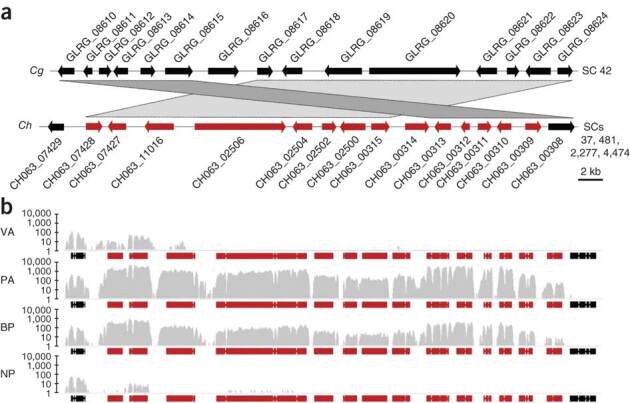
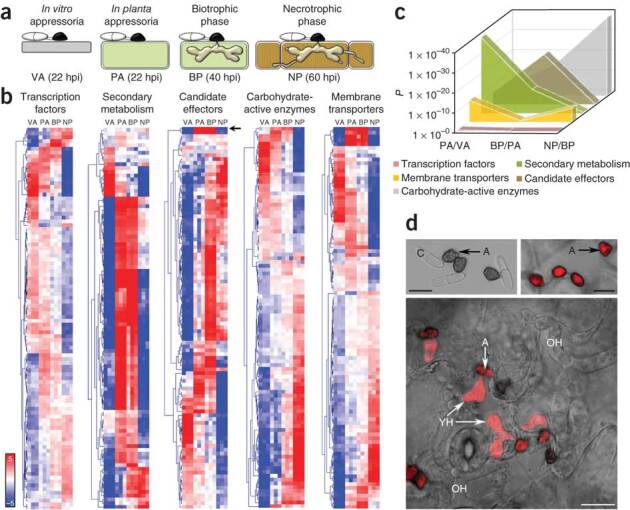
Richard O'Connell and colleagues report the genomes and transcriptomes of two Colletotrichum plant fungal pathogens. C. higginsianum infects Arabidopsis thaliana, and C. graminicola infects maize (Zea mays); comparative genomics in both species lead to molecular insights into the transition from biotrophic to necrotrophic life stages. Colletotrichum species are fungal pathogens that devastate crop plants worldwide. Host infection involves the differentiation of specialized cell types that are associated with penetration, growth inside living host cells (biotrophy) and tissue destruction (necrotrophy). We report here genome and transcriptome analyses of Colletotrichum higginsianum infecting Arabidopsis thaliana and Colletotrichum graminicola infecting maize. Comparative genomics showed that both fungi have large sets of pathogenicity-related genes, but families of genes encoding secreted effectors, pectin-degrading enzymes, secondary metabolism enzymes, transporters and peptidases are expanded in C. higginsianum. Genome-wide expression profiling revealed that these genes are transcribed in successive waves that are linked to pathogenic transitions: effectors and secondary metabolism enzymes are induced before penetration and during biotrophy, whereas most hydrolases and transporters are upregulated later, at the switch to necrotrophy. Our findings show that preinvasion perception of plant-derived signals substantially reprograms fungal gene expression and indicate previously unknown functions for particular fungal cell types.
Overview
The claims and statistics of this paper haven’t been checked yet.
Run the check — free, no account needed. It reads the open-access text and checks the sources it cites.
Integrity signals
Registry
Cites
Statistics
Figures
Verification
Claims the paper makes
The claims and statistics of this paper haven’t been checked yet.
Run the check — free, no account needed. It reads the open-access text and checks the sources it cites.
Claims other papers make about this one
Each is checked against this paper’s own text: does it say what the citing paper says it does?
The source backs part of the claim, not all of it — or backs it for a different population, condition or comparison.
In the citing paper
“Colletotrichum species adopt either intracellular hemibiotrophy or subcuticular, intramural necrotrophy (Wharton & Diéguez-Uribeondo 2004, Münch et al. 2008, O'Connell et al. 2012, de Silva et al. 2017).”
From Colletotrichum: lifestyles, biology, morpho-species, species complexes and accepted species (2021) · cites this paper as O'Connell et al. 2012
Experimental — accuracy not yet measuredThe cited source says what the claim attributes to it.
In the citing paper
“Comparative analyses of these genomes have revealed that Colletotrichum species may tailor their plant cell wall degrading enzymes and proteinases according to their lifestyle (O'Connell et al. 2012, Baroncelli et al. 2016, Hacquard et al. 2016).”
From Colletotrichum: lifestyles, biology, morpho-species, species complexes and accepted species (2021) · cites this paper as O'Connell et al. 2012
The cited source says what the claim attributes to it.
In the citing paper
“Species of Colletotrichum undergo major transformations in cell morphology and infection mode when switching lifestyles (O'Connell et al. 2012).”
From Colletotrichum: lifestyles, biology, morpho-species, species complexes and accepted species (2021) · cites this paper as O'Connell et al. 2012
The cited source says what the claim attributes to it.
In the citing paper
“Being a complex genus, Colletotrichum has different lifestyles that vary between groups of species, many of which can switch between lifestyles (Promputtha et al. 2007, O'Connell et al. 2012).”
From Colletotrichum: lifestyles, biology, morpho-species, species complexes and accepted species (2021) · cites this paper as O'Connell et al. 2012
The cited source says what the claim attributes to it.
In the citing paper
“Most of the species of Colletotrichum develop a necrotrophic stage in their life cycles (Cannon et al. 2012, O'Connell et al. 2012, de Silva et al. 2017).”
From Colletotrichum: lifestyles, biology, morpho-species, species complexes and accepted species (2021) · cites this paper as O'Connell et al. 2012
The check wasn’t confident either way, so it gives no verdict — never disputed.
In the citing paper
“O'Connell et al. (2012) showed that the destructivum species complex is monophyletic and distinct from other Colletotrichum species complexes.”
From Colletotrichum: lifestyles, biology, morpho-species, species complexes and accepted species (2021) · cites this paper as O'Connell et al. 2012
Experimental — accuracy not yet measured
Self-check
Percentages, sums and reported differences re-computed from the paper’s own numbers.
The self-check needs the paper’s full text.
Citations
Cites
Robinson, M. D., McCarthy, D. J., & Smyth, G. K. (2010) · Bioinformatics · doi:10.1093/bioinformatics/btp616 · Cited by 41,364
MrBayes 3: Bayesian phylogenetic inference under mixed models
Ronquist, F., & Huelsenbeck, J. P. (2003) · Bioinformatics · doi:10.1093/bioinformatics/btg180 · Cited by 29,194
BEDTools: a flexible suite of utilities for comparing genomic features
Quinlan, A. R., & Hall, I. M. (2010) · Bioinformatics · doi:10.1093/bioinformatics/btq033 · Cited by 27,437
Ultrafast and memory-efficient alignment of short DNA sequences to the human genome.
Langmead, B., Trapnell, C., Pop, M., & Salzberg, S. L. (2009) · Genome Biology · doi:10.1186/gb-2009-10-3-r25 · Cited by 21,849
MAFFT: a novel method for rapid multiple sequence alignment based on fast Fourier transform
Katoh, K. (2002) · Nucleic Acids Research · doi:10.1093/nar/gkf436 · Cited by 17,027
TopHat: discovering splice junctions with RNA-Seq
Trapnell, C., Pachter, L. S., & Salzberg, S. L. (2009) · Bioinformatics · doi:10.1093/bioinformatics/btp120 · Cited by 11,682
The Carbohydrate-Active EnZymes database (CAZy): an expert resource for Glycogenomics
Cantarel, B. L., Coutinho, P. M., Rancurel, C., Bernard, T., Lombard, V., & Henrissat, B. (2008) · Nucleic Acids Research · doi:10.1093/nar/gkn663 · Cited by 6,108
Self-citationVersatile and open software for comparing large genomes
Kurtz, S., Phillippy, A., Delcher, A. L., Smoot, M., Shumway, M., Antonescu, C., & Salzberg, S. L. (2004) · Genome Biology · doi:10.1186/gb-2004-5-2-r12 · Cited by 5,254
Shaner, N. C., Campbell, R. E., Steinbach, P. A., Giepmans, B. N. G., Palmer, A. E., & Tsien, R. Y. (2004) · Nature Biotechnology · doi:10.1038/nbt1037 · Cited by 4,619
WoLF PSORT: protein localization predictor
Horton, P., Park, K., Obayashi, T., Fujita, N., Harada, H., Adams-Collier, C. J., & Nakai, K. (2007) · Nucleic Acids Research · doi:10.1093/nar/gkm259 · Cited by 4,154
Research works printed but not linked: 1
- Frank, B. Ueber einige neue und weniger bekannte Pflanzenkrankheiten. Ber. Deutsch. Bot. Gesell. 1, 29–34 (1883).
Cited by
Sorted by citations
Items 601–700 of 1,000
Partial Least Squares Regression for Binary Data
Vicente-González, L., Frutos‐Bernal, E., & Villardón, J. L. V. (2025) · Mathematics · doi:10.3390/math13030458 · Cited by 10
Plant Pathogenic and Endophytic Colletotrichum fructicola
Zakaria, L. (2025) · Microorganisms · doi:10.3390/microorganisms13071465 · Cited by 10
Liu, Z., Lian, S., Li, B., Dong, X., Wang, C., Cho, W. K., & Liang, W. (2019) · Journal of General Plant Pathology · doi:10.1007/s10327-019-00886-2 · Cited by 10
Zhang, B., Zhang, N., Zhang, Q., Xu, Q., Zhong, T., Zhang, K., & Xu, M. (2021) · Journal of Fungi · doi:10.3390/jof7020150 · Cited by 10
Reveglia, P., Agudo-Jurado, F. J., Barilli, E., Masi, M., Evidente, A., & Rubiales, D. (2023) · Journal of Fungi · doi:10.3390/jof9060610 · Cited by 10
Emerging roles of plant microRNAs during Colletotrichum spp. infection
Cabral, S. K. D. O., de Freitas, M. B., Stadnik, M. J., & Kulcheski, F. R. (2024) · Planta · doi:10.1007/s00425-023-04318-6 · Cited by 10
Loureiro, A., Azinheira, H. G., Silva, M. D. C., & Talhinhas, P. (2015) · Fungal Biology · doi:10.1016/j.funbio.2015.08.008 · Cited by 10
de Queiroz, C. B., Santana, M. F., Vidigal, P. M. P., & de Queiroz, M. V. (2018) · Applied Microbiology and Biotechnology · doi:10.1007/s00253-018-8812-0 · Cited by 10
Dube, G., Kadoo, N. Y., & Prashant, R. (2018) · PLoS ONE · doi:10.1371/journal.pone.0197447 · Cited by 10
Eisermann, I., Motyka, V., Kümmel, S., Dobrev, P. I., Hübner, K., Deising, H. B., & Wirsel, S. G. R. (2020) · Fungal Genetics and Biology · doi:10.1016/j.fgb.2020.103436 · Cited by 10
Boufleur, T. R., Júnior, N. S. M., Tikami, Í., Sukno, S. A., Thon, M. R., & Baroncelli, R. (2021) · Pathogens · doi:10.3390/pathogens10111520 · Cited by 10
Self-citationAssembling Quality Genomes of Flax Fungal Pathogens from Oxford Nanopore Technologies Data
Sigova, E. A., Pushkova, E. N., Rozhmina, T. A., Kudryavtseva, L. P., Zhuchenko, A. A., Novakovskiy, R. O., Zhernova, D. A., Povkhova, L. V., Turba, A. A., Владимировна, Б. Е., et al. (2023) · Journal of Fungi · doi:10.3390/jof9030301 · Cited by 10
Pathogen to Endophytic Transmission in Fungi- A Proteomics Approach
Pillai, T. G. (2017) · SOJ Microbiology & Infectious Diseases · doi:10.15226/sojmid/5/3/00173 · Cited by 10
Silva, F. D. A., Vasconcelos, I. M., Saraiva, K. D. D. C., Costa, J. H., Fernandes, C. D. F., & Oliveira, J. T. A. (2019) · Journal of Plant Physiology · doi:10.1016/j.jplph.2018.12.009 · Cited by 10
Dong, Y., Li, Y., Qi, Z., Zheng, X., & Zhang, Z. (2015) · Current Genetics · doi:10.1007/s00294-015-0509-7 · Cited by 10
The complete mitochondrial genome sequence of the ascomycete plant pathogen Colletotrichum acutatum
Kim, J.-O., Choi, K., Han, J.-H., Choi, I., Lee, Y., & Kim, K. S. (2015) · Mitochondrial DNA Part A · doi:10.3109/19401736.2015.1101556 · Cited by 10
Self-citationXiong, F., Wang, Y., Lu, Q., Hao, X., Fang, W., Yang, Y., Zhu, X., & Wang, X. (2020) · Biomolecules · doi:10.3390/biom10050782 · Cited by 9
Liang, X., Yu, W., Meng, Y., Shang, S., Tian, H., Zhang, Z., Rollins, J. A., Zhang, R., & Sun, G. (2024) · Molecular Plant Pathology · doi:10.1111/mpp.13454 · Cited by 9
Self-citationSilva, F. M. D. N., de Resende, M. L. V., Ferreira, L. C., Adesina, O., & Xavier, K. V. (2024) · Journal of Fungi · doi:10.3390/jof10110742 · Cited by 9
The Colletotrichum higginsianum secreted effector protein ChEC91 induces plant cell death
Takahara, H., Yamaguchi, S., Omura, N., Nakajima, S., Otoku, K., Tanaka, S., Ogura, K., Kleemann, J., & O’Connell, R. J. (2021) · Journal of General Plant Pathology · doi:10.1007/s10327-021-01028-3 · Cited by 9
Self-citationMatsuo, H., Ishiga, Y., Kubo, Y., & Yoshioka, Y. (2022) · Ikushugaku zasshi · doi:10.1270/jsbbs.22011 · Cited by 9
Self-citationWang, Y., Xu, W.-T., Lu, R., Chen, M., Liu, J., Sun, X., & Zhang, Y. (2022) · Plant Disease · doi:10.1094/pdis-03-22-0567-a · Cited by 9
Yeast-based heterologous production of the Colletochlorin family of fungal secondary metabolites
Geistodt‐Kiener, A., Totozafy, J., Goff, G. L., Vergne, J., Sakai, K., Ouazzani, J., Mouille, G., Viaud, M., O’Connell, R. J., & Dallery, J. (2023) · Metabolic Engineering · doi:10.1016/j.ymben.2023.10.002 · Cited by 9
Self-citationKumakura, N., Singkaravanit‐Ogawa, S., Gan, P., Tsushima, A., Ishihama, N., Watanabe, S., Seo, M., Iwasaki, S., Narusaka, M., Narusaka, Y., et al. (2024) · New Phytologist · doi:10.1111/nph.19582 · Cited by 9
Self-citationPedras, M. S. C., & Thapa, C. (2019) · Phytochemistry · doi:10.1016/j.phytochem.2019.112188 · Cited by 9
Jongsareejit, B., Tepboonrueng, P., Srisuksam, C., Yodpanan, P., Wattananukit, W., Wichienchote, N., Klamchao, K., & Amnuaykanjanasin, A. (2020) · Physiological and Molecular Plant Pathology · doi:10.1016/j.pmpp.2020.101563 · Cited by 9
Lee, N.-H., Fu, T., Shin, J.-H., Song, Y.-W., Jang, D.-C., & Kim, K. S. (2021) · The Plant Pathology Journal · doi:10.5423/ppj.oa.09.2021.0140 · Cited by 9
Anthracnose: A New Leaf Disease on Radermachera sinica (China Doll) in China
Yu, L., Lyu, C., Tang, Y., Lan, G., Li, Z., She, X., & He, Z. (2022) · Plant Disease · doi:10.1094/pdis-01-22-0072-sc · Cited by 9
Subcuticular–Intracellular Hemibiotrophy of Colletotrichum lupini in Lupinus mutabilis
Guilengue, N., Silva, M. D. C., Talhinhas, P., Neves-Martins, J., & Loureiro, A. (2022) · Plants · doi:10.3390/plants11223028 · Cited by 9
Fontenelle, M. R., Santana, M. F., Fassoni, A. C., Bazzolli, D. M. S., Brommonschenkel, S. H., de Araújo, E. F., & de Queiroz, M. V. (2016) · European Journal of Plant Pathology · doi:10.1007/s10658-016-1033-4 · Cited by 9
Garcia, E. O., Aliyeva‐Schnorr, L., Silva, A. D. O., Ghanem, S. E. D., Thor, K., Peiter, E., & Deising, H. B. (2022) · Journal of Fungi · doi:10.3390/jof8100997 · Cited by 8
Three-Dimensional Ultrastructure of Arabidopsis Cotyledons Infected with Colletotrichum higginsianum
Regmi, K. C., Ghosh, S., Koch, B. L., Neumann, U., Stein, B. D., O’Connell, R. J., & Innes, R. W. (2023) · Molecular Plant-Microbe Interactions · doi:10.1094/mpmi-05-23-0068-r · Cited by 8
Self-citationSilicon-mediated resistance in maize against infection by Colletotrichum graminicola
Mochko, A. C. R., Silva, B. N., Oliveira, L. M., Silva, L. C., & Rodrigues, F. Á. (2024) · Plant and Soil · doi:10.1007/s11104-024-06586-x · Cited by 8
Mori, A., Nakagawa, S., Suzuki, T., Suzuki, T., Gaudin, V., Matsuura, T., Ikeda, Y., & Tamura, K. (2024) · The Plant Journal · doi:10.1111/tpj.17203 · Cited by 8
Gomdola, D., Jeewon, R., McKenzie, E. H. C., Jayawardena, R. S., Al-Otibi, F. O., Tang, X., Wang, Y., Hyde, K. D., & Fu, L. (2025) · MycoKeys · doi:10.3897/mycokeys.119.152323 · Cited by 9
da Silva, M. V. N., Alexandre, A. D. S., & Núñez, C. V. (2025) · Microorganisms · doi:10.3390/microorganisms13081826 · Cited by 8
Mechanical stress induces molecular changes in oolong tea: Insights from multi-omics analysis
Hao, Z., Zhang, Y., Kong, W., Feng, J., Zheng, Y., Lin, H., Yu, X., Sun, Y., Huang, X., Wang, W., et al. (2025) · Journal of Integrative Agriculture · doi:10.1016/j.jia.2025.09.014 · Cited by 8
Huda‐Shakirah, A. R., & Mohd, M. H. (2023) · Tropical Plant Pathology · doi:10.1007/s40858-023-00561-0 · Cited by 8
Yonehara, K., Kumakura, N., Motoyama, T., Ishihama, N., Dallery, J., O’Connell, R. J., & Shirasu, K. (2023) · Molecular Plant Pathology · doi:10.1111/mpp.13378 · Cited by 8
Self-citationZhang, Z. F., Jiang, B., Yang, X., Yuan, Y., Liu, N., Ren, W., Li, P., Li, B., & Lian, S. (2023) · Tropical Plant Pathology · doi:10.1007/s40858-023-00600-w · Cited by 8
Sun, J., Zhao, J., Huang, H., Jia, J., Yuan, M., Xiao, S., & Xue, C. (2023) · Journal of Microbiological Methods · doi:10.1016/j.mimet.2023.106812 · Cited by 8
Fan, K., Qi, Y.-K., Fu, L., Li, L., Liu, X., Qu, J.-L., Li, D., Dong, A.-X., Peng, Y.-J., & Wang, Q. (2023) · Plant Disease · doi:10.1094/pdis-05-23-0967-re · Cited by 8
Ortiz-Álvarez, J., Becerra, S., Baroncelli, R., Hernández, G., Sukno, S. A., & Thon, M. R. (2024) · BMC Genomics · doi:10.1186/s12864-023-09858-5 · Cited by 8
Self-citationIsmail, M. Z. H., Mahyudin, M. M., Noran, A. S., Zambri, A. M. A., Maiden, N. A., Atan, S., & Aris, M. N. M. (2024) · Journal of Rubber Research · doi:10.1007/s42464-024-00243-9 · Cited by 8
Pillai, T. G. (2015) · Journal of Plant Pathology & Microbiology · doi:10.4172/2157-7471.1000267 · Cited by 8
Lee, Y. J., Kim, S. J., & Jeun, Y. C. (2017) · Research in Plant Disease · doi:10.5423/rpd.2017.23.1.42 · Cited by 8
Self-citationRockenbach, M. F., Velho, A. C., Alaniz, S., & Stadnik, M. J. (2018) · Tropical Plant Pathology · doi:10.1007/s40858-018-0217-1 · Cited by 8
Santos, C., da Silva, B. N. S., Ferreira, A. F. T. A. F. E., Santos, C. R., Lima, N., & Bentes, J. L. D. S. (2020) · Journal of Fungi · doi:10.3390/jof6030123 · Cited by 8
A 3D Printed Device for Easy and Reliable Quantification of Fungal Chemotropic Growth
Schunke, C., Pöggeler, S., & Nordzieke, D. E. (2020) · Frontiers in Microbiology · doi:10.3389/fmicb.2020.584525 · Cited by 8
Groth, A., Schunke, C., Reschka, E. J., Pöggeler, S., & Nordzieke, D. E. (2021) · Journal of Fungi · doi:10.3390/jof7070580 · Cited by 8
Enemy or ally: a genomic approach to elucidate the lifestyle of Phyllosticta citrichinaensis
Buijs, V. A., Groenewald, J. Z., Haridas, S., LaButti, K. M., Lipzen, A., Martin, F. M., Barry, K., Grigoriev, I. V., Crous, P. W., & Seidl, M. F. (2022) · G3 Genes Genomes Genetics · doi:10.1093/g3journal/jkac061 · Cited by 8
(PLH), E. P. O. P. H., Bragard, C., Baptista, P. C., Chatzivassiliou, E. K., Serio, F. D., Gonthier, P., Miret, J. A. J., Justesen, A. F., MacLeod, A., Magnusson, C. S., et al. (2022) · EFSA Journal · doi:10.2903/j.efsa.2022.7529 · Cited by 8
Functional Genomics of Biotic and Abiotic Stresses in Phaseolus vulgaris
Caldas, D. G. G., Konzen, E. R., Recchia, G. H., Pereira, A. C., & Tsai, S. M. (2016) · InTech eBooks · doi:10.5772/62051 · Cited by 8
Signs of Silence: Small RNAs and Antifungal Responses in Arabidopsis thaliana and Zea mays
Balmer, A., Paoli, E. D., Si‐Ammour, A., Mauch‐Mani, B., & Balmer, D. (2017) · InTech eBooks · doi:10.5772/intechopen.69795 · Cited by 8
Liu, L., Wang, Y., Qiu, P., Zhang, B., Zhang, L., Wang, N., Li, Y., Gao, J., & Hsiang, T. (2020) · Mycological Progress · doi:10.1007/s11557-020-01614-3 · Cited by 8
Heo, Y. M., Oh, S., Kim, K., Han, S., Kwon, S. L., Yoo, Y., Kim, D., Khim, J. S., Kang, S., Lee, H., et al. (2021) · Frontiers in Marine Science · doi:10.3389/fmars.2021.753222 · Cited by 8
Evolutionary Mechanisms Involved in Development of Fungal Secondary Metabolite Gene Clusters
Moore, G. G., Collemare, J., Lebrun, M., & Bradshaw, R. E. (2014) · Wiley eBooks · doi:10.1002/9781118794623.ch18 · Cited by 8
Self-citationBoufleur, T. R., Júnior, N. S. M., Becerra, S., Baraldi, E., Bibiano, L. B. J., Sukno, S. A., Thon, M. R., & Baroncelli, R. (2022) · Frontiers in Plant Science · doi:10.3389/fpls.2022.1046418 · Cited by 7
Self-citationShin, Y. U., Hassan, O., & Chang, T. (2024) · Plant Disease · doi:10.1094/pdis-07-24-1486-sr · Cited by 7
Rodrigues, R. D. S., de Souza, A. Q. L., Barbosa, A. N., Santiago, S. R. S. D. S., Vasconcelos, A. D. S., Barbosa, R. D., Alves, T. C. L., da Cruz, J. C., Bentes, J. L. D. S., Bentes, J. L. D. S., et al. (2024) · Frontiers in Bioscience-Elite · doi:10.31083/j.fbe1604039 · Cited by 7
Wang, Y., Lv, Y., Han, T., Liu, Y., & Ying, J. (2025) · International Journal of Molecular Sciences · doi:10.3390/ijms26083468 · Cited by 7
Scott, B., & Mesarich, C. H. (2022) · The mycota · doi:10.1007/978-3-031-16503-0 · Cited by 7
Yadav, S., Raazi, Z., Shivaraj, S. M., Somani, D., Prashant, R., Kulkarni, A. P., Kumar, R., Biradar, S. S., Desai, S., & Kadoo, N. (2022) · Pathogens · doi:10.3390/pathogens12010001 · Cited by 7
Lv, W., Jiang, H., Li, X., Lu, Q., Wang, X., & Wang, Y. (2023) · Plant Pathology · doi:10.1111/ppa.13802 · Cited by 7
Genome Sequencing and Analysis of Nigrospora oryzae, a Rice Leaf Disease Fungus
Zhao, Q., Zhang, L., & Wu, J. (2024) · Journal of Fungi · doi:10.3390/jof10020100 · Cited by 7
Ruan, Z., Jiao, J., Zhao, J., Liu, J., Liang, C., Yang, X., Sun, Y., Tang, G., & Li, P. (2024) · BMC Genomics · doi:10.1186/s12864-024-10424-w · Cited by 7
Ghosh, S., Regmi, K. C., Stein, B. D., Chen, J., O’Connell, R. J., & Innes, R. W. (2024) · Molecular Plant-Microbe Interactions · doi:10.1094/mpmi-04-24-0045-r · Cited by 7
Self-citationKhodadadi, F., Luciano‐Rosario, D., Gottschalk, C., Jurick, W. M., & Aćimović, S. G. (2024) · Journal of Fungi · doi:10.3390/jof10070493 · Cited by 7
Xu, L., Xu, Z., Liu, J., Cui, H., Long, J., Xue, L., & Li, C. (2024) · Plant Disease · doi:10.1094/pdis-01-24-0206-re · Cited by 7
Ozbudak, E., Carrillo-Tarazona, Y., Diaz, E. A., Zambon, F. T., Rossi, L. G., Peres, N. A., Raffaele, S., & Cano, L. M. (2025) · Frontiers in Plant Science · doi:10.3389/fpls.2024.1390926 · Cited by 7
N‐Glycosylation—The Behind‐the‐Scenes ‘Manipulative Hand’ of Plant Pathogen Invasiveness
Jiang, H., Du, Y., Fu, M., & Jiao, W. (2025) · Molecular Plant Pathology · doi:10.1111/mpp.70123 · Cited by 7
PROCESO DE INFECCIÓN DE ANTRACNOSIS POR Colletotrichum truncatum EN PAPAYA MARADOL
Rojo-Báez, I., García‐Estrada, R. S., Sañudo‐Barajas, J. A., León‐Félix, J., & Allende-Molar, R. (2017) · Revista Brasileira de Fruticultura · doi:10.1590/0100-29452017379 · Cited by 7
Evolutionary Analysis of Pectin Lyases of the Genus Colletotrichum
Lara-Márquez, A., Oyama, K., Zavala-Páramo, M. G., Villa-Rivera, M. G., Conejo-Saucedo, U., & Cano-Camacho, H. (2017) · Journal of Molecular Evolution · doi:10.1007/s00239-017-9812-x · Cited by 7
Wynns, A. A., Jensen, A. B., Eilenberg, J., & Delalibera, Í. (2019) · Scientia Agricola · doi:10.1590/1678-992x-2018-0269 · Cited by 7
Fu, X., Li, X., Ren, H., Zeng, R., Wang, Z., Hu, H., Bao, J., & Que, Y. (2022) · Journal of Fungi · doi:10.3390/jof8101088 · Cited by 7
Zhu, Y., Duan, L., Zhu, C., Wang, L., He, Z., Yang, M., & Zhou, E. (2023) · International Journal of Molecular Sciences · doi:10.3390/ijms24054376 · Cited by 7
Bhadauria, V., Zhang, M., Ma, W., Yang, J., Zhao, W., & Peng, Y. (2023) · International Journal of Molecular Sciences · doi:10.3390/ijms25010198 · Cited by 7
Tanaka, E. (2015) · FEMS Microbiology Letters · doi:10.1093/femsle/fnv066 · Cited by 7
Li, H., Zhou, Y., & Zhang, Z. (2015) · Scientific Reports · doi:10.1038/srep11619 · Cited by 7
Ashwin, N. M. R., Ebinezer, L. B., Amalamol, D., Lakshana, K. V., Sundar, A. R., Malathi, P., & Viswanathan, R. (2020) · Molecular Biology Reports · doi:10.1007/s11033-020-05944-z · Cited by 7
Zhu, J., Jeong, J. S., & Khang, C. H. (2021) · Molecular Plant Pathology · doi:10.1111/mpp.13038 · Cited by 7
Irieda, H., & Takano, Y. (2016) · Physiological and Molecular Plant Pathology · doi:10.1016/j.pmpp.2016.01.006 · Cited by 7
Self-citationSouza, E. S., do Vale, H. M. M., Pereira–Carvalho, R. C., Soares, W. R. D. O., Miller, R. G., & Dianese, J. C. (2017) · Mycological Progress · doi:10.1007/s11557-017-1338-5 · Cited by 7
Recent approaches on the genomic analysis of the phytopathogenic fungus Colletotrichum spp.
Carbú, M., Moraga, J., Cantoral, J. M., Collado, I. G., & Garrido, C. (2020) · Phytochemistry Reviews · doi:10.1007/s11101-019-09608-0 · Cited by 7
Lignocellulolytic Capability of Endophytic Phyllosticta sp.
Faulds, C. B. (2017) · Journal of Bacteriology and Mycology · doi:10.26420/jbacteriolmycol.2017.1047 · Cited by 7
Adhikari, T. B., Muzhinji, N., Philbrick, A. N., & Louws, F. J. (2025) · Frontiers in Microbiology · doi:10.3389/fmicb.2025.1515894 · Cited by 6
Ustilago maydis disrupts carbohydrate signaling networks to induce hypertrophy in host cells
Lee, Y. J., Zhang, D., Stolze, S. C., Saridis, G. I., Ebert, M. K., Nakagami, H., & Doehlemann, G. (2026) · Nature Communications · doi:10.1038/s41467-026-69532-8 · Cited by 6
Self-citationAdhitya, R., Miranti, M., Jefferson, T. A., Albert, M., Joshi, R. C., Mispan, M. S., Prismantoro, D., Abdullah, N. S., Alizadeh, M., Hermawan, W., et al. (2026) · Plant Signaling & Behavior · doi:10.1080/15592324.2026.2691464 · Cited by 6
Arizpe, A. S., Cepeda, M. E. G., Arispe-Vázquez, J. L., Velázquez, R. G., Badillo, M. E. V., & Bautista, A. A. (2021) · Australian Journal of Crop Science · doi:10.21475/ajcs.21.15.08.p3347 · Cited by 6
Padmathilake, K. R. E., & Fernando, W. G. D. (2022) · International Journal of Molecular Sciences · doi:10.3390/ijms23073964 · Cited by 6
Genome Sequence Resource of a Colletotrichum graminicola Field Strain from China
Shi, X., Xia, X., Mei, J., Gong, Z., Zhang, J., Xiao, Y., Duan, C., & Liu, W. (2023) · Molecular Plant-Microbe Interactions · doi:10.1094/mpmi-10-22-0210-a · Cited by 6
Self-citationGroß, M., Dika, B., Loos, E., Aliyeva‐Schnorr, L., & Deising, H. B. (2024) · Molecular Microbiology · doi:10.1111/mmi.15242 · Cited by 6
Sun, J., Zhao, J., Liu, M., Li, J., Cheng, J., Li, W., Yuan, M., Xiao, S., & Xue, C. (2024) · Molecular Plant Pathology · doi:10.1111/mpp.13444 · Cited by 6
Yang, R., Li, Y., Zhao, H., Sun, X., Chen, W., Li, P., Li, X., Wu, C., Ma, M., & Gong, G. (2024) · Journal of Fungi · doi:10.3390/jof10110799 · Cited by 6
Essential oils control anthracnose in pepper seeds
do Nascimento, D. M., dos Santos, P. L., Ribeiro‐Júnior, M. R., Sartori, M. M. P., & Kronka, A. Z. (2020) · Research Society and Development · doi:10.33448/rsd-v9i10.9028 · Cited by 6
Pectinolytic arsenal of Colletotrichum lindemuthianum and other fungi with different lifestyles
da Silva, L. L., Morgan, T., Garcia, E. A., Rosa, R. O., Mendes, T. A. D. O., & de Queiroz, M. V. (2022) · Journal of Applied Microbiology · doi:10.1111/jam.15692 · Cited by 6
dos Santos, G. R., de Moraes, A. J. G., Cavalcante, A. D. P. D. S., & da Silva, G. B. (2022) · Journal of General Plant Pathology · doi:10.1007/s10327-022-01059-4 · Cited by 6
Liang, X., Li, B., Zhao, X., Yao, L., Kong, Y., Liu, W., Zhang, R., & Sun, G. (2022) · Phytopathology · doi:10.1094/phyto-01-22-0037-r · Cited by 6
Guan, X., Song, M., Lu, J., Yang, H. Y., Li, X., Liu, W., Zhang, Y., Miao, W., Li, Z., & Lin, C. (2022) · Journal of Fungi · doi:10.3390/jof8101032 · Cited by 6
Wen, X., Wang, Q., Luo, H., He, C., & An, B. (2024) · Postharvest Biology and Technology · doi:10.1016/j.postharvbio.2024.112786 · Cited by 6
Metadata
- Authors
- O'Connell, R. J., Thon, M. R., Hacquard, S., Amyotte, S. G., Kleemann, J., Torres, M. F., Damm, U., Buiate, E. A., Epstein, L., Alkan, N., Altmüller, J., Alvarado-Balderrama, L., Bauser, C. A., Becker, C., Birren, B. W., Chen, Z., Choi, J., Crouch, J. A., Duvick, J. P., Farman, M. A., Gan, P., Heiman, D., Henrissat, B., Howard, R. J., Kabbage, M., Koch, C., Kracher, B., Kubo, Y., Law, A. D., Lebrun, M.-H., Lee, Y.-H., Miyara, I., Moore, N., Neumann, U., Nordström, K., Panaccione, D. G., Panstruga, R., Place, M., Proctor, R. H., Prusky, D., Rech, G., Reinhardt, R., Rollins, J. A., Rounsley, S., Schardl, C. L., Schwartz, D. C., Shenoy, N., Shirasu, K., Sikhakolli, U. R., Stüber, K., Sukno, S. A., Sweigard, J. A., Takano, Y., Takahara, H., Trail, F., van der Does, H. C., Voll, L. M., Will, I., Young, S., Zeng, Q., Zhang, J., Zhou, S., Dickman, M. B., Schulze-Lefert, P., Ver Loren van Themaat, E., Ma, L.-J., & Vaillancourt, L. J.
- Affiliations
- Universidad de Salamanca (ES)
- Max Planck Institute for Plant Breeding Research (DE)
- University of Kentucky (US)
- Royal Netherlands Academy of Arts and Sciences (NL)
- University of California, Davis (US)
- Agricultural Research Organization (IL)
- University of Cologne (DE)
- Broad Institute (US)
- GATC Biotech (Germany) (DE)
- Seoul National University (KR)
- Agricultural Research Service (US)
- DuPont (United States) (US)
- RIKEN (JP)
- Centre National de la Recherche Scientifique (FR)
- Texas A&M University (US)
- Friedrich-Alexander-Universität Erlangen-Nürnberg (DE)
- Kyoto Prefectural University (JP)
- Institut National de Recherche pour l'Agriculture, l'Alimentation et l'Environnement (FR)
- West Virginia University (US)
- University of Wisconsin–Madison (US)
- Max Planck Society (DE)
- University of Florida (US)
- Michigan State University (US)
- Kyoto University (JP)
- Corresponding author
- Vaillancourt, Lisa J
- ORCID
- Thon, Michael R
- Hacquard, Stéphane
- Damm, Ulrike
- Epstein, Lynn
- Alkan, Noam
- Altmüller, Janine
- Bauser, Christopher A
- Becker, Christian
- Birren, Bruce W
- Chen, Zehua
- Choi, Jaeyoung
- Crouch, Jo Anne
- Gan, Pamela
- Heiman, David
- Henrissat, Bernard
- Howard, Richard J
- Kabbage, Mehdi
- Kracher, Barbara
- Kubo, Yasuyuki
- Lebrun, Marc-Henri
- Lee, Yong-Hwan
- Moore, Neil
- Neumann, Ulla
- Nordström, Karl
- Panaccione, Daniel G
- Panstruga, Ralph
- Place, Michael
- Proctor, Robert H
- Prusky, Dov
- Rech, Gabriel
- Reinhardt, Richard
- Rollins, Jeffrey A
- Rounsley, Steve
- Schardl, Christopher L
- Schwartz, David C
- Shirasu, Ken
- Sukno, Serenella A
- Takano, Yoshitaka
- Takahara, Hiroyuki
- Trail, Frances
- Voll, Lars M
- Young, Sarah
- Zeng, Qiandong
- Zhang, Jingze
- Zhou, Shiguo
- Dickman, Martin B
- Ma, Li-Jun
- Vaillancourt, Lisa J
- Venue
- Nature Genetics
- Published
- 2012-08-12
- Volume
- 44
- Issue
- 9
- Pages
- 1060-1065
- ISSN
- 1061-4036 (ISSN-L)
- 1546-1718
- PMC
- PMC9754331
- OpenAlex
- W2003266704
- Cited by
- 1,047
- References
- 63
- Citations by year
- 2026: 61 · 2025: 79 · 2024: 77 · 2023: 85 · 2022: 97 · 2021: 107 · 2020: 67 · 2019: 65 · 2018: 77 · 2017: 73 · 2016: 82 · 2015: 67 · 2014: 61 · 2013: 43 · 2012: 6
- FWCI
- 26.83
- Type
- journal article
- Language
- en
- Open access
- hybrid
- doi.org
- Licence
- Locations
- Nature Genetics (publishedVersion, cc-by-nc-sa)
- PubMed Central (publishedVersion, cc-by-nc-sa)
- PubMed (publishedVersion)
- MDC Repository (Max-Delbrueck-Center for Molecular Medicine) (acceptedVersion)
- HAL AMU (submittedVersion, other-oa)
- Data Archiving and Networked Services (DANS) (submittedVersion)
- RWTH Publications (RWTH Aachen) (submittedVersion)
- KNAW Research Portal (The Royal Netherlands Academy of Arts and Sciences) (submittedVersion)
- MPG.PuRe (Max Planck Society) (submittedVersion)
- Funders
- U.S. Department of Agriculture
- University of Kentucky
- Deutsche Forschungsgemeinschaft (SPP1212)
- Max-Planck-Gesellschaft
- Ministerio de Ciencia e Innovación
- Cooperative State Research, Education, and Extension Service (20093445720125, 2007-35600-17829)
- Topics
- Life Sciences › Agricultural and Biological Sciences › Plant Science › Plant Pathogens and Fungal Diseases
- Life Sciences › Agricultural and Biological Sciences › Plant Science › Plant Disease Resistance and Genetics
- Life Sciences › Agricultural and Biological Sciences › Plant Science › Plant-Microbe Interactions and Immunity
- Keywords
- Colletotrichum higginsianum, Colletotrichum graminicola, plant pathogenic fungi, secreted effectors, pectin-degrading enzymes, hydrolytic enzymes, gene expression profiling, host-pathogen interaction, Arabidopsis thaliana, maize, comparative genomics
- MeSH terms
- Mitosporic Fungi, Models, Biological, Phylogeny, Plant Diseases, Gene Expression Regulation, Fungal, Cluster Analysis, Genome, Fungal, Arabidopsis, Sequence Analysis, DNA, Gene Expression Regulation, Developmental, Colletotrichum, Gene Expression Profiling, Host-Pathogen Interactions, Transcriptome
About these checks
Registry, retraction, Cites and statistics results are computed, not judged, with one exception: a printed reference that no index lists is read once by a model before it counts as a citation error. Claims are extracted by a model and kept only when their quote appears verbatim in the text; each cited source is then checked, with a model’s help, for whether it says what the claim relies on. Those verdicts can be wrong — read the claim’s quote and the cited source before relying on one.
Statistics and arithmetic are recomputed, not judged.
Confidence bands are shown only for fields calibrated on our annotated test set. None is calibrated yet, so no band is shown.
What counts as a claim ›How we measure confidence ›How we check this ›
Are you an author, or do you see a problem with this page? Request a review
