

The DOI matches its Crossref record; 66 of the 66 references it cites were found in a registry or an index; 3 of the 5 sources its claims cite were checked for support.
Blockade of STING Activation Alleviates Microglial Dysfunction and a Broad Spectrum of Alzheimer's Disease Pathologies
Open accessAbstract
Abnormal glial activation promotes neurodegeneration in Alzheimer’s disease (AD), the most common cause of dementia. Stimulation of the cGAS-STING pathway induces microglial dysfunction and sterile inflammation, which exacerbates AD. We showed that inhibiting STING activation can control microglia and ameliorate a wide spectrum of AD symptoms. The cGAS-STING pathway is required for the detection of ectopic DNA and the subsequent immune response. Amyloid-β (Aβ) and tau induce mitochondrial stress, which causes DNA to be released into the cytoplasm of microglia. cGAS and STING are highly expressed in Aβ plaque-associated microglia, and neuronal STING is upregulated in the brains of AD model animals. The presence of the APOE ε4 allele, an AD risk factor, also upregulated both proteins. STING activation was necessary for microglial NLRP3 activation, proinflammatory responses, and type-I-interferon responses. Pharmacological STING inhibition reduced a wide range of AD pathogenic features in App NL-G-F /hTau double-knock-in mice. An unanticipated transcriptome shift in microglia reduced gliosis and cerebral inflammation. Significant reductions in the Aβ load, tau phosphorylation, and microglial synapse engulfment prevented memory loss. To summarize, our study describes the pathogenic mechanism of STING activation as well as its potential as a therapeutic target in AD.
Overview
AI snapshot
Written from the paper’s full text.
TL;DR
In AD model mice and human iPSC-derived microglia, Aβ, tau, and APOE ε4 activate cGAS-STING, and STING is required for microglial inflammatory, type-I-IFN, and NLRP3 responses. Pharmacological STING inhibition with H-151 in AppNL-G-F/hTau double-knock-in mice reduced gliosis, Aβ burden, tau phosphorylation, synaptic engulfment, and memory impairment.
Key findings
- cGAS and STING were increased in AppNL-G-F, ADLPAPP/PS1, and AppNL-G-F/hTau dKI brains; cGAMP was significantly elevated in AppNL-G-F cortex (N = 6,6), and cGAS/STING were highly expressed in Aβ plaque-associated microglia.
- Aβ and tau increased cytoplasmic dsDNA in primary microglia; Aβ induced a proinflammatory followed by type-I-IFN response, while tau induced a type-I-IFN-skewed response. H-151 blocked persistent proinflammatory/IFN responses, iNOS, p-STAT1, ISG15, and NLRP3/IL-1β maturation.
- APOE ε4/ε4 iMGs had almost twice the cGAS and STING protein levels of ε3/ε3 iMGs without stimulation; STING-KO ε4 iMGs tended to abrogate higher IFNB1/TNFA expression.
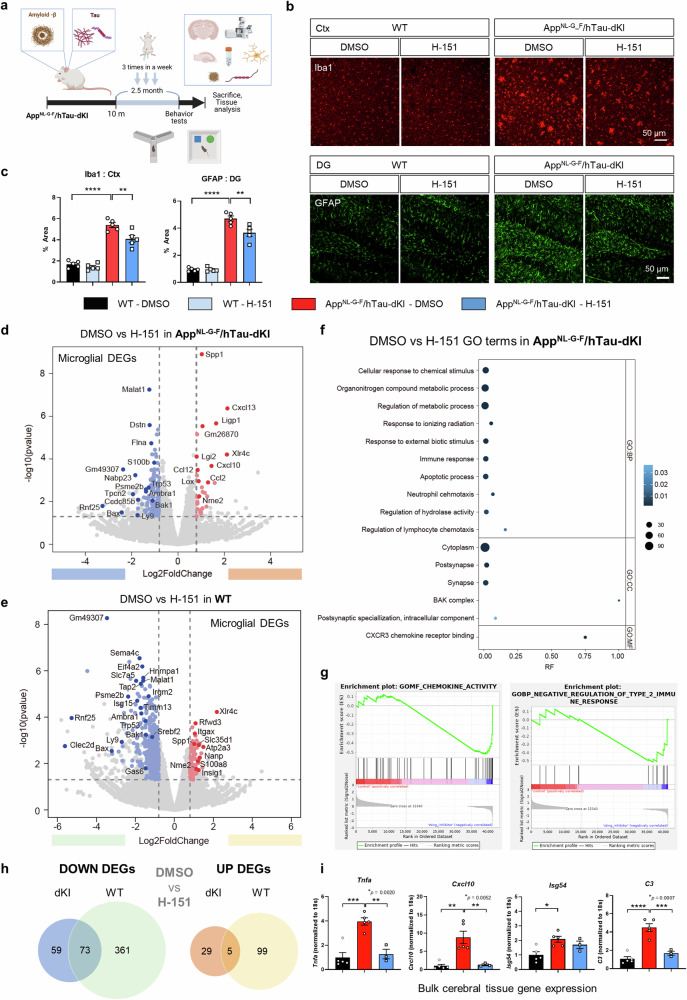
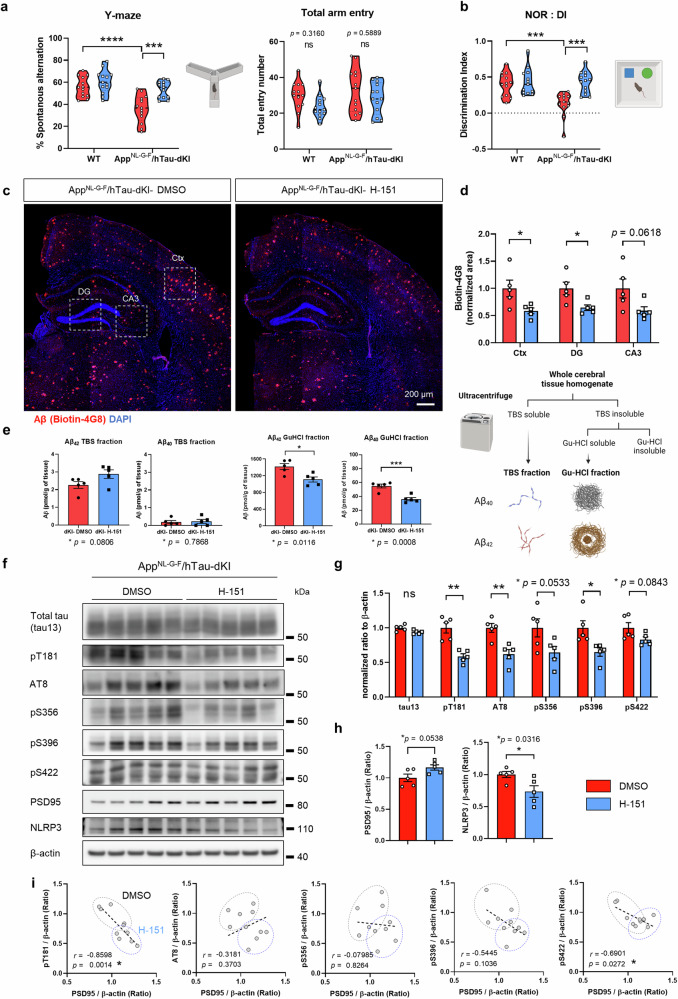
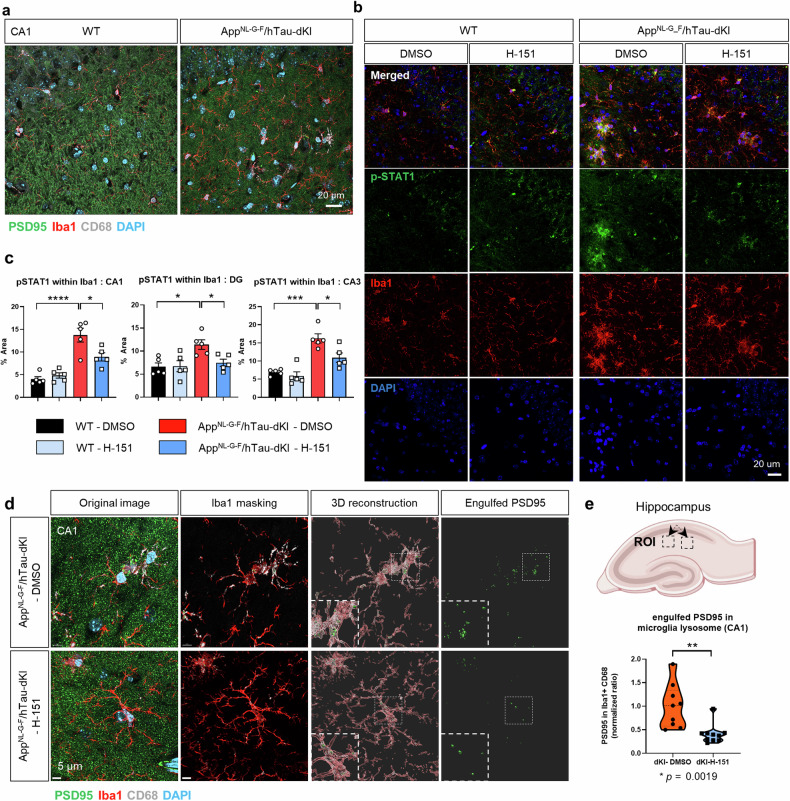
- In 10-month dKI mice, H-151 for 2.5 months reduced Iba1+ and GFAP+ areas, Aβ plaque coverage, Gu-HCl-soluble Aβ40/Aβ42, p-tau at pT181, AT8, pS356, pS396, and pS422, microglial p-STAT1, and PSD95 engulfment, and improved Y-maze and novel object recognition performance (n = 13 per group). Microglial RNA-seq found 34 upregulated and 132 downregulated genes in dKI mice, 434 upregulated genes in WT mice, 5 shared upregulated and 73 shared downregulated transcripts, and 78 STING-dependent microglial genes.
Methods
- Female AppNL-G-F knock-in and AppNL-G-F/hTau double-knock-in C57BL/6 mice were used; 10-month-old dKI mice received intraperitoneal H-151 at 210 μg (7 mg/kg) three times weekly for 2.5 months. Primary microglia/neurons and human APOE ε3/ε4 iPSC-derived microglia-like cells, including CRISPR STING knockout, were also studied.
- Main assays included immunoblotting, immunofluorescence, Aβ fractionation/ELISA, cGAMP ELISA, cytoplasmic dsDNA PicoGreen measurement, CD11b+ microglia isolation with RNA-seq (DESeq2, GO, GSEA), and Y-maze/NOR behavioral tests.
- Statistics used unpaired Student’s t-test, one-way or two-way ANOVA with Tukey’s multiple-comparisons test, or Mann-Whitney test; p ≤ 0.05 was considered significant.
Limitations
- Stated: the cause of increased neuronal STING in the AD brain remains to be determined; H-151 was given intraperitoneally for 2.5 months, so chronic or peripheral effects may have contributed; the relationship between cGAS-STING and T-cell infiltration was not directly addressed and requires further systematic analysis.
- Stated: pharmacological STING inhibition unexpectedly increased some chemokines and interferon-stimulated genes in dKI microglia, and it is difficult to determine why Cxcl10 and a few other genes were elevated.
- Evident: in vivo experiments used female mice only, and the study relies on mouse models and iPSC-derived microglia rather than human AD brain tissue validation.
Model-written summary. Check it against the paper before relying on it.
Integrity signals
Registry
Cites
Statistics
Figures
Verification
Claims the paper makes
101 Own result · 17 Own interpretation · 6 No basis given · 2 Supported · 1 Supported so far · 1 No full text of the sources
A result the paper reports from its own data — it cites no other source for it, so there is none to check. The quote shows it is in the paper.
In the paper
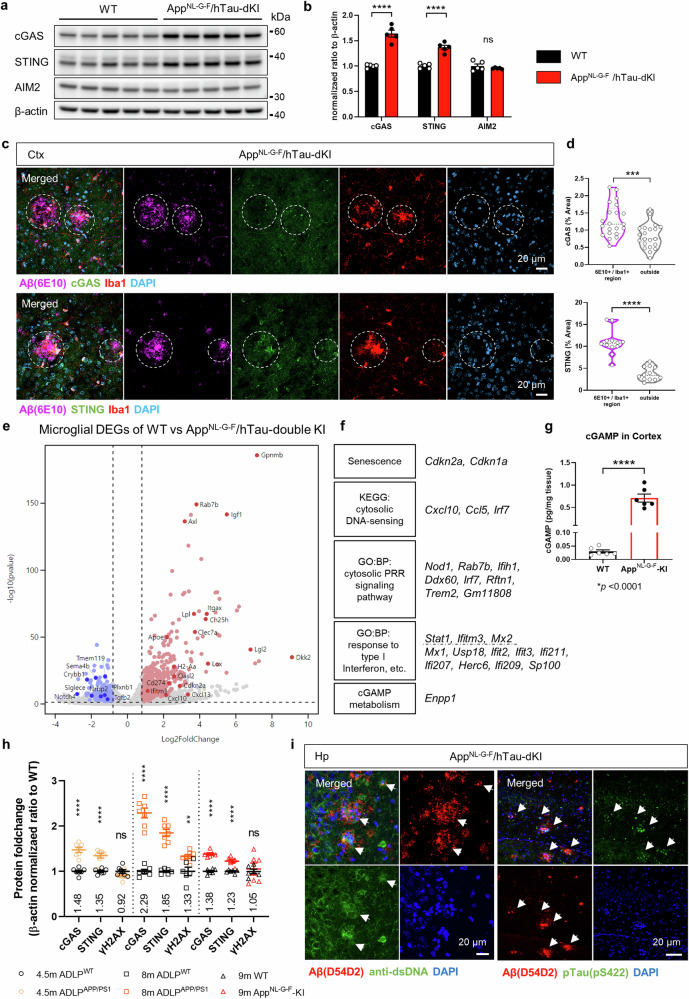
“cGAS and STING were more highly expressed in ADLPAPP/PS1 mice than in AppNL-G-F mice at similar ages, with a pattern similar to that of amyloidosis.”
§ Blockade of STING activation alleviates microglial dysfunction and a broad spectrum of Alzheimer’s disease pathologies > Results > The cGAS-STING pathway is activated by diverse AD pathologies and risk factors
plaincorrelational- Asserted: passes — The authors put it forward as true.
- Checkable: passes — It can be checked against evidence.
- Load-bearing: unclear — It is unclear whether the paper’s conclusions depend on it.
- Based: passes — The paper gives a reason why it holds.
A result the paper reports from its own data — it cites no other source for it, so there is none to check. The quote shows it is in the paper.
In the paper
“Pharmacological STING inhibition reduced a wide range of AD pathogenic features in AppNL-G-F/hTau double-knock-in mice.”
§ Blockade of STING activation alleviates microglial dysfunction and a broad spectrum of Alzheimer’s disease pathologies > Abstract
plaindirect- Asserted: passes — The authors put it forward as true.
- Checkable: passes — It can be checked against evidence.
- Load-bearing: passes — The paper’s conclusions depend on it.
- Based: passes — The paper gives a reason why it holds.
A result the paper reports from its own data — it cites no other source for it, so there is none to check. The quote shows it is in the paper.
In the paper
“Aβ and tau induced different profiles of GAS-STING downstream activation.”
§ Blockade of STING activation alleviates microglial dysfunction and a broad spectrum of Alzheimer’s disease pathologies > Results > Aβ and tau increased cytoplasmic DNA levels and induced distinct activation of microglia, which is dependent on STING
plaindirect- Asserted: passes — The authors put it forward as true.
- Checkable: passes — It can be checked against evidence.
- Load-bearing: passes — The paper’s conclusions depend on it.
- Based: passes — The paper gives a reason why it holds.
A result the paper reports from its own data — it cites no other source for it, so there is none to check. The quote shows it is in the paper.
In the paper
“we further utilized AppNL-G-F/hTau-dKI mice and found the same expression patterns”
§ Blockade of STING activation alleviates microglial dysfunction and a broad spectrum of Alzheimer’s disease pathologies > Results > The cGAS-STING pathway is activated by diverse AD pathologies and risk factors
plaincorrelational- Asserted: passes — The authors put it forward as true.
- Checkable: passes — It can be checked against evidence.
- Load-bearing: passes — The paper’s conclusions depend on it.
- Based: passes — The paper gives a reason why it holds.
A result the paper reports from its own data — it cites no other source for it, so there is none to check. The quote shows it is in the paper.
In the paper
“The presence of the APOE ε4 allele, an AD risk factor, also upregulated both proteins.”
- Also stated in: § STING knockout reversed the reduced reactivity of APOE ε4 human iPSC-derived microglia · plain
“the levels of the cGAS and STING proteins were almost twice as high in APOE ε4/ε4 iMGs than in ε3/ε3 iMGs in the absence of any stimulation”
§ Blockade of STING activation alleviates microglial dysfunction and a broad spectrum of Alzheimer’s disease pathologies > Abstract
plaindirect- Asserted: passes — The authors put it forward as true.
- Checkable: passes — It can be checked against evidence.
- Load-bearing: passes — The paper’s conclusions depend on it.
- Based: passes — The paper gives a reason why it holds.
- Rests on an assumption: APOE ε4 is the single strongest genetic risk factor for late-onset AD.
- Also stated in: § STING knockout reversed the reduced reactivity of APOE ε4 human iPSC-derived microglia · plain
A result the paper reports from its own data — it cites no other source for it, so there is none to check. The quote shows it is in the paper.
In the paper
“cGAS and STING protein levels were significantly increased in the brains of two independent AD model mice, AppNL-G-F and ADLPAPP/PS1 mice.”
§ Blockade of STING activation alleviates microglial dysfunction and a broad spectrum of Alzheimer’s disease pathologies > Results > The cGAS-STING pathway is activated by diverse AD pathologies and risk factors
plaincorrelationaln = 2- Asserted: passes — The authors put it forward as true.
- Checkable: passes — It can be checked against evidence.
- Load-bearing: passes — The paper’s conclusions depend on it.
- Based: passes — The paper gives a reason why it holds.
A result the paper reports from its own data — it cites no other source for it, so there is none to check. The quote shows it is in the paper.
In the paper
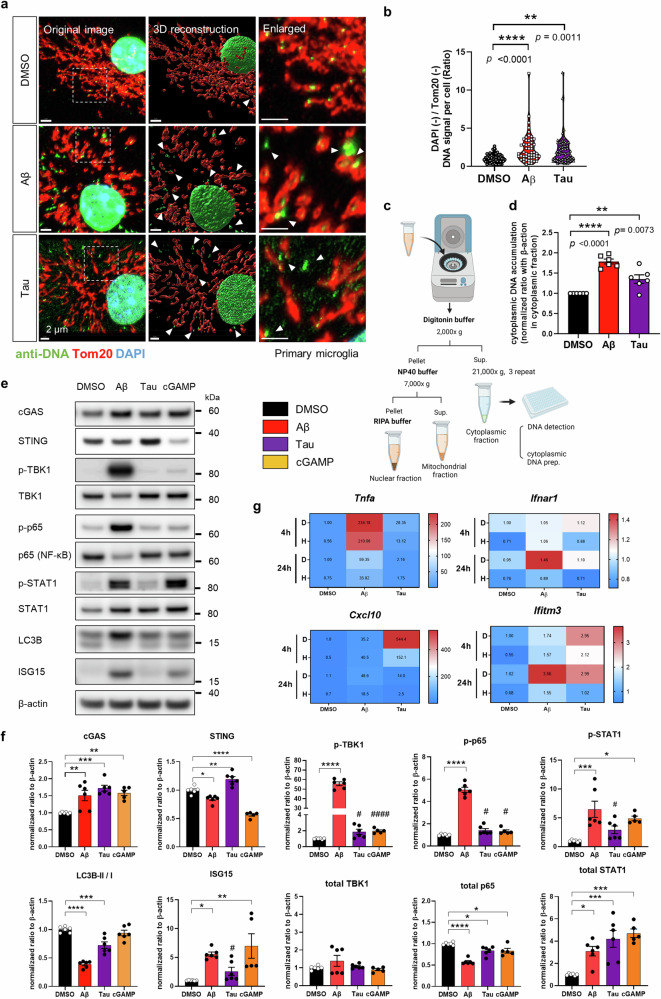
“In particular, donut- and oval-shaped mitochondria were mainly observed after Aβ treatment.”
§ Blockade of STING activation alleviates microglial dysfunction and a broad spectrum of Alzheimer’s disease pathologies > Results > Aβ and tau increased cytoplasmic DNA levels and induced distinct activation of microglia, which is dependent on STING
plaindirect- Asserted: passes — The authors put it forward as true.
- Checkable: passes — It can be checked against evidence.
- Load-bearing: unclear — It is unclear whether the paper’s conclusions depend on it.
- Based: passes — The paper gives a reason why it holds.
A result the paper reports from its own data — it cites no other source for it, so there is none to check. The quote shows it is in the paper.
In the paper
“Moreover, there were no significant changes in the γH2AX levels in the brains of 9-month-old AppNL-G-F mice.”
§ Blockade of STING activation alleviates microglial dysfunction and a broad spectrum of Alzheimer’s disease pathologies > Results > The cGAS-STING pathway is activated by diverse AD pathologies and risk factors
plain- Asserted: passes — The authors put it forward as true.
- Checkable: passes — It can be checked against evidence.
- Load-bearing: passes — The paper’s conclusions depend on it.
- Based: passes — The paper gives a reason why it holds.
A result the paper reports from its own data — it cites no other source for it, so there is none to check. The quote shows it is in the paper.
In the paper
“Microglia in the brains of dKI mice exhibited typical neurodegenerative transcriptomic features, such as downregulation of the homeostatic gene Tmem119 and upregulation of scavenging receptors (Trem2, Clec7a, and Axl) and genes associated with immune activation (Itgax, Ccl6, and Cxcl10) and lipid metabolism (ApoE and Lpl)”
§ Blockade of STING activation alleviates microglial dysfunction and a broad spectrum of Alzheimer’s disease pathologies > Results > The cGAS-STING pathway is activated by diverse AD pathologies and risk factors
plaincorrelational- Asserted: passes — The authors put it forward as true.
- Checkable: passes — It can be checked against evidence.
- Load-bearing: passes — The paper’s conclusions depend on it.
- Based: passes — The paper gives a reason why it holds.
A result the paper reports from its own data — it cites no other source for it, so there is none to check. The quote shows it is in the paper.
In the paper
“Consistently, the transcript levels of cGAS-STING pathway members were increased in microglia.”
§ Blockade of STING activation alleviates microglial dysfunction and a broad spectrum of Alzheimer’s disease pathologies > Results > The cGAS-STING pathway is activated by diverse AD pathologies and risk factors
plaincorrelational- Asserted: passes — The authors put it forward as true.
- Checkable: passes — It can be checked against evidence.
- Load-bearing: passes — The paper’s conclusions depend on it.
- Based: passes — The paper gives a reason why it holds.
- It may state two separate claims as one. 41
- Probably not a substantial claim. 5
- The quote only partly states this claim. 1
The sources with a verdict support this claim; the rest weren’t checked yet, have no full text we could read, or their verdicts aren’t rated yet.
In the paper
“Stimulation of the cGAS-STING pathway induces microglial dysfunction and sterile inflammation, which exacerbates AD.”
§ Blockade of STING activation alleviates microglial dysfunction and a broad spectrum of Alzheimer’s disease pathologies > Abstract
What the sources say
- Not checked — no full text of the sourcecites [19] Xie, X. et al. Activation of innate immune cGAS-STING pathway contributes to Alzheimer’s pathogenesis in 5×FAD mice. Nat. Aging 3, 202–212 (2023). source
- Supportedcites [20] Udeochu, J. C. et al. Tau activation of microglial cGAS-IFN reduces MEF2C-mediated cognitive resilience. Nat. Neurosci. 26, 737–750 (2023). source
The Discussion reports that deleting Cgas in tau-stimulated microglia reduced IFN and inflammatory signaling and describes the resulting microglial response as disease-enhancing. The Abstract reports protection against tau-associated synaptic and cognitive deficits after Cgas deletion and describes the pathway as a maladaptive innate immune response relevant to AD-related dementia. This supports the claim as a broad paraphrase, although the paper's direct protective-effect experiments were in mice with tauopathy. (LLM, conf=0.86)
plaindirect- Asserted: passes — The authors put it forward as true.
- Checkable: passes — It can be checked against evidence.
- Load-bearing: passes — The paper’s conclusions depend on it.
- Based: passes — The paper gives a reason why it holds.
It may state two separate claims as one.
- Rests on an assumption: Abnormal immune activation is a consistent feature of neurodegenerative diseases, including AD.
Every source the paper cites for this claim was checked and supports it.
In the paper
“Potential ex vivo activation was inhibited as described in a previous study25 (Supplementary Fig. 7c).”
§ Blockade of STING activation alleviates microglial dysfunction and a broad spectrum of Alzheimer’s disease pathologies > Results > Pharmacological STING inhibition mitigated brain inflammation with unexpected microglial transcriptomic changes
What the sources say
- Supportedcites [25] Marsh, S. E. et al. Dissection of artifactual and confounding glial signatures by single-cell sequencing of mouse and human brain. Nat. Neurosci. 25, 306–316 (2022). source
The Discussion says that a transcriptional and translational inhibitor cocktail eliminated ex vivo activation during enzymatic digestion. The Methods section, “Inhibitor cocktail to prevent activation,” describes how the inhibitors were used, supporting the citation as a reference to the inhibition procedure. (LLM, conf=0.94)
plaindirect- Asserted: passes — The authors put it forward as true.
- Checkable: passes — It can be checked against evidence.
- Load-bearing: passes — The paper’s conclusions depend on it.
- Based: passes — The paper gives a reason why it holds.
Probably not a substantial claim.
- Supported
Every source the paper cites for this claim was checked and supports it.
In the paper
“the interferon-responsive microglial state has been steadily reported, and this state is not an artifact of ex vivo activation25.”
§ Blockade of STING activation alleviates microglial dysfunction and a broad spectrum of Alzheimer’s disease pathologies > Results > Pharmacological STING inhibition mitigated brain inflammation with unexpected microglial transcriptomic changes
What the sources say
- Supportedcites [25] Marsh, S. E. et al. Dissection of artifactual and confounding glial signatures by single-cell sequencing of mouse and human brain. Nat. Neurosci. 25, 306–316 (2022). source
In Results (“scRNA-seq reveals that mouse microglia are highly sensitive to ex vivo alterations”; page unavailable), the paper identifies an interferon-responsive microglial cluster separately from the cluster it calls ex vivo ‘activated’ microglia (exAM). It describes exAM, rather than the interferon-responsive cluster, as strongly enriched after enzymatic digestion without inhibitors. (LLM, conf=0.85)
plain- Asserted: passes — The authors put it forward as true.
- Checkable: passes — It can be checked against evidence.
- Load-bearing: fails — The paper’s conclusions may not depend on it.
- Based: passes — The paper gives a reason why it holds.
Probably not a substantial claim. The paper’s conclusions may not depend on it.
- Supported
A result the paper reports from its own data — it cites no other source for it, so there is none to check. The quote shows it is in the paper.
In the paper
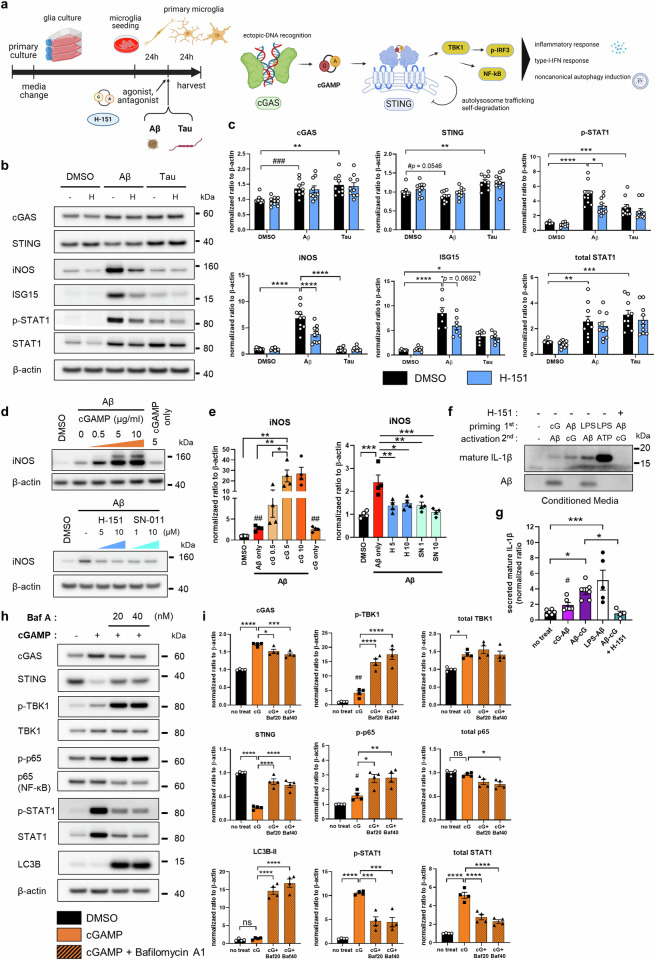
“STING activation was necessary for microglial NLRP3 activation, proinflammatory responses, and type-I-interferon responses.”
- Also stated in: § Aβ and tau increased cytoplasmic DNA levels and induced distinct activation of microglia, which is dependent on STING · plain
“In summary, NLRP3 activation and proinflammatory and interferon responses are mitigated by targeting STING.”
§ Blockade of STING activation alleviates microglial dysfunction and a broad spectrum of Alzheimer’s disease pathologies > Abstract
plaindirect- Asserted: passes — The authors put it forward as true.
- Checkable: passes — It can be checked against evidence.
- Load-bearing: passes — The paper’s conclusions depend on it.
- Based: passes — The paper gives a reason why it holds.
It may state two separate claims as one.
- Also stated in: § Aβ and tau increased cytoplasmic DNA levels and induced distinct activation of microglia, which is dependent on STING · plain
A result the paper reports from its own data — it cites no other source for it, so there is none to check. The quote shows it is in the paper.
In the paper
“The senescence marker genes (Cdkn1a, Cdkn2a) and cGAS-STING pathway downstream response genes (Irf7, Stat1, Ifitm3, Cxcl10) were upregulated in dKI microglia, and the expression of the cGAMP-degrading enzyme Enpp1 was also upregulated”
§ Blockade of STING activation alleviates microglial dysfunction and a broad spectrum of Alzheimer’s disease pathologies > Results > The cGAS-STING pathway is activated by diverse AD pathologies and risk factors
plaincorrelational- Asserted: passes — The authors put it forward as true.
- Checkable: passes — It can be checked against evidence.
- Load-bearing: passes — The paper’s conclusions depend on it.
- Based: passes — The paper gives a reason why it holds.
It may state two separate claims as one.
A result the paper reports from its own data — it cites no other source for it, so there is none to check. The quote shows it is in the paper.
In the paper
“cGAS, STING and γH2AX levels were all increased in the hippocampi of 8-month-old ADLPAPP/PS1 mice.”
§ Blockade of STING activation alleviates microglial dysfunction and a broad spectrum of Alzheimer’s disease pathologies > Results > The cGAS-STING pathway is activated by diverse AD pathologies and risk factors
plaincorrelational- Asserted: passes — The authors put it forward as true.
- Checkable: passes — It can be checked against evidence.
- Load-bearing: passes — The paper’s conclusions depend on it.
- Based: passes — The paper gives a reason why it holds.
It may state two separate claims as one.
A result the paper reports from its own data — it cites no other source for it, so there is none to check. The quote shows it is in the paper.
In the paper
“However, in the brains of 4.5-month-old ADLPAPP/PS1 mice, in which cGAS and STING protein levels were already increased, γH2AX levels did not differ from those in the brains of WT mice.”
§ Blockade of STING activation alleviates microglial dysfunction and a broad spectrum of Alzheimer’s disease pathologies > Results > The cGAS-STING pathway is activated by diverse AD pathologies and risk factors
plain- Asserted: passes — The authors put it forward as true.
- Checkable: passes — It can be checked against evidence.
- Load-bearing: passes — The paper’s conclusions depend on it.
- Based: passes — The paper gives a reason why it holds.
It may state two separate claims as one.
A result the paper reports from its own data — it cites no other source for it, so there is none to check. The quote shows it is in the paper.
In the paper
“In terms of gene expression profiles, Aβ induced a proinflammatory response followed by a type-I-IFN response, while tau induced a type-I IFN-skewed response.”
§ Blockade of STING activation alleviates microglial dysfunction and a broad spectrum of Alzheimer’s disease pathologies > Results > Aβ and tau increased cytoplasmic DNA levels and induced distinct activation of microglia, which is dependent on STING
plaindirect- Asserted: passes — The authors put it forward as true.
- Checkable: passes — It can be checked against evidence.
- Load-bearing: passes — The paper’s conclusions depend on it.
- Based: passes — The paper gives a reason why it holds.
It may state two separate claims as one.
A result the paper reports from its own data — it cites no other source for it, so there is none to check. The quote shows it is in the paper.
In the paper
“TBK1 and p65 phosphorylation were strongly activated by Aβ, but their phosphorylation was mild in tau-treated microglia.”
§ Blockade of STING activation alleviates microglial dysfunction and a broad spectrum of Alzheimer’s disease pathologies > Results > Aβ and tau increased cytoplasmic DNA levels and induced distinct activation of microglia, which is dependent on STING
boosteddirect- Asserted: passes — The authors put it forward as true.
- Checkable: passes — It can be checked against evidence.
- Load-bearing: unclear — It is unclear whether the paper’s conclusions depend on it.
- Based: passes — The paper gives a reason why it holds.
It may state two separate claims as one.
A result the paper reports from its own data — it cites no other source for it, so there is none to check. The quote shows it is in the paper.
In the paper
“Immunostaining of the brains of dKI mice confirmed the presence of dsDNA and p-tau within the Aβ plaques”
§ Blockade of STING activation alleviates microglial dysfunction and a broad spectrum of Alzheimer’s disease pathologies > Results > The cGAS-STING pathway is activated by diverse AD pathologies and risk factors
plaincorrelational- Asserted: passes — The authors put it forward as true.
- Checkable: passes — It can be checked against evidence.
- Load-bearing: passes — The paper’s conclusions depend on it.
- Based: passes — The paper gives a reason why it holds.
It may state two separate claims as one.
A result the paper reports from its own data — it cites no other source for it, so there is none to check. The quote shows it is in the paper.
In the paper
“STING inhibition had a negligible effect on Aβ-induced gene expression at the early timepoint but effectively attenuated persistent proinflammatory and type I IFN responses at the 24 h timepoint.”
§ Blockade of STING activation alleviates microglial dysfunction and a broad spectrum of Alzheimer’s disease pathologies > Results > Aβ and tau increased cytoplasmic DNA levels and induced distinct activation of microglia, which is dependent on STING
plaindirect- Asserted: passes — The authors put it forward as true.
- Checkable: passes — It can be checked against evidence.
- Load-bearing: passes — The paper’s conclusions depend on it.
- Based: passes — The paper gives a reason why it holds.
It may state two separate claims as one.
A result the paper reports from its own data — it cites no other source for it, so there is none to check. The quote shows it is in the paper.
In the paper
“cGAS was upregulated by both Aβ and tau, but STING was slightly downregulated by Aβ but upregulated by tau.”
§ Blockade of STING activation alleviates microglial dysfunction and a broad spectrum of Alzheimer’s disease pathologies > Results > Aβ and tau increased cytoplasmic DNA levels and induced distinct activation of microglia, which is dependent on STING
plaindirect- Asserted: passes — The authors put it forward as true.
- Checkable: passes — It can be checked against evidence.
- Load-bearing: passes — The paper’s conclusions depend on it.
- Based: passes — The paper gives a reason why it holds.
It may state two separate claims as one.
A result the paper reports from its own data — it cites no other source for it, so there is none to check. The quote shows it is in the paper.
In the paper
“Both Aβ and tau induced IRF3 and STAT1 phosphorylation”
§ Blockade of STING activation alleviates microglial dysfunction and a broad spectrum of Alzheimer’s disease pathologies > Results > Aβ and tau increased cytoplasmic DNA levels and induced distinct activation of microglia, which is dependent on STING
plaindirect- Asserted: passes — The authors put it forward as true.
- Checkable: passes — It can be checked against evidence.
- Load-bearing: passes — The paper’s conclusions depend on it.
- Based: passes — The paper gives a reason why it holds.
It may state two separate claims as one.
A result the paper reports from its own data — it cites no other source for it, so there is none to check. The quote shows it is in the paper.
In the paper
“The brain STING protein level was inversely correlated with the PSD95 level but positively correlated with the NLRP3 level”
§ Blockade of STING activation alleviates microglial dysfunction and a broad spectrum of Alzheimer’s disease pathologies > Results > STING inhibition ameliorated AD pathology and cognitive impairment in AppNL-G-F/hTau-dKI mice
plaincorrelational- Asserted: passes — The authors put it forward as true.
- Checkable: passes — It can be checked against evidence.
- Load-bearing: unclear — It is unclear whether the paper’s conclusions depend on it.
- Based: passes — The paper gives a reason why it holds.
It may state two separate claims as one.
A result the paper reports from its own data — it cites no other source for it, so there is none to check. The quote shows it is in the paper.
In the paper
“The level of TBS-soluble Aβ42 tended to increase, but the difference was not significant”
§ Blockade of STING activation alleviates microglial dysfunction and a broad spectrum of Alzheimer’s disease pathologies > Results > STING inhibition ameliorated AD pathology and cognitive impairment in AppNL-G-F/hTau-dKI mice
hedged- Asserted: passes — The authors put it forward as true.
- Checkable: passes — It can be checked against evidence.
- Load-bearing: fails — The paper’s conclusions may not depend on it.
- Based: passes — The paper gives a reason why it holds.
Probably not a substantial claim. The paper’s conclusions may not depend on it. It may state two separate claims as one.
A result the paper reports from its own data — it cites no other source for it, so there is none to check. The quote shows it is in the paper.
In the paper
“When iMGs were stimulated with Aβ, ε4 iMGs expressed TNFA than ε3 iMGs.”
§ Blockade of STING activation alleviates microglial dysfunction and a broad spectrum of Alzheimer’s disease pathologies > Results > STING knockout reversed the reduced reactivity of APOE ε4 human iPSC-derived microglia
plaincorrelational- Asserted: passes — The authors put it forward as true.
- Checkable: passes — It can be checked against evidence.
- Load-bearing: passes — The paper’s conclusions depend on it.
- Based: passes — The paper gives a reason why it holds.
The quote only partly states this claim.
A result the paper reports from its own data — it cites no other source for it, so there is none to check. The quote shows it is in the paper.
In the paper
“In the WT mouse group, 434 genes were upregulated”
§ Blockade of STING activation alleviates microglial dysfunction and a broad spectrum of Alzheimer’s disease pathologies > Results > Pharmacological STING inhibition mitigated brain inflammation with unexpected microglial transcriptomic changes
plain- Asserted: passes — The authors put it forward as true.
- Checkable: passes — It can be checked against evidence.
- Load-bearing: fails — The paper’s conclusions may not depend on it.
- Based: passes — The paper gives a reason why it holds.
Probably not a substantial claim. The paper’s conclusions may not depend on it.
A result the paper reports from its own data — it cites no other source for it, so there is none to check. The quote shows it is in the paper.
In the paper
“but through different kinetics and the activator of different downstream kinases”
§ Blockade of STING activation alleviates microglial dysfunction and a broad spectrum of Alzheimer’s disease pathologies > Discussion
plaindirect- Asserted: passes — The authors put it forward as true.
- Checkable: passes — It can be checked against evidence.
- Load-bearing: unclear — It is unclear whether the paper’s conclusions depend on it.
- Based: passes — The paper gives a reason why it holds.
It may state two separate claims as one.
A result the paper reports from its own data — it cites no other source for it, so there is none to check. The quote shows it is in the paper.
In the paper
“brain staining revealed that the CXCL10 signal strongly overlapped with that of astrocytes and was reduced by H-151”
§ Blockade of STING activation alleviates microglial dysfunction and a broad spectrum of Alzheimer’s disease pathologies > Results > Pharmacological STING inhibition mitigated brain inflammation with unexpected microglial transcriptomic changes
boosteddirect- Asserted: passes — The authors put it forward as true.
- Checkable: passes — It can be checked against evidence.
- Load-bearing: unclear — It is unclear whether the paper’s conclusions depend on it.
- Based: passes — The paper gives a reason why it holds.
It may state two separate claims as one.
A result the paper reports from its own data — it cites no other source for it, so there is none to check. The quote shows it is in the paper.
In the paper
“STING inhibition did not change the total tau level but significantly reduced tau phosphorylation.”
§ Blockade of STING activation alleviates microglial dysfunction and a broad spectrum of Alzheimer’s disease pathologies > Results > STING inhibition ameliorated AD pathology and cognitive impairment in AppNL-G-F/hTau-dKI mice
plaindirect- Asserted: passes — The authors put it forward as true.
- Checkable: passes — It can be checked against evidence.
- Load-bearing: passes — The paper’s conclusions depend on it.
- Based: passes — The paper gives a reason why it holds.
It may state two separate claims as one.
A result the paper reports from its own data — it cites no other source for it, so there is none to check. The quote shows it is in the paper.
In the paper
“Our data showed that STING inhibition reduced Aβ aggregation and tau phosphorylation (Fig. 6c–i).”
- Also stated in: § STING inhibition ameliorated AD pathology and cognitive impairment in AppNL-G-F/hTau-dKI mice · plain
“pharmacological inhibition of STING in dKI mice significantly reduced the Aβ burden and tau hyperphosphorylation”
§ Blockade of STING activation alleviates microglial dysfunction and a broad spectrum of Alzheimer’s disease pathologies > Discussion
plaindirect- Asserted: passes — The authors put it forward as true.
- Checkable: passes — It can be checked against evidence.
- Load-bearing: passes — The paper’s conclusions depend on it.
- Based: passes — The paper gives a reason why it holds.
It may state two separate claims as one.
- Also stated in: § STING inhibition ameliorated AD pathology and cognitive impairment in AppNL-G-F/hTau-dKI mice · plain
A result the paper reports from its own data — it cites no other source for it, so there is none to check. The quote shows it is in the paper.
In the paper
“Cxcl10, Ccl12, Iigp1, Lox2, and Spp1 were highly expressed in AD microglia and further upregulated after H-151 administration”
§ Blockade of STING activation alleviates microglial dysfunction and a broad spectrum of Alzheimer’s disease pathologies > Results > Pharmacological STING inhibition mitigated brain inflammation with unexpected microglial transcriptomic changes
plaindirect- Asserted: passes — The authors put it forward as true.
- Checkable: passes — It can be checked against evidence.
- Load-bearing: unclear — It is unclear whether the paper’s conclusions depend on it.
- Based: passes — The paper gives a reason why it holds.
It may state two separate claims as one.
A result the paper reports from its own data — it cites no other source for it, so there is none to check. The quote shows it is in the paper.
In the paper
“While control dKI mice exhibited memory impairment, H-151-injected dKI mice exhibited improved memory function”
§ Blockade of STING activation alleviates microglial dysfunction and a broad spectrum of Alzheimer’s disease pathologies > Results > STING inhibition ameliorated AD pathology and cognitive impairment in AppNL-G-F/hTau-dKI mice
plaindirect- Asserted: passes — The authors put it forward as true.
- Checkable: passes — It can be checked against evidence.
- Load-bearing: passes — The paper’s conclusions depend on it.
- Based: passes — The paper gives a reason why it holds.
It may state two separate claims as one.
A result the paper reports from its own data — it cites no other source for it, so there is none to check. The quote shows it is in the paper.
In the paper
“No significant weight loss was observed after injection”
§ Blockade of STING activation alleviates microglial dysfunction and a broad spectrum of Alzheimer’s disease pathologies > Results > Pharmacological STING inhibition mitigated brain inflammation with unexpected microglial transcriptomic changes
plain- Asserted: passes — The authors put it forward as true.
- Checkable: passes — It can be checked against evidence.
- Load-bearing: fails — The paper’s conclusions may not depend on it.
- Based: passes — The paper gives a reason why it holds.
Probably not a substantial claim. The paper’s conclusions may not depend on it.
A result the paper reports from its own data — it cites no other source for it, so there is none to check. The quote shows it is in the paper.
In the paper
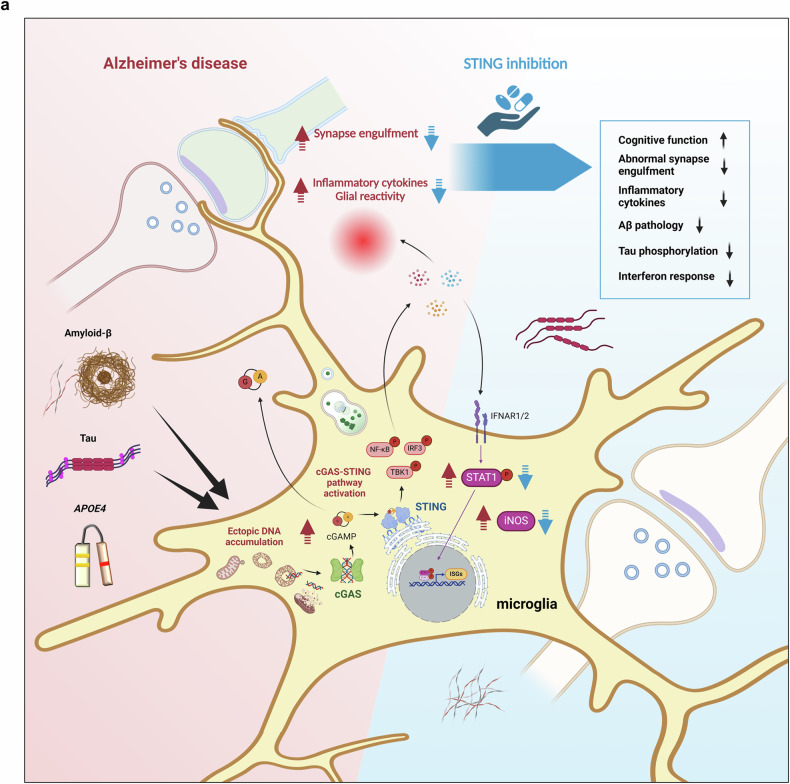
“the Aβ burden, tau hyperphosphorylation and abnormal synapse loss, which are widespread pathological features of AD, were suppressed by pharmacological STING inhibition.”
§ Blockade of STING activation alleviates microglial dysfunction and a broad spectrum of Alzheimer’s disease pathologies > Discussion
plaindirect- Asserted: passes — The authors put it forward as true.
- Checkable: passes — It can be checked against evidence.
- Load-bearing: passes — The paper’s conclusions depend on it.
- Based: passes — The paper gives a reason why it holds.
It may state two separate claims as one.
A result the paper reports from its own data — it cites no other source for it, so there is none to check. The quote shows it is in the paper.
In the paper
“Aβ-induced iNOS was upregulated by cGAMP in a dose-dependent manner, and the STING antagonists H-151 and SN-011 both robustly decreased iNOS levels”
§ Blockade of STING activation alleviates microglial dysfunction and a broad spectrum of Alzheimer’s disease pathologies > Results > Aβ and tau increased cytoplasmic DNA levels and induced distinct activation of microglia, which is dependent on STING
plaindirect- Asserted: passes — The authors put it forward as true.
- Checkable: passes — It can be checked against evidence.
- Load-bearing: passes — The paper’s conclusions depend on it.
- Based: passes — The paper gives a reason why it holds.
It may state two separate claims as one.
A result the paper reports from its own data — it cites no other source for it, so there is none to check. The quote shows it is in the paper.
In the paper
“Both Aβ and tau increased the amount of cytoplasmic mtDNA”
§ Blockade of STING activation alleviates microglial dysfunction and a broad spectrum of Alzheimer’s disease pathologies > Discussion
plaindirect- Asserted: passes — The authors put it forward as true.
- Checkable: passes — It can be checked against evidence.
- Load-bearing: passes — The paper’s conclusions depend on it.
- Based: passes — The paper gives a reason why it holds.
It may state two separate claims as one.
A result the paper reports from its own data — it cites no other source for it, so there is none to check. The quote shows it is in the paper.
In the paper
“STING was found to be strongly required for microglial proinflammatory activity, type-I-IFN responses and NLRP3 activation.”
§ Blockade of STING activation alleviates microglial dysfunction and a broad spectrum of Alzheimer’s disease pathologies > Discussion
boosteddirect- Asserted: passes — The authors put it forward as true.
- Checkable: passes — It can be checked against evidence.
- Load-bearing: passes — The paper’s conclusions depend on it.
- Based: passes — The paper gives a reason why it holds.
It may state two separate claims as one.
The paper states this without a source or data behind it here, so there is nothing to check it against. The quote shows it is in the paper.
In the paper
“Both Aβ and tau, as well as the APOE ε4 allele, were linked to increases in cGAS and STING levels in human microglia.”
§ Blockade of STING activation alleviates microglial dysfunction and a broad spectrum of Alzheimer’s disease pathologies > Discussion
plaincorrelational- Asserted: passes — The authors put it forward as true.
- Checkable: passes — It can be checked against evidence.
- Load-bearing: passes — The paper’s conclusions depend on it.
- Based: passes — The paper gives a reason why it holds.
It may state two separate claims as one.
A result the paper reports from its own data — it cites no other source for it, so there is none to check. The quote shows it is in the paper.
In the paper
“STING was required for Aβ and p-tau accumulation and microglial synapse engulfment (Fig. 8a).”
§ Blockade of STING activation alleviates microglial dysfunction and a broad spectrum of Alzheimer’s disease pathologies > Discussion
plaindirect- Asserted: passes — The authors put it forward as true.
- Checkable: passes — It can be checked against evidence.
- Load-bearing: passes — The paper’s conclusions depend on it.
- Based: passes — The paper gives a reason why it holds.
It may state two separate claims as one.
A result the paper reports from its own data — it cites no other source for it, so there is none to check. The quote shows it is in the paper.
In the paper
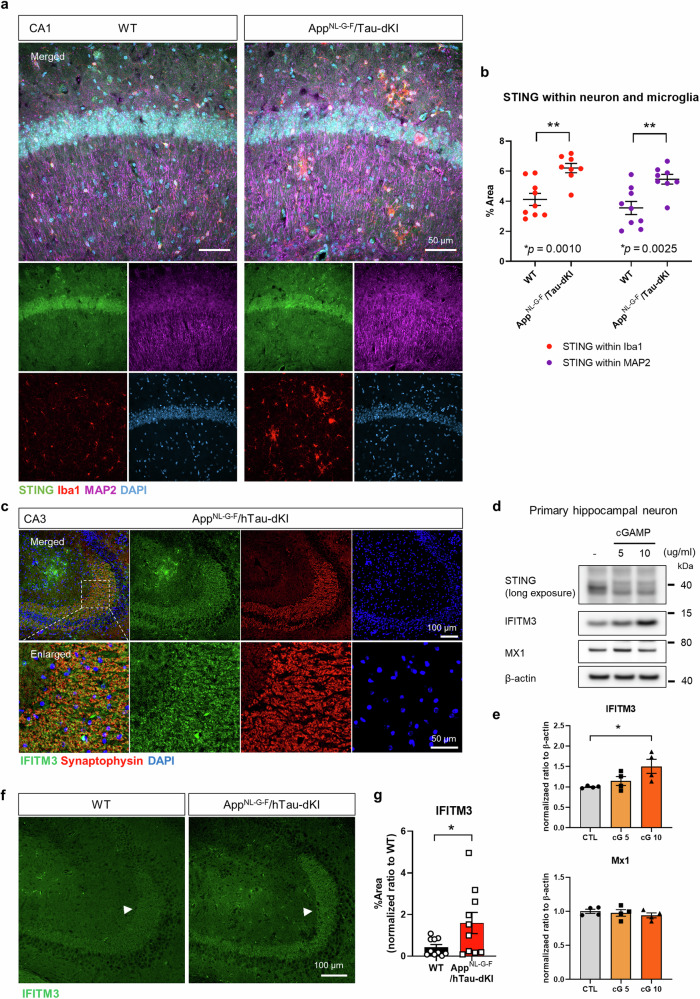
“Surprisingly, however, significant STING expression was observed in neurons but not in astrocytes in vivo”
§ Blockade of STING activation alleviates microglial dysfunction and a broad spectrum of Alzheimer’s disease pathologies > Results > Neuronal STING is upregulated in the brains of AD model mice
plain- Asserted: passes — The authors put it forward as true.
- Checkable: passes — It can be checked against evidence.
- Load-bearing: passes — The paper’s conclusions depend on it.
- Based: passes — The paper gives a reason why it holds.
It may state two separate claims as one.
A result the paper reports from its own data — it cites no other source for it, so there is none to check. The quote shows it is in the paper.
In the paper
“neurons showed an increase in IFITM3 in response to cGAMP, whereas another interferon-inducible protein, MX1, was not affected”
§ Blockade of STING activation alleviates microglial dysfunction and a broad spectrum of Alzheimer’s disease pathologies > Results > Neuronal STING is upregulated in the brains of AD model mice
plaindirect- Asserted: passes — The authors put it forward as true.
- Checkable: passes — It can be checked against evidence.
- Load-bearing: passes — The paper’s conclusions depend on it.
- Based: passes — The paper gives a reason why it holds.
It may state two separate claims as one.
A result the paper reports from its own data — it cites no other source for it, so there is none to check. The quote shows it is in the paper.
In the paper
“both iPSCs and iMGs expressed cGAS, but differences in cGAS expression were detected only in iMGs. STING expression was limited in iMGs”
§ Blockade of STING activation alleviates microglial dysfunction and a broad spectrum of Alzheimer’s disease pathologies > Results > STING knockout reversed the reduced reactivity of APOE ε4 human iPSC-derived microglia
plain- Asserted: passes — The authors put it forward as true.
- Checkable: passes — It can be checked against evidence.
- Load-bearing: unclear — It is unclear whether the paper’s conclusions depend on it.
- Based: passes — The paper gives a reason why it holds.
It may state two separate claims as one.
A result the paper reports from its own data — it cites no other source for it, so there is none to check. The quote shows it is in the paper.
In the paper
“The reduction in brain p-TBK1 levels confirmed that H-151 was able to cross the BBB and affect the brain”
§ Blockade of STING activation alleviates microglial dysfunction and a broad spectrum of Alzheimer’s disease pathologies > Results > Pharmacological STING inhibition mitigated brain inflammation with unexpected microglial transcriptomic changes
boosteddirect- Asserted: passes — The authors put it forward as true.
- Checkable: passes — It can be checked against evidence.
- Load-bearing: passes — The paper’s conclusions depend on it.
- Based: passes — The paper gives a reason why it holds.
It may state two separate claims as one.
A result the paper reports from its own data — it cites no other source for it, so there is none to check. The quote shows it is in the paper.
In the paper
“the STING inhibitor-treated mice exhibited preserved working memory and object recognition memory (Fig. 6a, b).”
§ Blockade of STING activation alleviates microglial dysfunction and a broad spectrum of Alzheimer’s disease pathologies > Discussion
plaindirect- Asserted: passes — The authors put it forward as true.
- Checkable: passes — It can be checked against evidence.
- Load-bearing: passes — The paper’s conclusions depend on it.
- Based: passes — The paper gives a reason why it holds.
It may state two separate claims as one.
A result the paper reports from its own data — it cites no other source for it, so there is none to check. The quote shows it is in the paper.
In the paper
“Higher levels of the postsynaptic component PSD95 and had lower NLRP3 levels were observed in the in brains of STING-inhibited dKI mice”
§ Blockade of STING activation alleviates microglial dysfunction and a broad spectrum of Alzheimer’s disease pathologies > Results > STING inhibition ameliorated AD pathology and cognitive impairment in AppNL-G-F/hTau-dKI mice
plaincorrelational- Asserted: passes — The authors put it forward as true.
- Checkable: passes — It can be checked against evidence.
- Load-bearing: passes — The paper’s conclusions depend on it.
- Based: passes — The paper gives a reason why it holds.
It may state two separate claims as one.
A result the paper reports from its own data — it cites no other source for it, so there is none to check. The quote shows it is in the paper.
In the paper
“In the WT mouse group, Xlr4c, Atp2a3, Rfwd3, and Insig1 were upregulated, while Malat1, Rnf25, Bax, Ly9, and Isg15 were downregulated”
§ Blockade of STING activation alleviates microglial dysfunction and a broad spectrum of Alzheimer’s disease pathologies > Results > Pharmacological STING inhibition mitigated brain inflammation with unexpected microglial transcriptomic changes
plain- Asserted: passes — The authors put it forward as true.
- Checkable: passes — It can be checked against evidence.
- Load-bearing: unclear — It is unclear whether the paper’s conclusions depend on it.
- Based: passes — The paper gives a reason why it holds.
It may state two separate claims as one.
A result the paper reports from its own data — it cites no other source for it, so there is none to check. The quote shows it is in the paper.
In the paper
“Compared to WT mice with clear dendritic PSD95 patterns, dKI mice had disrupted PSD95 patterns and microglia with an enlarged CD68+ lysosomes”
§ Blockade of STING activation alleviates microglial dysfunction and a broad spectrum of Alzheimer’s disease pathologies > Results > STING inhibition reduced microglial p-STAT1 levels and synaptic engulfment in AppNL-G-F/hTau-dKI mice
plaincorrelational- Asserted: passes — The authors put it forward as true.
- Checkable: passes — It can be checked against evidence.
- Load-bearing: passes — The paper’s conclusions depend on it.
- Based: passes — The paper gives a reason why it holds.
It may state two separate claims as one.
The paper states this without a source or data behind it here, so there is nothing to check it against. The quote shows it is in the paper.
In the paper
“successive Aβ and cGAMP treatment induced IL-1β maturation and vice versa.”
§ Blockade of STING activation alleviates microglial dysfunction and a broad spectrum of Alzheimer’s disease pathologies > Discussion
plaindirect- Asserted: passes — The authors put it forward as true.
- Checkable: passes — It can be checked against evidence.
- Load-bearing: passes — The paper’s conclusions depend on it.
- Based: passes — The paper gives a reason why it holds.
It may state two separate claims as one.
A conclusion the paper draws from its own results — it cites no other source for it, so there is none to check. The quote shows it is in the paper.
In the paper
“Thus, both Aβ and tau were able to increase ectopic DNA in the cytoplasm, while Aβ induced clear morphological changes in mitochondria.”
§ Blockade of STING activation alleviates microglial dysfunction and a broad spectrum of Alzheimer’s disease pathologies > Results > Aβ and tau increased cytoplasmic DNA levels and induced distinct activation of microglia, which is dependent on STING
boosteddirect- Asserted: passes — The authors put it forward as true.
- Checkable: passes — It can be checked against evidence.
- Load-bearing: passes — The paper’s conclusions depend on it.
- Based: passes — The paper gives a reason why it holds.
It may state two separate claims as one.
A conclusion the paper draws from its own results — it cites no other source for it, so there is none to check. The quote shows it is in the paper.
In the paper
“our data suggest that the cGAS-STING pathway is strongly involved in these phenomena.”
§ Blockade of STING activation alleviates microglial dysfunction and a broad spectrum of Alzheimer’s disease pathologies > Discussion
hedgedcorrelational- Asserted: passes — The authors put it forward as true.
- Checkable: passes — It can be checked against evidence.
- Load-bearing: passes — The paper’s conclusions depend on it.
- Based: passes — The paper gives a reason why it holds.
It may state two separate claims as one.
A conclusion the paper draws from its own results — it cites no other source for it, so there is none to check. The quote shows it is in the paper.
In the paper
“peritoneal injection of the STING inhibitor H-151 induced an unexpected shift in the brain microglial transcriptome while reducing overall glial reactivity and brain inflammation.”
§ Blockade of STING activation alleviates microglial dysfunction and a broad spectrum of Alzheimer’s disease pathologies > Results > Pharmacological STING inhibition mitigated brain inflammation with unexpected microglial transcriptomic changes
plaindirect- Asserted: passes — The authors put it forward as true.
- Checkable: passes — It can be checked against evidence.
- Load-bearing: passes — The paper’s conclusions depend on it.
- Based: passes — The paper gives a reason why it holds.
It may state two separate claims as one.
A conclusion the paper draws from its own results — it cites no other source for it, so there is none to check. The quote shows it is in the paper.
In the paper
“These results indicate that the cGAS-STING pathway may be involved in reduced ε4 microglial responsiveness and may be affected by the APOE ε4 allele in addition to Aβ, tau, and age.”
§ Blockade of STING activation alleviates microglial dysfunction and a broad spectrum of Alzheimer’s disease pathologies > Results > STING knockout reversed the reduced reactivity of APOE ε4 human iPSC-derived microglia
hedgedconditional- Asserted: passes — The authors put it forward as true.
- Checkable: passes — It can be checked against evidence.
- Load-bearing: passes — The paper’s conclusions depend on it.
- Based: passes — The paper gives a reason why it holds.
It may state two separate claims as one.
- Rests on an assumption: APOE ε4 is the single strongest genetic risk factor for late-onset AD.
A conclusion the paper draws from its own results — it cites no other source for it, so there is none to check. The quote shows it is in the paper.
In the paper
“To summarize, neuronal STING is upregulated in the brains of AD model mice, and STING activation can induce IFITM3 expression.”
§ Blockade of STING activation alleviates microglial dysfunction and a broad spectrum of Alzheimer’s disease pathologies > Results > Neuronal STING is upregulated in the brains of AD model mice
plaindirect- Asserted: passes — The authors put it forward as true.
- Checkable: passes — It can be checked against evidence.
- Load-bearing: passes — The paper’s conclusions depend on it.
- Based: passes — The paper gives a reason why it holds.
It may state two separate claims as one.
A conclusion the paper draws from its own results — it cites no other source for it, so there is none to check. The quote shows it is in the paper.
In the paper
“pharmacological inhibition of STING effectively reduced microglial p-STAT1 levels and postsynaptic engulfment, which is consistent with the results of the behavioral tests.”
§ Blockade of STING activation alleviates microglial dysfunction and a broad spectrum of Alzheimer’s disease pathologies > Results > STING inhibition reduced microglial p-STAT1 levels and synaptic engulfment in AppNL-G-F/hTau-dKI mice
plaindirect- Asserted: passes — The authors put it forward as true.
- Checkable: passes — It can be checked against evidence.
- Load-bearing: passes — The paper’s conclusions depend on it.
- Based: passes — The paper gives a reason why it holds.
It may state two separate claims as one.
A conclusion the paper draws from its own results — it cites no other source for it, so there is none to check. The quote shows it is in the paper.
In the paper
“pharmacological inhibition of STING in dKI mice significantly reduced the Aβ burden and tau hyperphosphorylation and preserved memory function.”
§ Blockade of STING activation alleviates microglial dysfunction and a broad spectrum of Alzheimer’s disease pathologies > Results > STING inhibition ameliorated AD pathology and cognitive impairment in AppNL-G-F/hTau-dKI mice
plaindirect- Asserted: passes — The authors put it forward as true.
- Checkable: passes — It can be checked against evidence.
- Load-bearing: passes — The paper’s conclusions depend on it.
- Based: passes — The paper gives a reason why it holds.
It may state two separate claims as one.
- Rests on an assumption: Hyperphosphorylated tau, rather than normal tau, contributes to synaptic dysfunction and loss.
- Rests on an assumption: Aβ-induced tau hyperphosphorylation is closely associated with synapse loss and memory impairment in AD.
The paper relies on this without support.
APOE ε4 is the single strongest genetic risk factor for late-onset AD.
“the APOE ε4 allele, the single strongest genetic risk factor for late-onset AD (LOAD)”
The paper relies on this without support.
Abnormal immune activation is a consistent feature of neurodegenerative diseases, including AD.
“Abnormal immune activation is a consistent feature of neurodegenerative diseases, including Alzheimer’s disease (AD).”
The paper relies on this without support.
The cGAS-STING pathway is a common denominator among diverse AD-associated factors.
“In searching for a common denominator among these diverse factors, we focused on the immune response against ectopic DNA and specifically the cyclic GMP-AMP synthase (cGAS)-stimulator of interferon genes (STING) pathway.”
The paper relies on this without support.
Hyperphosphorylated tau, rather than normal tau, contributes to synaptic dysfunction and loss.
“hyperphosphorylated tau, rather than normal tau, contributes to synaptic dysfunction and loss.”
The paper relies on this without support.
Aβ-induced tau hyperphosphorylation is closely associated with synapse loss and memory impairment in AD.
“Aβ-induced tau hyperphosphorylation is closely associated with synapse loss and memory impairment in AD”
The paper relies on this without support.
Both amyloid and tau are key players in AD pathogenesis, and their interaction results in different outcomes than those induced by each factor individually.
“Both amyloid and tau are key players in AD pathogenesis, and their interaction results in different outcomes than those induced by each factor individually.”
The paper relies on this without support.
Pharmacological targeting or genetic ablation of cGAS and STING tends to be protective in diverse neural disorders.
“Pharmacological targeting or genetic ablation of cGAS and STING tends to be protective in diverse neural disorders.”
The paper relies on this without support.
Maturation of IL-1β is dependent on NLRP3 activation.
“The maturation of IL-1β is dependent on NLRP3 activation”
The paper relies on this without support.
STING activation leads to NLRP3 inflammasome activation.
“STING activation leads to NLRP3 inflammasome activation.”
The paper relies on this without support.
Aβ can activate TLR4, which is located upstream of TBK1 and p65, causing excessive phosphorylation.
“Aβ can activate TLR4, which is located upstream of TBK1 and p65, causing excessive phosphorylation.”
The paper relies on this without support.
Chemokines such as CXCL10, which attracts infiltrating T cells, are known downstream effectors of STING.
“chemokines such as CXCL10, which attracts infiltrating T cells, are known downstream effectors of STING.”
Claims other papers make about this one
Each is checked against this paper’s own text: does it say what the citing paper says it does?
The cited source says what the claim attributes to it.
In the citing paper
“For example, pharmacological inhibition of STING activation reduces microglia‐mediated inflammatory response and ameliorates a wide range of AD‐related symptoms in AppNL−G−F/hTau double‐knock‐in mice [68].”
From Targeting Microglial Transcriptional Reprogramming as a Therapy Strategy for Alzheimer's Disease (2026) · cites this paper as [68]
Self-check
Percentages, sums and reported differences re-computed from the paper’s own numbers.
Each contradiction between two passages listed here was confirmed by an independent check.
Rated minor: it would not touch a result — a value no result rests on, a p-value that stays on the same side of the significance level, or a conflict that is clerical, resolved elsewhere in the paper, or outside its own findings.
In the paper
§ Blockade of STING activation alleviates microglial dysfunction and a broad spectrum of Alzheimer’s disease pathologies > Results > Aβ and tau increased cytoplasmic DNA levels and induced distinct activation of microglia, which is dependent on STING
“Tom20- and DAPI-negative DNA signals in the cytoplasm were significantly increased in both Aβ- and tau-stimulated microglia (Fig. 2d).”
§ Blockade of STING activation alleviates microglial dysfunction and a broad spectrum of Alzheimer’s disease pathologies > Results > Aβ and tau increased cytoplasmic DNA levels and induced distinct activation of microglia, which is dependent on STING
“b Quantification of DAPI- and Tom20-negative DNA signals in the cytoplasm of microglia. n = 51, 53, 72, N = 5 for each group. c Scheme of the subcellular fractionation of primary microglia. d Quantification of cytoplasmic dsDNA accumulation in Aβ- and tau-treated primary microglia.”
Rated minor: it would not touch a result — a value no result rests on, a p-value that stays on the same side of the significance level, or a conflict that is clerical, resolved elsewhere in the paper, or outside its own findings.
In the paper
§ Blockade of STING activation alleviates microglial dysfunction and a broad spectrum of Alzheimer’s disease pathologies > Results > Aβ and tau increased cytoplasmic DNA levels and induced distinct activation of microglia, which is dependent on STING
“Compared with control microglia, Aβ- and tau-treated microglia contained significantly more cytoplasmic DNA (Fig. 2e, f).”
§ Blockade of STING activation alleviates microglial dysfunction and a broad spectrum of Alzheimer’s disease pathologies > Results > Aβ and tau increased cytoplasmic DNA levels and induced distinct activation of microglia, which is dependent on STING
“d Quantification of cytoplasmic dsDNA accumulation in Aβ- and tau-treated primary microglia. The cytoplasmic dsDNA signal was normalized to the β-actin immunoblot signal from the cytoplasmic fraction. N = 6 for each group. e Representative immunoblots of cGAS-STING pathway proteins in primary microglia treated with Aβ, tau, and cGAMP for 24 h. f Quantification of cGAS, STING and downstream molecules.”
Citations
Cites
A Unique Microglia Type Associated with Restricting Development of Alzheimer’s Disease
Keren-Shaul, H., Spinrad, A., Weiner, A., Matcovitch-Natan, O., Dvir-Szternfeld, R., Ulland, T. K., David, E., Baruch, K., Lara-Astaiso, D., Toth, B., et al. (2017) · Cell · doi:10.1016/j.cell.2017.05.018 · Cited by 5,493 · cited 1×
“Since the identi fi cation of disease-associated microglia 40,41 , numerous attempts have been made to identify diverse microglial states and key drivers in AD and aging 42,43 .”
Complement and microglia mediate early synapse loss in Alzheimer mouse models
Hong, S., Beja-Glasser, V. F., Nfonoyim, B. M., Frouin, A., Li, S., Ramakrishnan, S., Merry, K. M., Shi, Q., Rosenthal, A., Barres, B. A., et al. (2016) · Science · doi:10.1126/science.aad8373 · Cited by 3,343 · cited 1×
“STING inhibition reduced microglial p-STAT1 levels and synaptic engulfment in App NL-G-F /hTau-dKI mice In AD, excessive synapse loss is primarily caused by microglia and the complement system 44 .”
Neuroinflammation and microglial activation in Alzheimer disease: where do we go from here?
Leng, F., & Edison, P. (2021) · Nature Reviews Neurology · doi:10.1038/s41582-020-00435-y · Cited by 3,179
Krasemann, S., Madore, C., Cialic, R., Baufeld, C., Calcagno, N., El Fatimy, R., Beckers, L., O’Loughlin, E., Xu, Y., Fanek, Z., et al. (2017) · Immunity · doi:10.1016/j.immuni.2017.08.008 · Cited by 2,979 · cited 1×
“Since the identi fi cation of disease-associated microglia 40,41 , numerous attempts have been made to identify diverse microglial states and key drivers in AD and aging 42,43 .”
NLRP3 is activated in Alzheimer’s disease and contributes to pathology in APP/PS1 mice
Heneka, M. T., Kummer, M. P., Stutz, A., Delekate, A., Schwartz, S., Vieira-Saecker, A., Griep, A., Axt, D., Remus, A., Tzeng, T.-C., et al. (2013) · Nature · doi:10.1038/nature11729 · Cited by 2,898 · cited 1×
“We next investigated the NLRP3 in fl ammasome in microglia because STING has been reported to drive NLRP3 activation in peritoneal macrophages 33, and NLRP3 is critical for AD pathogenesis 34 .”
The cGAS–STING pathway as a therapeutic target in inflammatory diseases
Decout, A., Katz, J. D., Venkatraman, S., & Ablasser, A. (2021) · Nature Reviews Immunology · doi:10.1038/s41577-021-00524-z · Cited by 2,309 · cited 1×
“At least four cGAMP import routes have been identi fi ed thus far 58 .”
Molecular mechanisms and cellular functions of cGAS–STING signalling
Hopfner, K.-P., & Hornung, V. (2020) · Nature Reviews Molecular Cell Biology · doi:10.1038/s41580-020-0244-x · Cited by 2,052 · cited 2×
“A β and tau increased cytoplasmic DNA levels and induced distinct activation of microglia, which is dependent on STING In nature, cytoplasmic DNA originating from the nucleus or mitochondria can activate cGAS 13 .”
Microglia states and nomenclature: A field at its crossroads
Paolicelli, R. C., Sierra, A., Stevens, B., Tremblay, M.-E., Aguzzi, A., Ajami, B., Amit, I., Audinat, E., Bechmann, I., Bennett, M., et al. (2022) · Neuron · doi:10.1016/j.neuron.2022.10.020 · Cited by 1,973 · cited 1×
“Microglia are innate immune cells that are highly sensitive to surrounding microenvironmental stimuli and thus show a wide range of phenotypic alterations in the degenerating brain 2 .”
The cGAS–cGAMP–STING pathway connects DNA damage to inflammation, senescence, and cancer
Li, T., & Chen, Z. J. (2018) · Journal of Experimental Medicine · doi:10.1084/jem.20180139 · Cited by 1,293 · cited 1×
“The pivotal roles of the cGAS-STING pathway in the DNA damage response, senescence, antiviral response, and cancer have been highlighted 14 .”
Lee, J.-H., Yu, W. H., Kumar, A., Lee, S., Mohan, P. S., Peterhoff, C. M., Wolfe, D. M., Martinez-Vicente, M., Massey, A. C., Sovak, G., et al. (2010) · Cell · doi:10.1016/j.cell.2010.05.008 · Cited by 1,212 · cited 1×
“Moreover, ADLP APP/PS1 and ADLP APT mice have a PSEN1 mutation that genetically disrupts autophagic fl ux 23 .”
Targeting STING with covalent small-molecule inhibitors
Haag, S. M., Gulen, M. F., Reymond, L., Gibelin, A., Abrami, L., Decout, A., Heymann, M., van der Goot, F. G., Turcatti, G., Behrendt, R., et al. (2018) · Nature · doi:10.1038/s41586-018-0287-8 · Cited by 1,178 · cited 1×
“H-151 was selected due to its BBB penetrability and applicability to both mice and humans 39 .”
cGAS–STING drives ageing-related inflammation and neurodegeneration
Gulen, M. F., Samson, N., Keller, A., Schwabenland, M., Liu, C., Glück, S., Thacker, V. V., Favre, L., Mangeat, B., Kroese, L. J., et al. (2023) · Nature · doi:10.1038/s41586-023-06373-1 · Cited by 1,104 · cited 2×
“Senescence is a driving force for cGAS-STING pathway activation 28 .”
BAK/BAX macropores facilitate mitochondrial herniation and mtDNA efflux during apoptosis
McArthur, K., Whitehead, L. W., Heddleston, J. M., Li, L., Padman, B. S., Oorschot, V., Geoghegan, N. D., Chappaz, S., Davidson, S., San Chin, H., et al. (2018) · Science · doi:10.1126/science.aao6047 · Cited by 1,072 · cited 1×
“Interestingly, Bax and Bak1 have proapoptotic functions but can also form mitochondrial membrane pores for mtDNA ef fl ux 47 .”
TDP-43 Triggers Mitochondrial DNA Release via mPTP to Activate cGAS/STING in ALS
Yu, C.-H., Davidson, S., Harapas, C. R., Hilton, J. B., Mlodzianoski, M. J., Laohamonthonkul, P., Louis, C., Low, R. R. J., Moecking, J., De Nardo, D., et al. (2020) · Cell · doi:10.1016/j.cell.2020.09.020 · Cited by 1,019 · cited 3×
“Brie fl y, 210 μ g of H-151, which is equivalent to 7 mg/kg for mean body weight, was disolved in DMSO and diluted in 10% Tween 80 in PBS and injected 3 times a week; this protocol was modi fi ed from a previous study 17 .”
cGAS is essential for cellular senescence
Yang, H., Wang, H., Ren, J., Chen, Q., & Chen, Z. J. (2017) · Proceedings of the National Academy of Sciences · doi:10.1073/pnas.1705499114 · Cited by 1,009 · cited 1×
“Although its cellular localization is divergent, cGAS often colocalizes with the DNA damage marker γ H2AX under certain stress conditions 29 .”
Sala Frigerio, C., Wolfs, L., Fattorelli, N., Thrupp, N., Voytyuk, I., Schmidt, I., Mancuso, R., Chen, W.-T., Woodbury, M. E., Srivastava, G., et al. (2019) · Cell Reports · doi:10.1016/j.celrep.2019.03.099 · Cited by 926 · cited 2×
“Since the identi fi cation of disease-associated microglia 40,41 , numerous attempts have been made to identify diverse microglial states and key drivers in AD and aging 42,43 .”
A Breakdown in Metabolic Reprogramming Causes Microglia Dysfunction in Alzheimer's Disease
Baik, S. H., Kang, S., Lee, W., Choi, H., Chung, S., Kim, J.-I., & Mook-Jung, I. (2019) · Cell Metabolism · doi:10.1016/j.cmet.2019.06.005 · Cited by 843 · cited 2×
“Identifying the causes and key drivers of microglial phenotypic changes is crucial for understanding and modulating the pathophysiology of neurodegenerative diseases 3 .”
Self-citationTemporal Tracking of Microglia Activation in Neurodegeneration at Single-Cell Resolution
Mathys, H., Adaikkan, C., Gao, F., Young, J. Z., Manet, E., Hemberg, M., De Jager, P. L., Ransohoff, R. M., Regev, A., & Tsai, L.-H. (2017) · Cell Reports · doi:10.1016/j.celrep.2017.09.039 · Cited by 740 · cited 12×
“The senescence marker genes ( Cdkn1a , Cdkn2a ) and cGAS-STING pathway downstream response genes ( Irf7 , Stat1 , I fi tm3 , Cxcl10 ) were upregulated in dKI microglia, and the expression of the cGAMP-degrading enzyme Enpp1 was also upregulated (Fig.”
InfluentialReadhead, B., Haure-Mirande, J.-V., Funk, C. C., Richards, M. A., Shannon, P., Haroutunian, V., Sano, M., Liang, W. S., Beckmann, N. D., Price, N. D., et al. (2018) · Neuron · doi:10.1016/j.neuron.2018.05.023 · Cited by 708 · cited 1×
“Moreover, other studies have noted the antimicrobial peptide-like properties of A β , suggesting that external factors such as viral pathogens can contribute to AD pathogenesis by triggering the body ’ s antimicrobial response 10,11 .”
Eimer, W. A., Vijaya Kumar, D. K., Navalpur Shanmugam, N. K., Rodriguez, A. S., Mitchell, T., Washicosky, K. J., György, B., Breakefield, X. O., Tanzi, R. E., & Moir, R. D. (2018) · Neuron · doi:10.1016/j.neuron.2018.06.030 · Cited by 674
Gaidt, M. M., Ebert, T. S., Chauhan, D., Ramshorn, K., Pinci, F., Zuber, S., O’Duill, F., Schmid-Burgk, J. L., Hoss, F., Buhmann, R., et al. (2017) · Cell · doi:10.1016/j.cell.2017.09.039 · Cited by 638 · cited 1×
“We next investigated the NLRP3 in fl ammasome in microglia because STING has been reported to drive NLRP3 activation in peritoneal macrophages 33, and NLRP3 is critical for AD pathogenesis 34 .”
Microglia-mediated T cell infiltration drives neurodegeneration in tauopathy
Chen, X., Firulyova, M., Manis, M., Herz, J., Smirnov, I., Aladyeva, E., Wang, C., Bao, X., Finn, M. B., Hu, H., et al. (2023) · Nature · doi:10.1038/s41586-023-05788-0 · Cited by 609 · cited 2×
“Second, two studies have reported the protective and detrimental roles of brain-in fi ltrated T cells in different models of amyloidosis and tauopathy 51,52 .”
Type I interferon response drives neuroinflammation and synapse loss in Alzheimer disease
Roy, E. R., Wang, B., Wan, Y.-W., Chiu, G., Cole, A., Yin, Z., Propson, N. E., Xu, Y., Jankowsky, J. L., Liu, Z., et al. (2020) · Journal of Clinical Investigation · doi:10.1172/jci133737 · Cited by 563 · cited 2×
“Although often overlooked, immunostaining has shown that neuritic A β plaques frequently contain nucleic acids, as pointed out in a previous study 30 (Supplementary Fig.”
cGAS senses long and HMGB/TFAM-bound U-turn DNA by forming protein-DNA ladders
Andreeva, L., Hiller, B., Kostrewa, D., Lässig, C., de Oliveira Mann, C. C., Jan Drexler, D., Maiser, A., Gaidt, M., Leonhardt, H., Hornung, V., et al. (2017) · Nature · doi:10.1038/nature23890 · Cited by 511 · cited 2×
“Double-stranded nucleic acids longer than 45 base pairs activate cGAS to produce cyclic 2 ’ -3 ’ -GMP-AMP (cGAMP), the physiological ligand of STING 12 .”
LINE1 Derepression in aged wild-type and SIRT6-deficient mice drives inflammation
Simon, M., Van Meter, M., Ablaeva, J., Ke, Z., Gonzalez, R. S., Taguchi, T., De Cecco, M., Leonova, K. I., Kogan, V., Helfand, S. L., et al. (2019) · Cell Metabolism · doi:10.1016/j.cmet.2019.02.014 · Cited by 498 · cited 15×
“Furthermore, the relationship between microglial APOE4 and the cGAS-STING pathway in AD has not been previously reported.”
InfluentialMarsh, S. E., Walker, A. J., Kamath, T., Dissing-Olesen, L., Hammond, T. R., de Soysa, T. Y., Young, A. M. H., Murphy, S., Abdulraouf, A., Nadaf, N., et al. (2022) · Nature Neuroscience · doi:10.1038/s41593-022-01022-8 · Cited by 431 · cited 2×
“To prevent adverse ex vivo activation, a triple inhibitor cocktail (actinomycin D, anisomycin, and triptolide) was used as described in a previous study 25 .”
Marsh, S. E., Kamath, T., Walker, A. J., Dissing-Olesen, L., Hammond, T. R., Young, A. M. H., Abdulraouf, A., Nadaf, N., Dufort, C., Murphy, S., et al. (2020) · doi:10.1101/2020.12.03.408542 · Cited by 430
Cholesterol and matrisome pathways dysregulated in astrocytes and microglia
TCW, J., Qian, L., Pipalia, N. H., Chao, M. J., Liang, S. A., Shi, Y., Jain, B. R., Bertelsen, S. E., Kapoor, M., Marcora, E., et al. (2022) · Cell · doi:10.1016/j.cell.2022.05.017 · Cited by 411 · cited 1×
“In particular, the APOE4 genotype has been reported to impair cholesterol traf fi cking and activate interferon pathways in human microglia 36 .”
Zhou, Y., Fei, M., Zhang, G., Liang, W., Lin, W., Wu, Y., Piskol, R., Ridgway, J. B., McNamara, E., Huang, H., et al. (2020) · Immunity · doi:10.1016/j.immuni.2020.01.014 · Cited by 406 · cited 1×
“…nature of cGAS and STING in nonimmune cells is predicated on the paracrine of cGAMP. cGAMP produced from dying tumor cells, cGAS, is transferred to surrounding immune cells and leads to STING activation when efferocytosis is blocked in tumor-associated macrophages by an anti-MerTK antibody 59 .”
The innate immunity protein IFITM3 modulates γ-secretase in Alzheimer’s disease
Hur, J.-Y., Frost, G. R., Wu, X., Crump, C., Pan, S. J., Wong, E., Barros, M., Li, T., Nie, P., Zhai, Y., et al. (2020) · Nature · doi:10.1038/s41586-020-2681-2 · Cited by 382
Interleukin-1β Induces mtDNA Release to Activate Innate Immune Signaling via cGAS-STING
Aarreberg, L. D., Esser-Nobis, K., Driscoll, C., Shuvarikov, A., Roby, J. A., & Gale, M. (2019) · Molecular Cell · doi:10.1016/j.molcel.2019.02.038 · Cited by 328 · cited 1×
“Cytoplasmic, mitochondrial and nuclear fractionation was performed as described in a previous study 24 .”
Tau Activates Transposable Elements in Alzheimer’s Disease
Guo, C., Jeong, H.-H., Hsieh, Y.-C., Klein, H.-U., Bennett, D. A., De Jager, P. L., Liu, Z., & Shulman, J. M. (2018) · Cell Reports · doi:10.1016/j.celrep.2018.05.004 · Cited by 315 · cited 2×
“All the statistical analyses were performed using GraphPad PRISM 8.”
Li, W., Lu, L., Lu, J., Wang, X., Yang, C., Jin, J., Wu, L., Hong, X., Li, F., Cao, D., et al. (2020) · Science Translational Medicine · doi:10.1126/scitranslmed.aay9013 · Cited by 305 · cited 1×
“7g), and T-cell-intrinsic STING function is required for prolonged function of memory CD8 + T cells 54 .”
De Schepper, S., Ge, J. Z., Sierksma, A., Crowley, G., Ferreira, L. S. S., Garceau, D., Toomey, C. E., Sokolova, D., Rueda-Carrasco, J., Shin, S.-H., et al. (2023) · Nature Neuroscience · doi:10.1038/s41593-023-01257-z · Cited by 295 · cited 2×
“Among the shared UP DEGs, the DAM-associated gene Spp1 , encodes SPP1/osteopontin, an extracellular matrix protein involved in synapse remodeling 48 .”
Self-citationActivation of innate immune cGAS-STING pathway contributes to Alzheimer’s pathogenesis in 5×FAD mice
Xie, X., Ma, G., Li, X., Zhao, J., Zhao, Z., & Zeng, J. (2023) · Nature Aging · doi:10.1038/s43587-022-00337-2 · Cited by 292 · cited 2×
“Two recent independent studies revealed the involvement of the cGAS-STING pathway in 5xFAD amyloidosis and P301S tauopathy mouse models, with a focus on cGAS manipulation 19,20 .”
Tau Activation of Microglial cGAS–IFN Reduces MEF2C‐mediated Cognitive Resilience
Udeochu, J. C., Amin, S., Huang, Y., Fan, L., Torres, E. R. S., Carling, G. K., Liu, B., McGurran, H., Coronas-Samano, G., Kauwe, G., et al. (2023) · Nature Neuroscience · doi:10.1038/s41593-023-01315-6 · Cited by 289 · cited 3×
“Two recent independent studies revealed the involvement of the cGAS-STING pathway in 5xFAD amyloidosis and P301S tauopathy mouse models, with a focus on cGAS manipulation 19,20 .”
STING controls nociception via type I interferon signalling in sensory neurons
Donnelly, C. R., Jiang, C., Andriessen, A. S., Wang, K., Wang, Z., Ding, H., Zhao, J., Luo, X., Lee, M. S., Lei, Y. L., et al. (2021) · Nature · doi:10.1038/s41586-020-03151-1 · Cited by 262 · cited 1×
“Although the nociceptive role of STING in peripheral neurons has been described previously 63 , the role of STING in brain neurons has rarely been addressed.”
Saito, T., Mihira, N., Matsuba, Y., Sasaguri, H., Hashimoto, S., Narasimhan, S., Zhang, B., Murayama, S., Higuchi, M., Lee, V. M. Y., et al. (2019) · Journal of Biological Chemistry · doi:10.1074/jbc.ra119.009487 · Cited by 248 · cited 1×
“This mouse model generates humanized A β peptides and 6 isoforms of human tau without causing protein overexpression or autophagic de fi cit 21 .”
Liu, H., Wang, L., Lv, M., Pei, R., Li, P., Pei, Z., Wang, Y., Su, W., & Xie, X. (2014) · Journal of Chemical Information and Modeling · doi:10.1021/ci500004h · Cited by 237 · cited 1×
“6a) 38 .”
Roy, E. R., Chiu, G., Li, S., Propson, N. E., Kanchi, R., Wang, B., Coarfa, C., Zheng, H., & Cao, W. (2022) · Immunity · doi:10.1016/j.immuni.2022.03.018 · Cited by 236 · cited 1×
“Recent studies have revealed the role of type I IFN signaling and p-STAT1-positive microglia in postsynaptic loss in a 5xFAD model 30,45 .”
Willemsen, J., Neuhoff, M., Hoyler, T., Noir, E., Tessier, C., Sarret, S., Thorsen, T. N., Littlewood-Evans, A. J., Zhang, J., Hasan, M., et al. (2021) · Cell Reports · doi:10.1016/j.celrep.2021.109977 · Cited by 228
Park, J., Jang, S., Lee, D., Lee, J.-H., Kang, U., Chang, H., Kim, H. J., Han, S.-H., Seo, J., Choi, M., et al. (2021) · Nature Communications · doi:10.1038/s41467-020-20440-5 · Cited by 227 · cited 1×
“Human iPSC cell lines were maintained as previously described 26 .”
Self-citationIFITM3 directly engages and shuttles incoming virus particles to lysosomes
Spence, J. S., He, R., Hoffmann, H.-H., et al. (2018) · Nature Chemical Biology · doi:10.1038/s41589-018-0213-2 · Cited by 225
Tau activates microglia via the PQBP1-cGAS-STING pathway to promote brain inflammation
Jin, M., Shiwaku, H., Tanaka, H., Obita, T., Ohuchi, S., Yoshioka, Y., Jin, X., Kondo, K., Fujita, K., Homma, H., et al. (2021) · Nature Communications · doi:10.1038/s41467-021-26851-2 · Cited by 223 · cited 2×
“In addition, A β can induce pathological neuritic plaque-dependent tau conversion 31 , and microglia-engulfed tau has been reported to induce PQBP1-dependent cGAS activation 32 .”
CXCR6 orchestrates brain CD8+ T cell residency and limits mouse Alzheimer’s disease pathology
Su, W., Saravia, J., Risch, I., Rankin, S. L., Guy, C. S., Chapman, N. M., Shi, H., Sun, Y., Anil, K. C., Li, W., et al. (2023) · Nature Immunology · doi:10.1038/s41590-023-01604-z · Cited by 222 · cited 2×
“Second, two studies have reported the protective and detrimental roles of brain-in fi ltrated T cells in different models of amyloidosis and tauopathy 51,52 .”
Somatic APP gene recombination in Alzheimer’s disease and normal neurons
Lee, M.-H., Siddoway, B., Kaeser, G. E., Segota, I., Rivera, R., Romanow, W. J., Liu, C. S., Park, C., Kennedy, G., Long, T., et al. (2018) · Nature · doi:10.1038/s41586-018-0718-6 · Cited by 210 · cited 1×
“The accumulation of somatic DNA damage and APP gene recombination have been reported in the brains of AD patients 6 .”
Amyloid-β Peptide Induces Mitochondrial Dysfunction by Inhibition of Preprotein Maturation
Mossmann, D., Vögtle, F. ‐., Taşkin, A. A., Teixeira, P. F., Ring, J., Burkhart, J. M., Burger, N., Pinho, C. M., Tadić, J., Loreth, D., et al. (2014) · Cell Metabolism · doi:10.1016/j.cmet.2014.07.024 · Cited by 196 · cited 1×
“In the in fl ammatory environment of the AD brain, A β induces DNA damage and mitochondrial stress 9 .”
Brelstaff, J., Tolkovsky, A. M., Ghetti, B., Goedert, M., & Spillantini, M. G. (2018) · Cell Reports · doi:10.1016/j.celrep.2018.07.072 · Cited by 195 · cited 1×
“Intriguingly, neurons containing pathological tau are exposed to phosphatidylserine and phagocytosed by microglia in an MFGE8-and NO-dependent manner 46 .”
Mathur, V., Burai, R., Vest, R. T., Bonanno, L. N., Lehallier, B., Zardeneta, M. E., Mistry, K. N., Do, D., Marsh, S. E., Abud, E. M., et al. (2017) · Neuron · doi:10.1016/j.neuron.2017.11.032 · Cited by 175 · cited 1×
“However, increasing evidence implicates dysregulation of the cGAS-STING pathway in neurological disorders, including multiple sclerosis 15 , Parkinson ’ s disease 16 , amyotrophic lateral sclerosis (ALS) 17 , Huntington ’ s disease 18 , and recently, amyloidosis 19 and tauopathy 20 .”
Cyclic GMP-AMP synthase promotes the inflammatory and autophagy responses in Huntington disease
Sharma, M., Rajendrarao, S., Shahani, N., Ramírez-Jarquín, U. N., & Subramaniam, S. (2020) · Proceedings of the National Academy of Sciences · doi:10.1073/pnas.2002144117 · Cited by 155 · cited 1×
“However, increasing evidence implicates dysregulation of the cGAS-STING pathway in neurological disorders, including multiple sclerosis 15 , Parkinson ’ s disease 16 , amyotrophic lateral sclerosis (ALS) 17 , Huntington ’ s disease 18 , and recently, amyloidosis 19 and tauopathy 20 .”
Identification of a cluster of X-linked imprinted genes in mice
Raefski, A. S., & O’Neill, M. J. (2005) · Nature Genetics · doi:10.1038/ng1567 · Cited by 151 · cited 1×
“Xlr4c has been reported to be transcriptionally repressed in the paternal allele 50 , making it potentially involved in sex-dependent microglial function.”
A noncanonical function of cGAMP in inflammasome priming and activation
Swanson, K. V., Junkins, R. D., Kurkjian, C. J., Holley-Guthrie, E., Pendse, A. A., Morabiti, R. E., Petrucelli, A., Barber, G. N., Benedict, C. A., & Ting, J. P. ‐. (2017) · The Journal of Experimental Medicine · doi:10.1084/jem.20171749 · Cited by 148 · cited 15×
“Higher levels of the postsynaptic component PSD95 and had lower NLRP3 levels were observed in the in brains of STING-inhibited dKI mice (Fig.”
InfluentialMicroglial MERTK eliminates phosphatidylserine‐displaying inhibitory post‐synapses
Park, J., Choi, Y., Jung, E., Lee, S., Sohn, J., & Chung, W. (2021) · The EMBO Journal · doi:10.15252/embj.2020107121 · Cited by 118 · cited 2×
“The intriguing nature of cGAS and STING in nonimmune cells is predicated on the paracrine of cGAMP. cGAMP produced from dying tumor cells, cGAS, is transferred to surrounding immune cells and leads to STING activation when efferocytosis is blocked in tumor-associated macrophages by an anti-MerTK antibody 59 .”
Self-citationThe neuritic plaque facilitates pathological conversion of tau in an Alzheimer’s disease mouse model
Li, T., Braunstein, K. E., Zhang, J., Lau, A., Sibener, L., Deeble, C., & Wong, P. C. (2016) · Nature Communications · doi:10.1038/ncomms12082 · Cited by 114 · cited 1×
“In addition, A β can induce pathological neuritic plaque-dependent tau conversion 31 , and microglia-engulfed tau has been reported to induce PQBP1-dependent cGAS activation 32 .”
Nuclear envelope dysfunction and its contribution to the aging process
Martins, F., Sousa, J., Pereira, C. D., Silva, O. A. B. D. C. E., & Rebelo, S. (2020) · Aging Cell · doi:10.1111/acel.13143 · Cited by 114 · cited 1×
“The relaxation of heterochromatin 4 , weakening of the nuclear membrane 5 and accumulation of DNA damage pose internal risks during aging.”
Jung, E. S., Suh, K., Han, J., Kim, H., Kang, H., Choi, W., & Mook‐Jung, I. (2022) · Aging Cell · doi:10.1111/acel.13623 · Cited by 97 · cited 15×
“Higher levels of the postsynaptic component PSD95 and had lower NLRP3 levels were observed in the in brains of STING-inhibited dKI mice (Fig.”
InfluentialSelf-citationWelch, G. M., Boix, C. A., Schmauch, E., Davila-Velderrain, J., Victor, M. B., Dileep, V., Bozzelli, P. L., Su, Q., Cheng, J. D., Lee, A., et al. (2022) · Science Advances · doi:10.1126/sciadv.abo4662 · Cited by 84 · cited 1×
“One study indicated that degenerating neurons exhibit increased Cgas ( Mb21d1 ) gene expression 62 .”
Bode, K., Bujupi, F., Link, C., Hein, T., Zimmermann, S., Peiris, D., Jaquet, V., Lepenies, B., Weyd, H., & Krammer, P. H. (2019) · Cell Reports · doi:10.1016/j.celrep.2019.11.086 · Cited by 83 · cited 1×
“In the brain, Trem2, Dectin-1 60 , MerTK 61 and other scavenging receptors have important functions in efferocytosis.”
Hanna, R., Flamier, A., Barabino, A., & Bernier, G. (2021) · Nature Communications · doi:10.1038/s41467-021-22129-9 · Cited by 73 · cited 1×
“Heterochromatin relaxation, which is normally repressed by the polycomb complex, has been reported in sporadic AD neurons 7 .”
Kim, S., Cho, Y.-S., Kim, Y., Park, J., Yoo, S., Gwak, J., Kim, Y., Gwon, Y., Kam, T., & Jung, Y. (2023) · Autophagy · doi:10.1080/15548627.2023.2181614 · Cited by 65 · cited 1×
“A β aggregates can overload or even inhibit lysosomal degradation, which is required for STING degradation 35 .”
Self-citationEndothelial STING controls T cell transmigration in an IFNI-dependent manner
Anastasiou, M., Newton, G. A., Kaur, K., Carrillo-Salinas, F. J., Smolgovsky, S. A., Bayer, A. L., Ilyukha, V., Sharma, S., Poltorak, A., Luscinskas, F. W., et al. (2021) · JCI Insight · doi:10.1172/jci.insight.149346 · Cited by 57 · cited 1×
“In addition, endothelial STING has been reported to induce T-cell transendothelial migration via the CXCL10-CXCR3 axis 53 .”
Li, S., & Jakobs, T. (2022) · Cell Reports · doi:10.1016/j.celrep.2022.111880 · Cited by 44 · cited 1×
“Additionally, because SPP1 has in fl ammation-modulating functions 49 , increased SPP1 expression can be bene fi cial in late-stage AD.”
Alpha-synuclein–mediated DNA damage, STING activation, and neuroinflammation in Parkinson’s disease
Standaert, D. G., & Childers, G. M. (2022) · Proceedings of the National Academy of Sciences · doi:10.1073/pnas.2204058119 · Cited by 40 · cited 1×
“However, increasing evidence implicates dysregulation of the cGAS-STING pathway in neurological disorders, including multiple sclerosis 15 , Parkinson ’ s disease 16 , amyotrophic lateral sclerosis (ALS) 17 , Huntington ’ s disease 18 , and recently, amyloidosis 19 and tauopathy 20 .”
Multi‐Omics‐Based Autophagy‐Related Untypical Subtypes in Patients with Cerebral Amyloid Pathology
Park, J., Barahona‐Torres, N., Jang, S., Mok, K. Y., Kim, H. J., Han, S., Cho, K., Zhou, X., Fu, A. K. Y., Ip, N. Y., et al. (2022) · Advanced Science · doi:10.1002/advs.202201212 · Cited by 29 · cited 2×
“Potential off-target effects were predicted by the CRISPR RGEN Cas-OFFinder webtool (http://www.rgenome.net/cas-of fi nder/). iMG differentiation was performed as described in a previous study with some modi fi cations 27 .”
Self-citationPlexin-A4 mediates amyloid-β–induced tau pathology in Alzheimer’s disease animal model
Chung, S., Yang, J., Kim, H. J., Hwang, E. M., Lee, W., Suh, K. Y., Choi, H., & Mook‐Jung, I. (2021) · Progress in Neurobiology · doi:10.1016/j.pneurobio.2021.102075 · Cited by 17 · cited 1×
“An in-house AD-like pathology (ADLP) mouse model was established as previously described 22 .”
Self-citationTau-activation of microglial cGAS-IFN reduces MEF2C-mediated cognitive resilience
Udeochu, J. C., Amin, S., Huang, Y., Fan, L., Torres, E. R. S., Carling, G., Liu, B., McGurran, H., Guillermo, C.-S., Kauwe, G., et al. (2023) · Zenodo (CERN European Organization for Nuclear Research) · doi:10.5281/zenodo.7717040 · Cited by 12
Cited by
Sorted by citations
Quan, S., Fu, X., Cai, H., Ren, Z., Xu, Y., & Jia, L. (2025) · Molecular Neurodegeneration · doi:10.1186/s13024-025-00815-2 · Cited by 110
Li, H., Cai, R., Zhou, Y., Jiang, Y., & Tan, S. (2025) · Journal of Neuroinflammation · doi:10.1186/s12974-025-03563-8 · Cited by 72
“Therefore, the activation of the chronic cGAS-STING pathway may promote the accumulation of Aβ by up-regulating IFITM3 [68, 69].”
cGAS-STING and neurodegenerative diseases: A molecular crosstalk and therapeutic perspective
Dhapola, R., Paidlewar, M., Kumari, S., Sharma, P., Vellingiri, B., Medhi, B., & HariKrishnaReddy, D. (2025) · International Immunopharmacology · doi:10.1016/j.intimp.2025.114902 · Cited by 60
cGAS-STING targeting offers novel therapeutic opportunities in neurological diseases
Wang, H., Fleishman, J. S., Wu, S., Wang, G., Du, L., Li, J., & Du, J. (2025) · Ageing Research Reviews · doi:10.1016/j.arr.2025.102691 · Cited by 55
He, S., Li, X., Mittra, N., Bhattacharjee, A., Wang, H., Song, S., Zhao, S., Liu, F., & Han, X. (2025) · Advanced Science · doi:10.1002/advs.202410910 · Cited by 34
Metadata
- Authors
- Chung, S., Jeong, J.-H., Park, J.-C., Han, J. W., Lee, Y., Kim, J.-I., & Mook-Jung, I.
- Affiliations
- Seoul National University (KR)
- Sungkyunkwan University (KR)
- Venue
- Experimental & Molecular Medicine
- Published
- 2024-09-02
- Volume
- 56
- Issue
- 9
- Pages
- 1936-1951
- ISSN
- 1226-3613 (ISSN-L)
- 2092-6413
- PMC
- PMC11447230
- OpenAlex
- W4402143990
- Cited by
- 103
- References
- 65
- Citations by year
- 2026: 64 · 2025: 39
- FWCI
- 13.77
- Type
- journal article
- Language
- en
- Open access
- gold
- doi.org
- Locations
- Experimental & Molecular Medicine (publishedVersion, cc-by)
- PubMed (publishedVersion)
- PubMed Central (submittedVersion, cc-by)
- DOAJ (DOAJ: Directory of Open Access Journals) (submittedVersion, cc-by-sa)
- Seoul National University Open Repository (Seoul National University) (submittedVersion)
- Funders
- National Research Foundation
- Seoul National University
- Ministry of Education (2020R1A6A3A13070845)
- Ministry of Science, ICT and Future Planning (HU23C1234)
- Ministry of Health and Welfare (HU23C1234)
- Korea Basic Science Institute (2021R1A6C101A445)
- National Research Foundation of Korea
- Ministry of Science and ICT, South Korea (RS‐2020‐KH106747)
- RIKEN
- Topics
- Life Sciences › Neuroscience › Neurology › Neuroinflammation and Neurodegeneration Mechanisms
- Life Sciences › Neuroscience › Cellular and Molecular Neuroscience › Alzheimer's disease research and treatments
- Life Sciences › Neuroscience › Neurology › Neurological Disease Mechanisms and Treatments
- Keywords
- Alzheimer's disease, STING, cGAS-STING pathway, microglial dysfunction, sterile inflammation, amyloid-beta, tau phosphorylation, mitochondrial stress, APOE ε4, NLRP3 inflammasome, type I interferon, gliosis, synapse engulfment, memory loss, STING inhibition, therapeutic target
- MeSH terms
- STING Protein, Alzheimer Disease, Animals, Disease Models, Animal, Humans, Membrane Proteins, Mice, Transgenic, Nucleotidyltransferases, Signal Transduction, Amyloid beta-Peptides, Microglia, Mice
About these checks
Registry, retraction, Cites and statistics results are computed, not judged, with one exception: a printed reference that no index lists is read once by a model before it counts as a citation error. Claims are extracted by a model and kept only when their quote appears verbatim in the text; each cited source is then checked, with a model’s help, for whether it says what the claim relies on. Those verdicts can be wrong — read the claim’s quote and the cited source before relying on one.
A language model drew the claims from the paper on 2026-10-19, under version 3 of the claim definition (model deepseek-v4.1-flash, prompt extract-v3).
A second model labelled each claim on 2026-10-19 (model jev-1.13-20260917, definition revision gold-guideline-v0.2).
Cited sources are checked with a language model’s help (gpt-6-sol).
Statistics and arithmetic are recomputed, not judged.
Confidence bands are shown only for fields calibrated on our annotated test set. None is calibrated yet, so no band is shown.
What counts as a claim ›How we measure confidence ›How we check this ›
Are you an author, or do you see a problem with this page? Request a review
