

The DOI matches its Crossref record; 45 of the 45 references it cites were found in a registry or an index.
Conceptualizing mental disorders as deviations from normative functioning
Open accessAbstract
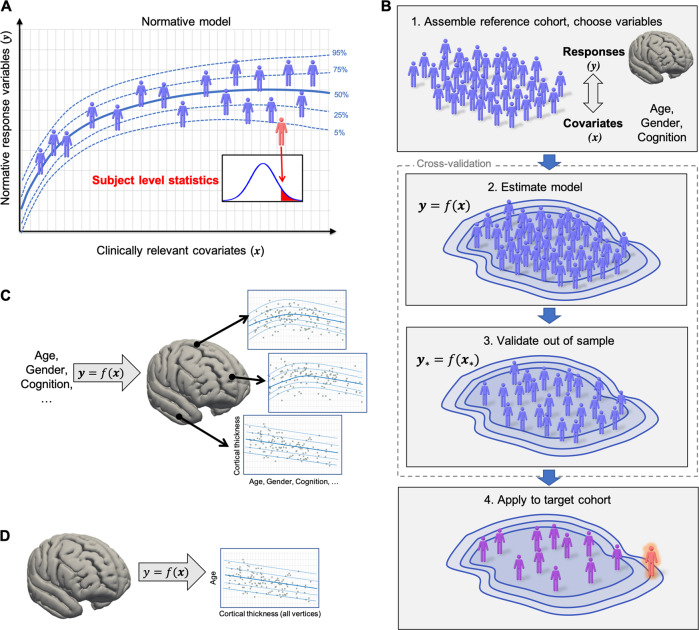
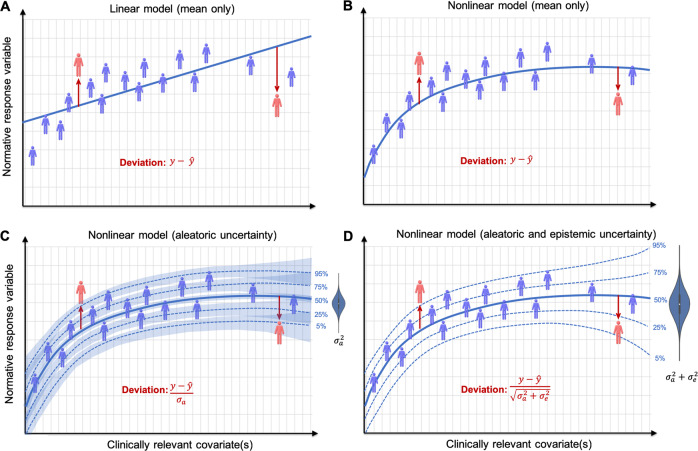
Normative models are a class of emerging statistical techniques useful for understanding the heterogeneous biology underlying psychiatric disorders at the level of the individual participant. Analogous to normative growth charts used in paediatric medicine for plotting child development in terms of height or weight as a function of age, normative models chart variation in clinical cohorts in terms of mappings between quantitative biological measures and clinically relevant variables. An emerging body of literature has demonstrated that such techniques are excellent tools for parsing the heterogeneity in clinical cohorts by providing statistical inferences at the level of the individual participant with respect to the normative range. Here, we provide a unifying review of the theory and application of normative modelling for understanding the biological and clinical heterogeneity underlying mental disorders. We first provide a statistically grounded yet non-technical overview of the conceptual underpinnings of normative modelling and propose a conceptual framework to link the many different methodological approaches that have been proposed for this purpose. We survey the literature employing these techniques, focusing principally on applications of normative modelling to quantitative neuroimaging-based biomarkers in psychiatry and, finally, we provide methodological considerations and recommendations to guide future applications of these techniques. We show that normative modelling provides a means by which the importance of modelling individual differences can be brought from theory to concrete data analysis procedures for understanding heterogeneous mental disorders and ultimately a promising route towards precision medicine in psychiatry.
Overview
The claims and statistics of this paper haven’t been checked yet.
Free: it reads the open-access text and checks the first 5 claims that cite a source we can check. Create a free account to check every claim.
Integrity signals
Registry
Cites
Statistics
Figures
Verification
Claims the paper makes
The claims and statistics of this paper haven’t been checked yet.
Free: it reads the open-access text and checks the first 5 claims that cite a source we can check. Create a free account to check every claim.
Claims other papers make about this one
Each is checked against this paper’s own text: does it say what the citing paper says it does?
The source backs part of the claim, not all of it — or backs it for a different population, condition or comparison.
In the citing paper
“A prerequisite for the application of growth charts in youth mental health is the availability of normative developmental data that comprise important domains of emerging psychopathology, such as cognition, emotion regulation, and sleep [92].”
From Towards a youth mental health paradigm: a perspective and roadmap (2023) · cites this paper as [92]
Experimental — accuracy not yet measuredThe source backs part of the claim, not all of it — or backs it for a different population, condition or comparison.
In the citing paper
“Newer hybrid models, such as normative modeling (19,59–61) or the functional random forest (FRF) (18,62), may overcome these limitations and enable new inferences from psychopathology studies.”
From Methods and challenges for assessing heterogeneity (2020) · cites this paper as [59]
Experimental — accuracy not yet measuredThe source backs part of the claim, not all of it — or backs it for a different population, condition or comparison.
In the citing paper
“Normative models (59) enable researchers to identify common (i.e., comorbid) mechanisms, identify potential subtypes or subfactors tied to an outcome of interest, and make pre- dictions on individual cases.”
From Methods and challenges for assessing heterogeneity (2020) · cites this paper as [59]
Experimental — accuracy not yet measuredThe cited source says what the claim attributes to it.
In the citing paper
“In this context, machine learning approaches have just recently embraced advances that allow the characterization of normative trajectories and parsing of the heterogeneity at the individual level 69 .”
From Candidate diagnostic biomarkers for neurodevelopmental disorders in children and adolescents: a systematic review (2023) · cites this paper as [69]
Self-check
Percentages, sums and reported differences re-computed from the paper’s own numbers.
The self-check needs the paper’s full text.
Citations
Cites
Insel, T., Cuthbert, B., Garvey, M., Heinssen, R., Pine, D. S., Quinn, K., Sanislow, C., & Wang, P. (2010) · American Journal of Psychiatry · doi:10.1176/appi.ajp.2010.09091379 · Cited by 7,067
The WU-Minn Human Connectome Project: An overview
Van Essen, D. C., Smith, S. M., Barch, D. M., Behrens, T. E. J., Yacoub, E., & Ugurbil, K. (2013) · NeuroImage · doi:10.1016/j.neuroimage.2013.05.041 · Cited by 5,651
Multimodal population brain imaging in the UK Biobank prospective epidemiological study
Miller, K. L., Alfaro-Almagro, F., Bangerter, N. K., Thomas, D. L., Yacoub, E., Xu, J., Bartsch, A. J., Jbabdi, S., Sotiropoulos, S. N., Andersson, J. L. R., et al. (2016) · Nature Neuroscience · doi:10.1038/nn.4393 · Cited by 2,020
Equifinality and multifinality in developmental psychopathology
Cicchetti, D., & Rogosch, F. A. (1996) · Development and Psychopathology · doi:10.1017/s0954579400007318 · Cited by 1,842
Kapur, S., Phillips, A. G., & Insel, T. R. (2012) · Molecular Psychiatry · doi:10.1038/mp.2012.105 · Cited by 980
The conception of the ABCD study: From substance use to a broad NIH collaboration
Volkow, N. D., Koob, G. F., Croyle, R. T., Bianchi, D. W., Gordon, J. A., Koroshetz, W. J., Pérez-Stable, E. J., Riley, W. T., Bloch, M. H., Conway, K., et al. (2018) · Developmental Cognitive Neuroscience · doi:10.1016/j.dcn.2017.10.002 · Cited by 970
Predicting Age Using Neuroimaging: Innovative Brain Ageing Biomarkers
Cole, J. H., & Franke, K. (2017) · Trends in Neurosciences · doi:10.1016/j.tins.2017.10.001 · Cited by 903
Insel, T. R., & Cuthbert, B. N. (2015) · Science · doi:10.1126/science.aab2358 · Cited by 840
Understanding heterogeneity in clinical cohorts using normative models: Beyond case-control studies
Marquand, A. F., Rezek, I., Buitelaar, J., & Beckmann, C. F. (2016) · Biological Psychiatry · doi:10.1016/j.biopsych.2015.12.023 · Cited by 683
Self-citationMapping the heterogeneous phenotype of schizophrenia and bipolar disorder using normative models
Wolfers, T., Doan, N. T., Kaufmann, T., Alnæs, D., Moberget, T., Agartz, I., Buitelaar, J. K., Ueland, T., Melle, I., Franke, B., et al. (2018) · JAMA Psychiatry · doi:10.1001/jamapsychiatry.2018.2467 · Cited by 508
Self-citation
Research works printed but not linked: 3
- Bethlehem R, Seidlitz J, Romero-Garcia R, Lombardo M. Using normative age modelling to isolate subsets of individuals with autism expressing highly age-atypical cortical thickness features. BioRxiv 2018:1–23.
- Gal Y. Uncertainty in deep learning. Cambridge: University of Cambridge; 2016. PhD thesis.
- Kia SM, Marquand A. Neural processes mixed-effect models for deep normative modeling of clinical neuroimaging data. arXiv. 2018;1812.04998.
Cited by
Brain charts for the human lifespan
Bethlehem, R. A. I., Seidlitz, J., White, S. R., Vogel, J. W., Anderson, K. M., Adamson, C., Adler, S., Alexopoulos, G. S., Anagnostou, E., Areces-Gonzalez, A., et al. (2022) · Nature · doi:10.1038/s41586-022-04554-y · Cited by 1,794
Towards a youth mental health paradigm: a perspective and roadmap
Uhlhaas, P. J., Davey, C. G., Mehta, U. M., Shah, J., Torous, J., Allen, N. B., Avenevoli, S., Bella-Awusah, T., Chanen, A., Chen, E. Y. H., et al. (2023) · Molecular Psychiatry · doi:10.1038/s41380-023-02202-z · Cited by 318
The normative modeling framework for computational psychiatry
Rutherford, S., Kia, S. M., Wolfers, T., Fraza, C., Zabihi, M., Dinga, R., Berthet, P., Worker, A., Verdi, S., Ruhe, H. G., et al. (2022) · Nature Protocols · doi:10.1038/s41596-022-00696-5 · Cited by 274
Self-citationA canonical trajectory of executive function maturation from adolescence to adulthood
Tervo-Clemmens, B., Calabro, F. J., Parr, A. C., Fedor, J., Foran, W., & Luna, B. (2023) · Nature Communications · doi:10.1038/s41467-023-42540-8 · Cited by 241
“As in these and related fi elds 65 , large-scale reproducible normative templates of change can be leveraged to better understand risk factors or consequences of mental and physical health conditions related to executive function during adolescence and across a range of experimental conditions.”
Charting brain growth and aging at high spatial precision
Rutherford, S., Fraza, C., Dinga, R., Kia, S. M., Wolfers, T., Zabihi, M., Berthet, P., Worker, A., Verdi, S., Andrews, D., et al. (2022) · eLife · doi:10.7554/elife.72904 · Cited by 214
Self-citation
Metadata
- Authors
- Marquand, A. F., Kia, S. M., Zabihi, M., Wolfers, T., Buitelaar, J. K., & Beckmann, C. F.
- Affiliations
- Radboud University Nijmegen (NL)
- Venue
- Molecular Psychiatry
- Published
- 2019-06-14
- Volume
- 24
- Issue
- 10
- Pages
- 1415-1424
- ISSN
- 1359-4184 (ISSN-L)
- 1476-5578
- PMC
- PMC6756106
- OpenAlex
- W2952396505
- Cited by
- 433
- References
- 45
- Citations by year
- 2026: 81 · 2025: 87 · 2024: 69 · 2023: 51 · 2022: 58 · 2021: 53 · 2020: 22 · 2019: 11
- FWCI
- 4.56
- Type
- journal article
- Language
- en
- Update notices
- correction (2019-06-26)
- Open access
- hybrid
- doi.org
- Licence
- cc-by
- creativecommons.org/licenses/by/4.0 (tdm)
- creativecommons.org/licenses/by/4.0 (vor)
- Locations
- Molecular Psychiatry (publishedVersion, cc-by)
- PubMed Central (publishedVersion, cc-by)
- Research portal (Tilburg University) (publishedVersion, cc-by)
- PubMed (publishedVersion)
- Radboud Repository (Radboud University) (submittedVersion)
- Radboud Repository (Radboud University) (submittedVersion, other-oa)
- Data Archiving and Networked Services (DANS) (submittedVersion, cc-by)
- Research Portal (King's College London) (submittedVersion, other-oa)
- Funders
- Nederlandse Organisatie voor Wetenschappelijk Onderzoek (016.156.415)
- Wellcome Trust (098369/Z/12/Z)
- Topics
- Life Sciences › Neuroscience › Cognitive Neuroscience › Functional Brain Connectivity Studies
- Social Sciences › Psychology › Experimental and Cognitive Psychology › Mental Health Research Topics
- Social Sciences › Arts and Humanities › Philosophy › Mental Health and Psychiatry
- Keywords
- normative modeling, mental illness, individual differences, clinical heterogeneity, neuroimaging biomarkers, precision psychiatry, psychiatric biomarkers
- MeSH terms
- Mental Disorders, Humans, Psychiatry, Models, Statistical, Biomarkers, Precision Medicine
About these checks
Registry, retraction, Cites and statistics results are computed, not judged, with one exception: a printed reference that no index lists is read once by a model before it counts as a citation error. Claims are extracted by a model and kept only when their quote appears verbatim in the text; each cited source is then checked, with a model’s help, for whether it says what the claim relies on. Those verdicts can be wrong — read the claim’s quote and the cited source before relying on one.
Statistics and arithmetic are recomputed, not judged.
Confidence bands are shown only for fields calibrated on our annotated test set. None is calibrated yet, so no band is shown.
What counts as a claim ›How we measure confidence ›How we check this ›
Are you an author, or do you see a problem with this page? Request a review
How to cite
Cite CoChat for the checks on this page, and the paper for its own findings.
- This page
- CoChat. (2026). Citation check: Conceptualizing mental disorders as deviations from normative functioning. https://app.cochat.ai/papers/10.1038/s41380-019-0441-1
- The paper
- Marquand, A. F., Kia, S. M., Zabihi, M., Wolfers, T., Buitelaar, J. K., & Beckmann, C. F. (2019). Conceptualizing mental disorders as deviations from normative functioning. Molecular Psychiatry. https://doi.org/10.1038/s41380-019-0441-1
Data sources
Bibliographic data: Semantic Scholar, OpenAlex, Crossref.
Contains information from the Semantic Scholar Academic Graph Datasets, made available under the ODC Attribution License (ODC-BY 1.0).
Semantic Scholar’s data is described in: Kinney, R., et al. (2023). The Semantic Scholar Open Data Platform. arXiv:2301.10140.
