

The DOI matches its Crossref record; 13 of the 13 references it cites were found in a registry or an index.
Long-read sequencing reveals the complex splicing profile of the psychiatric risk gene CACNA1C in human brain
Published version of a preprint
Abstract
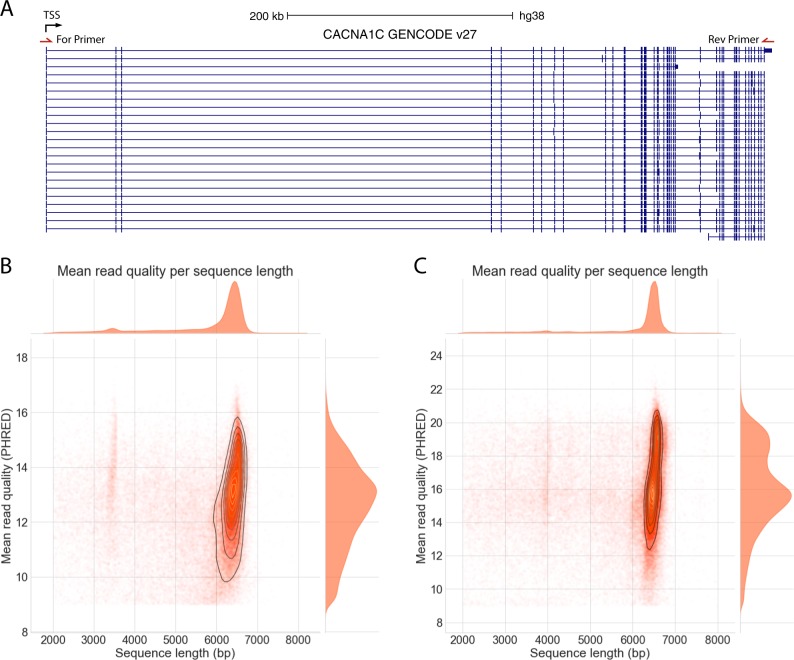
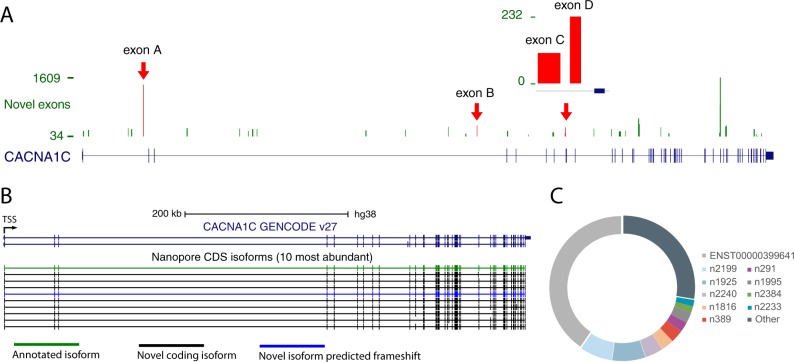
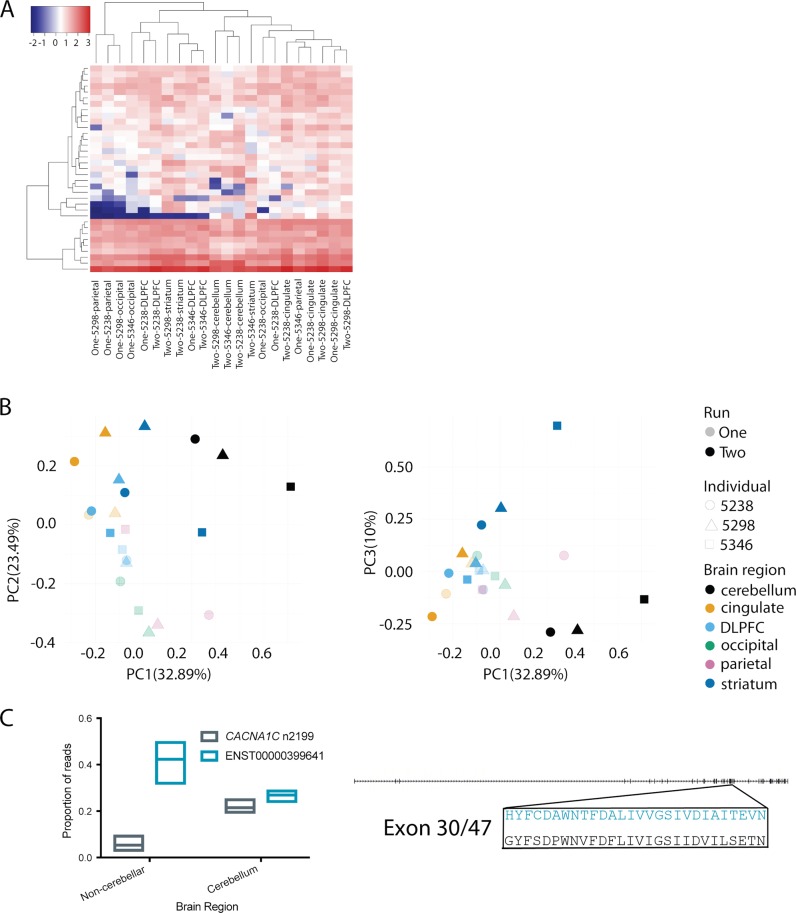
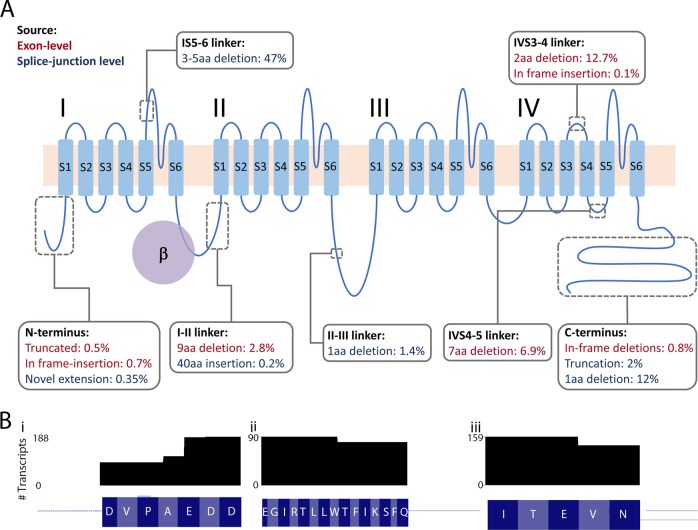
RNA splicing is a key mechanism linking genetic variation with psychiatric disorders. Splicing profiles are particularly diverse in brain and difficult to accurately identify and quantify. We developed a new approach to address this challenge, combining long-range PCR and nanopore sequencing with a novel bioinformatics pipeline. We identify the full-length coding transcripts of CACNA1C in human brain. CACNA1C is a psychiatric risk gene that encodes the voltage-gated calcium channel Ca V 1.2. We show that CACNA1C ’s transcript profile is substantially more complex than appreciated, identifying 38 novel exons and 241 novel transcripts. Importantly, many of the novel variants are abundant, and predicted to encode channels with altered function. The splicing profile varies between brain regions, especially in cerebellum. We demonstrate that human transcript diversity (and thereby protein isoform diversity) remains under-characterised, and provide a feasible and cost-effective methodology to address this. A detailed understanding of isoform diversity will be essential for the translation of psychiatric genomic findings into pathophysiological insights and novel psychopharmacological targets.
Overview
The claims and statistics of this paper haven’t been checked yet.
Run the check — free, no account needed. It reads the open-access text and checks the sources it cites.
Integrity signals
Registry
Cites
Statistics
Figures
Verification
Claims the paper makes
The claims and statistics of this paper haven’t been checked yet.
Run the check — free, no account needed. It reads the open-access text and checks the sources it cites.
Claims other papers make about this one
Each is checked against this paper’s own text: does it say what the citing paper says it does?
In the citing paper
“With relevance to the ability of estradiol to increase NRXN1 and rescue synaptic deficits, steroid-based pharmaceuticals are already used to treat neuroinflammation-related conditions46, with recent studies revealing estrogen-mediated roles in neuroprotection39, demonstrating the safety and feasibility of this approach.”
From Phenotypic complexities of rare heterozygous neurexin-1 deletions (2025) · cites this paper as [46]
Self-check
Percentages, sums and reported differences re-computed from the paper’s own numbers.
The self-check needs the paper’s full text.
Citations
Cites
ggplot2: Elegant Graphics for Data Analysis
Wickham, H. (2009) · doi:10.1007/978-0-387-98141-3 · Cited by 14,447
Biological insights from 108 schizophrenia-associated genetic loci
Schizophrenia Working Group of the Psychiatric Genomics Consortium (2014) · Nature · doi:10.1038/nature13595 · Cited by 7,577
The Genotype-Tissue Expression (GTEx) pilot analysis: Multitissue gene regulation in humans
The GTEx Consortium, Ardlie, K. G., Deluca, D. S., Segrè, A. V., Sullivan, T. J., Young, T. R., Gelfand, E. T., Trowbridge, C. A., Maller, J. B., Tukiainen, T., et al. (2015) · Science · doi:10.1126/science.1262110 · Cited by 5,062
GENCODE: The reference human genome annotation for The ENCODE Project
Harrow, J., Frankish, A., Gonzalez, J. M., Tapanari, E., Diekhans, M., Kokocinski, F., Aken, B. L., Barrell, D., Zadissa, A., Searle, S., et al. (2012) · Genome Research · doi:10.1101/gr.135350.111 · Cited by 4,585
(2013) · The Lancet · doi:10.1016/s0140-6736(12)62129-1 · Cited by 3,010
Genome-wide association study identifies 30 loci associated with bipolar disorder
eQTLGen Consortium, Stahl, E. A., BIOS Consortium, the Bipolar Disorder Working Group of the Psychiatric Genomics Consortium, Breen, G., Forstner, A. J., McQuillin, A., Ripke, S., Trubetskoy, V., Mattheisen, M., et al. (2019) · Nature Genetics · doi:10.1038/s41588-019-0397-8 · Cited by 1,519
The human transcriptome across tissues and individuals
Melé, M., Ferreira, P. G., Reverter, F., DeLuca, D. S., Monlong, J., Sammeth, M., Young, T. R., Goldmann, J. M., Pervouchine, D. D., Sullivan, T. J., et al. (2015) · Science · doi:10.1126/science.aaa0355 · Cited by 1,304
Transcriptome-wide isoform-level dysregulation in ASD, schizophrenia, and bipolar disorder
Gandal, M. J., Zhang, P., Hadjimichael, E., Walker, R. L., Chen, C., Liu, S., Won, H., van Bakel, H., Varghese, M., Wang, Y., et al. (2018) · Science · doi:10.1126/science.aat8127 · Cited by 1,247
Self-citationA Highly Conserved Program of Neuronal Microexons Is Misregulated in Autistic Brains
Irimia, M., Weatheritt, R. J., Ellis, J. D., Parikshak, N. N., Gonatopoulos-Pournatzis, T., Babor, M., Quesnel-Vallières, M., Tapial, J., Raj, B., O’Hanlon, D., et al. (2014) · Cell · doi:10.1016/j.cell.2014.11.035 · Cited by 693
RNA splicing is a primary link between genetic variation and disease
Li, Y. I., van de Geijn, B., Raj, A., Knowles, D. A., Petti, A. A., Golan, D., Gilad, Y., & Pritchard, J. K. (2016) · Science · doi:10.1126/science.aad9417 · Cited by 660
Research works printed but not linked: 43
- Corvin A, Sullivan PF. What next in schizophrenia genetics for the psychiatric genomics consortium? Schizophrenia Bull. 2016;42:538–41. · DOI
- Furlanis E, Traunmüller L, Fucile G, Scheiffele P. Landscape of ribosome-engaged transcript isoforms reveals extensive neuronal-cell-class-specific alternative splicing programs. Nat Neurosci. 2019;22:1709–17. · DOI
- Li M, Jaffe AE, Straub RE, Tao R, Shin JH, Wang Y, et al. A human-specific AS3MT isoform and BORCS7 are molecular risk factors in the 10q24.32 schizophrenia-associated locus. Nat Med. 2016;22:649–56. · DOI
- Hughes T, Hansson L, Sønderby IE, Athanasiu L, Zuber V, Tesli M, et al. A loss-of-function variant in a minor isoform of ANK3 protects against bipolar disorder and schizophrenia. Biol Psychiatry. 2016;80:323–30. · DOI
- Tao R, Cousijn H, Jaffe AE, Burnet PWJ, Edwards F, Eastwood SL, et al. Expression of ZNF804A in human brain and alterations in schizophrenia, bipolar disorder, and major depressive disorder: a novel transcript fetally regulated by the psychosis risk variant rs1344706ZNF804A expression in human brainZNF804A expression in human brain. JAMA Psychiatry. 2014;71:1112–20. · DOI
- Paterson C, Wang Y, Hyde WM, Weinberger DR, Kleinman JE, Law AJ. Temporal, diagnostic, and tissue-specific regulation of NRG3 isoform expression in human brain development and affective disorders. Am J Psychiatry. 2017;174:256–65. · DOI
- Oldmeadow C, Mossman D, Evans T-J, Holliday EG, Tooney PA, Cairns MJ, et al. Combined analysis of exon splicing and genome wide polymorphism data predict schizophrenia risk loci. J Psychiatr Res. 2014;52:44–9. · DOI
- Tapial J, Ha KCH, Sterne-Weiler T, Gohr A, Braunschweig U, Hermoso-Pulido A, et al. An atlas of alternative splicing profiles and functional associations reveals new regulatory programs and genes that simultaneously express multiple major isoforms. Genome Res. 2017;27:1759–68. · DOI
- Jensen KB, Dredge BK, Stefani G, Zhong R, Buckanovich RJ, Okano HJ, et al. Nova-1 regulates neuron-specific alternative splicing and is essential for neuronal viability. Neuron. 2000;25:359–71. · DOI · Paper page
- Yang YY, Yin GL, Darnell RB. The neuronal RNA-binding protein Nova-2 is implicated as the autoantigen targeted in POMA patients with dementia. Proc Natl Acad Sci USA. 1998;95:13254–9. · DOI · Paper page
- Raj B, Blencowe BJ. Alternative splicing in the mammalian nervous system: recent insights into mechanisms and functional roles. Neuron. 2015;87:14–27. · DOI · Paper page
- Li YI, Sanchez-Pulido L, Haerty W, Ponting CP. RBFOX and PTBP1 proteins regulate the alternative splicing of micro-exons in human brain transcripts. Genome Res. 2015;25:1–13. · DOI
- Steijger T, Abril JF, Engstrom PG, Kokocinski F, Consortium R, Hubbard TJ, et al. Assessment of transcript reconstruction methods for RNA-seq. Nat Methods. 2013;10:1177–84. · DOI · Paper page
- Hardwick SA, Chen WY, Wong T, Deveson IW, Blackburn J, Andersen SB, et al. Spliced synthetic genes as internal controls in RNA sequencing experiments. Nat Methods. 2016;13:792–8. · DOI
- Green EK, Hamshere M, Forty L, Gordon-Smith K, Fraser C, Russell E, et al. Replication of bipolar disorder susceptibility alleles and identification of two novel genome-wide significant associations in a new bipolar disorder case-control sample. Mol Psychiatr. 2013;18:1302–7. · DOI
- Psychiatric Genomics Consortium Bipolar Working Group. Large-scale genome-wide association analysis of bipolar disorder identifies a new susceptibility locus near ODZ4. Nat Genet. 2011;43:977–83. · DOI · Paper page
- Heyes S, Pratt WS, Rees E, Dahimene S, Ferron L, Owen MJ, et al. Genetic disruption of voltage-gated calcium channels in psychiatric and neurological disorders. Prog Neurobiol. 2015;134:36–54. · DOI
- Yang Y, Chen X, Margulies K, Jeevanandam V, Pollack P, Bailey BA, et al. L-type Ca2+channel α1cSubunit isoform switching in failing human ventricular myocardium. J Mol Cell Cardiol. 2000;32:973–84. · DOI
- Wang D, Papp AC, Binkley PF, Johnson JA, Sadee W. Highly variable mRNA expression and splicing of L-type voltage-dependent calcium channel alpha subunit 1C in human heart tissues. Pharmacogenetics genomics. 2006;16:735–45. · DOI
- Tang ZZ, Liang MC, Lu S, Yu D, Yu CY, Yue DT, et al. Transcript scanning reveals novel and extensive splice variations in human l-type voltage-gated calcium channel, Cav1.2 alpha1 subunit. J Biol Chem. 2004;279:44335–43. · DOI
- Hofmann F, Flockerzi V, Kahl S, Wegener JW. L-type CaV1.2 calcium channels: from in vitro findings to in vivo function. Physiol Rev. 2014;94:303–26. · DOI
- Striessnig J, Pinggera A, Kaur G, Bock G, Tuluc P. L-type Ca(2+) channels in heart and brain. Wiley Interdiscip Rev Membr Transp Signal. 2014;3:15–38. · DOI
- Bolisetty MT, Rajadinakaran G, Graveley BR. Determining exon connectivity in complex mRNAs by nanopore sequencing. Genome Biol. 2015;16:204. · DOI
- Weirather JL, de Cesare M, Wang Y, Piazza P, Sebastiano V, Wang XJ, et al. Comprehensive comparison of Pacific Biosciences and Oxford Nanopore Technologies and their applications to transcriptome analysis. F1000Res. 2017;6:100. · DOI · Paper page
- Byrne A, Beaudin AE, Olsen HE, Jain M, Cole C, Palmer T, et al. Nanopore long-read RNAseq reveals widespread transcriptional variation among the surface receptors of individual B cells. Nat Commun. 2017;8:16027.
- Colantuoni C, Lipska BK, Ye T, Hyde TM, Tao R, Leek JT, et al. Temporal dynamics and genetic control of transcription in the human prefrontal cortex. Nature. 2011;478:519. · DOI · Paper page
- Melé M, Ferreira PG, Reverter F, DeLuca DS, Monlong J, Sammeth M, et al. The human transcriptome across tissues and individuals. Science. 2015;348:660–5. · DOI · Paper page
- Wang M, Kong L. pblat: a multithread blat algorithm speeding up aligning sequences to genomes. BMC Bioinforma. 2019;20:28.
- Wu TD, Watanabe CK. GMAP: a genomic mapping and alignment program for mRNA and EST sequences. Bioinformatics. 2005;21:1859–75. · DOI · Paper page
- Kielbasa SM, Wan R, Sato K, Horton P, Frith MC. Adaptive seeds tame genomic sequence comparison. Genome Res. 2011;21:487–93. · DOI
- Robinson MD, Oshlack A. A scaling normalization method for differential expression analysis of RNA-seq data. Genome Biol. 2010;11:R25. · DOI
- Zhao S, Guo Y, Sheng Q, Shyr Y. Heatmap3: an improved heatmap package with more powerful and convenient features. BMC Bioinforma. 2014;15:P16.
- Dirksen RT, Nakai J, Gonzalez A, Imoto K, Beam KG. The S5-S6 linker of repeat I is a critical determinant of L-type Ca2+ channel conductance. Biophys J. 1997;73:1402–9. · DOI
- Wright JC, Mudge J, Weisser H, Barzine MP, Gonzalez JM, Brazma A, et al. Improving GENCODE reference gene annotation using a high-stringency proteogenomics workflow. Nat Commun. 2016;7:11778.
- Sun W, You X, Gogol-Doring A, He H, Kise Y, Sohn M, et al. Ultra-deep profiling of alternatively spliced Drosophila Dscam isoforms by circularization-assisted multi-segment sequencing. EMBO J. 2013;32:2029–38. · DOI
- Ebbert MTW, Jensen TD, Jansen-West K, Sens JP, Reddy JS, Ridge PG, et al. Systematic analysis of dark and camouflaged genes reveals disease-relevant genes hiding in plain sight. Genome Biol. 2019;20:97.
- Tilgner H, Jahanbani F, Blauwkamp T, Moshrefi A, Jaeger E, Chen F, et al. Comprehensive transcriptome analysis using synthetic long-read sequencing reveals molecular co-association of distant splicing events. Nat Biotechnol. 2015;33:736–42. · DOI · Paper page
- Welling A, Ludwig A, Zimmer S, Klugbauer N, Flockerzi V, Hofmann F. Alternatively spliced IS6 segments of the alpha 1C gene determine the tissue-specific dihydropyridine sensitivity of cardiac and vascular smooth muscle L-type Ca2+ channels. Circ Res. 1997;81:526–32. · DOI
- Kaur G, Pinggera A, Ortner NJ, Lieb A, Sinnegger-Brauns MJ, Yarov-Yarovoy V, et al. A polybasic plasma membrane binding motif in the I-II linker stabilizes voltage-gated CaV1.2 calcium channel function. J Biol Chem. 2015;290:21086–21100. · DOI
- Cipriani A, Saunders K, Attenburrow MJ, Stefaniak J, Panchal P, Stockton S, et al. A systematic review of calcium channel antagonists in bipolar disorder and some considerations for their future development. Mol Psychiatry. 2016;21:1324–32. · DOI
- Hayes JF, Lundin A, Wicks S, Lewis G, Wong ICK, Osborn DPJ, et al. Association of hydroxylmethyl glutaryl coenzyme A reductase inhibitors, L-type calcium channel antagonists, and biguanides with rates of psychiatric hospitalization and self-harm in individuals with serious mental illnessrepurposing HMG-CoA reductase inhibitors, L-type calcium channel antagonists, and biguanides for serious mental illnessrepurposing hmg-coa reductase inhibitors, L-type calcium channel antagonists, and biguanides for serious mental illness. JAMA Psychiatry. 2019;76:382–90. · DOI
- Dubovsky SL. Applications of calcium channel blockers in psychiatry: pharmacokinetic and pharmacodynamic aspects of treatment of bipolar disorder. Expert Opin Drug Metab Toxicol. 2019;15:35–47. · DOI
- Harrison PJ, Tunbridge EM, Dolphin AC, Hall J Voltage-gated calcium channel blockers for psychiatric disorders: genomic reappraisal. Br J Psychiatry 2019;24:1–4. · DOI
Cited by
Phenotypic complexities of rare heterozygous neurexin-1 deletions
Fernando, M. B., Fan, Y., Zhang, Y., Tokolyi, A., Murphy, A. N., Kammourh, S., Deans, P. J. M., Ghorbani, S., Onatzevitch, R., Pero, A., et al. (2025) · Nature · doi:10.1038/s41586-025-08864-9 · Cited by 30
Metadata
- Authors
- Clark, M. B., Wrzesinski, T., Garcia, A. B., Hall, N. A. L., Kleinman, J. E., Hyde, T., Weinberger, D. R., Harrison, P. J., Haerty, W., & Tunbridge, E. M.
- Venue
- Molecular Psychiatry
- Published
- 2019-11-06
- Volume
- 25
- Issue
- 1
- Pages
- 37-47
- ISSN
- 1359-4184
- 1476-5578
- PMC
- PMC6906184
- Cited by
- 148
- References
- 13
- Language
- en
- Funders
- RCUK | Biotechnology and Biological Sciences Research Council (BB/J004669/1, BB/P016774/1)
About these checks
Registry, retraction, Cites and statistics results are computed, not judged, with one exception: a printed reference that no index lists is read once by a model before it counts as a citation error. Claims are extracted by a model and kept only when their quote appears verbatim in the text; each cited source is then checked, with a model’s help, for whether it says what the claim relies on. Those verdicts can be wrong — read the claim’s quote and the cited source before relying on one.
Statistics and arithmetic are recomputed, not judged.
Confidence bands are shown only for fields calibrated on our annotated test set. None is calibrated yet, so no band is shown.
What counts as a claim ›How we measure confidence ›How we check this ›
Are you an author, or do you see a problem with this page? Request a review
Data sources
Bibliographic data: Semantic Scholar, OpenAlex, Crossref.
Contains information from the Semantic Scholar Academic Graph Datasets, made available under the ODC Attribution License (ODC-BY 1.0).
Semantic Scholar’s data is described in: Kinney, R., et al. (2023). The Semantic Scholar Open Data Platform. arXiv:2301.10140.
