Cited by 35

The DOI matches its Crossref record; 2 of the 2 references it cites were found in a registry or an index.

Exosomal circSPIRE1 mediates glycosylation of E-cadherin to suppress metastasis of renal cell carcinoma

Shu, Guannan, Lu, Xuanxuan, Pan, Yihui, Cen, Junjie, Huang, Kangbo, Zhou, Mi, Lu, Jun, Dong, Jiaqi, Han, Hui, Chen, Wei, Lin, Juan, Luo, Junhang, Zhang, Jiaxing·2023·Oncogene

Abstract

Metastasis is the main cause of mortality in renal cell carcinoma (RCC). Circular RNAs (circRNAs) involvement in RCC metastasis has been described, although the underlying mechanisms remain unknown. We evaluated recurring lung-metastasis cases using patient-derived xenograft models and isolated a highly metastatic clone. CircSPIRE1 was identified as a metastasis-inhibiting circRNA in clinical cohort and xenograft models. Mechanistically, circSPIRE1 suppressed mesenchymal state through regulating ELAV like RNA binding protein 1-mRNA binding, and upregulating polypeptide N-acetylgalactosaminyltransferase 3 (GALNT3) and KH domain RNA binding protein (QKI) expression. GALNT3 promoted glycosylation and cytomembrane localization of E-cadherin. QKI formed a positive feedback loop to enhance circSPIRE1 expression. Meanwhile, exosomal circSPIRE1 suppressed angiogenesis and vessel permeability. Our work reveals a non-canonical route for circRNAs in RCC to suppress metastasis. Furthermore, a nanomedicine consisting of circSPIRE1 plasmid suppressed metastasis formation. In conclusion, circSPIRE1 may be a predictor of metastasis and a potential therapeutic target of metastatic RCC.

Overview

The claims and statistics of this paper haven’t been checked yet.

Run the check — free, no account needed. It reads the open-access text and checks the sources it cites.

A few free checks a day · papers already verified open instantly · results are public

Integrity signals

Registry

Crossref · 10.1038/s41388-023-02678-7

Cites

2 of 2 references verified0 citation errors · 0 not checkable

Statistics

Figures

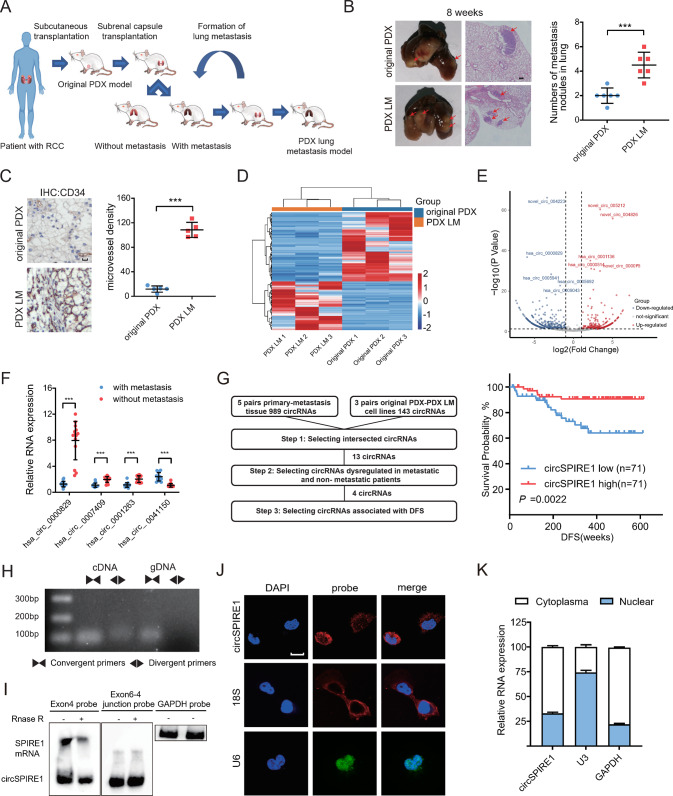
Fig. 1 Downregulation and characterization of circSPIRE1 in metastatic RCC. A Schematic illustration of the development of the metastatic RCC PDX model, PDX LM. B Increased tumor metastasis formed in lungs of PDX LM model compared to the original PDX model. Left, representative lung and representative HE staining of lung metastatic lesions, scale bar, 100 µm. Right, the number of metastatic nodules formed in the lungs of mice for each group (n = 6 mice/group). Data represent mean ± S.D.; dot plot reflects data points from independent experiments. The P values were determined by Student’s t test. C Increased microvessel density of the PDX LM model compared to the original PDX model. Left, representative tumor stained with CD34 anti-body. Right, microvessel density for each group (n = 5 mice/group). Data represent mean ± S.D.; dot plot reflects data points from independent experiments. The P values were determined by Student’s t test. D Heatmap of high-throughput sequencing between PDX LM cells and original PDX cells. E Volcano plot of circRNAs comparing five no clinically metastasis cases and five metastasis cases. F qRT-PCR analysis of four circRNAs expression in 14 RCC patients with metastasis and 14 patients without metastasis. Data represent mean ± S.D.; The P values were determined by Student’s t test. G Left, flowchart illustrating the screening criteria of potential metastasis related circRNAs. Right, Kaplan−Meier analysis of DFS in RCC patients with low versus high expression of circSPIRE1. The P value was determined by a Log-rank test. H Existence of circSPIRE1 confirmed by RT-PCR and gel electrophoresis using convergent and divergent primers. CircSPIRE1 can only be amplified in cDNA. I Northern blotting of circSPIRE1 and SPIRE1 transcripts by hybridization with exon 4 (left) and exon 6−exon 4 junction (right) probes in the presence or absence of RNase R treatment. J RNA fluorescence in situ hybridization for circSPIRE1. Scale bar, 10 µm. K Cytoplasmic and nuclear RNA fractionation experiment showing that circSPIRE1 mainly localized in the cytoplasm. GAPDH and U3 as positive controls in the cytoplasm and nucleus, respectively.
Fig. 1 Downregulation and characterization of circSPIRE1 in metastatic RCC. A Schematic illustration of the development of the metastatic RCC PDX model, PDX LM. B Increased tumor metastasis formed in lungs of PDX LM model compared to the original PDX model. Left, representative lung and representative HE staining of lung metastatic lesions, scale bar, 100 µm. Right, the number of metastatic nodules formed in the lungs of mice for each group (n = 6 mice/group). Data represent mean ± S.D.; dot plot reflects data points from independent experiments. The P values were determined by Student’s t test. C Increased microvessel density of the PDX LM model compared to the original PDX model. Left, representative tumor stained with CD34 anti-body. Right, microvessel density for each group (n = 5 mice/group). Data represent mean ± S.D.; dot plot reflects data points from independent experiments. The P values were determined by Student’s t test. D Heatmap of high-throughput sequencing between PDX LM cells and original PDX cells. E Volcano plot of circRNAs comparing five no clinically metastasis cases and five metastasis cases. F qRT-PCR analysis of four circRNAs expression in 14 RCC patients with metastasis and 14 patients without metastasis. Data represent mean ± S.D.; The P values were determined by Student’s t test. G Left, flowchart illustrating the screening criteria of potential metastasis related circRNAs. Right, Kaplan−Meier analysis of DFS in RCC patients with low versus high expression of circSPIRE1. The P value was determined by a Log-rank test. H Existence of circSPIRE1 confirmed by RT-PCR and gel electrophoresis using convergent and divergent primers. CircSPIRE1 can only be amplified in cDNA. I Northern blotting of circSPIRE1 and SPIRE1 transcripts by hybridization with exon 4 (left) and exon 6−exon 4 junction (right) probes in the presence or absence of RNase R treatment. J RNA fluorescence in situ hybridization for circSPIRE1. Scale bar, 10 µm. K Cytoplasmic and nuclear RNA fractionation experiment showing that circSPIRE1 mainly localized in the cytoplasm. GAPDH and U3 as positive controls in the cytoplasm and nucleus, respectively.CC BY · PubMed Central
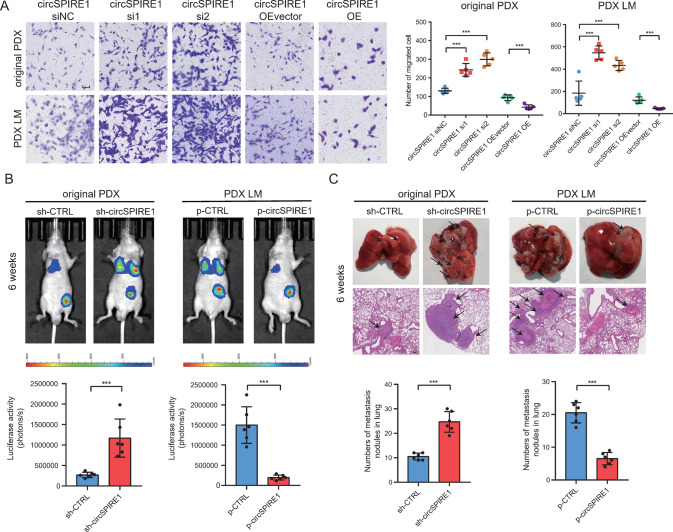
Fig. 2 Function assays of circSPIRE1 in RCC cells. A Transwell assays showing that expression of circSPIRE1 affected the migration ability of RCC cells. Left, transwell representative images. Scale bar, 100 µm. Right, numbers of migration cell (n = 5/group). B Bioluminescent in the lungs of mice through sub-capsular injection showing that expression of circSPIRE1 affected RCC metastasis in vivo. Top, representative bioluminescent images of lungs for each experimental group. Bottom, statistical analysis of bioluminescent tracking plots (n = 6 mice/group). C Tumor metastasis formed in the lungs of mice through sub-capsular injection showing that expression of circSPIRE1 affected RCC metastasis in vivo. Top, representative lung and representative HE staining of lung metastatic lesions. Scale bar, 100 µm. Bottom, statistical analysis of the number of metastatic nodules formed in the lungs of mice for each group (n = 6 mice/group). B, C Data represent mean ± S.D.; dot plot reflects data points from independent experiments. The P values were determined by Student’s t test.
Fig. 2 Function assays of circSPIRE1 in RCC cells. A Transwell assays showing that expression of circSPIRE1 affected the migration ability of RCC cells. Left, transwell representative images. Scale bar, 100 µm. Right, numbers of migration cell (n = 5/group). B Bioluminescent in the lungs of mice through sub-capsular injection showing that expression of circSPIRE1 affected RCC metastasis in vivo. Top, representative bioluminescent images of lungs for each experimental group. Bottom, statistical analysis of bioluminescent tracking plots (n = 6 mice/group). C Tumor metastasis formed in the lungs of mice through sub-capsular injection showing that expression of circSPIRE1 affected RCC metastasis in vivo. Top, representative lung and representative HE staining of lung metastatic lesions. Scale bar, 100 µm. Bottom, statistical analysis of the number of metastatic nodules formed in the lungs of mice for each group (n = 6 mice/group). B, C Data represent mean ± S.D.; dot plot reflects data points from independent experiments. The P values were determined by Student’s t test.CC BY · PubMed Central
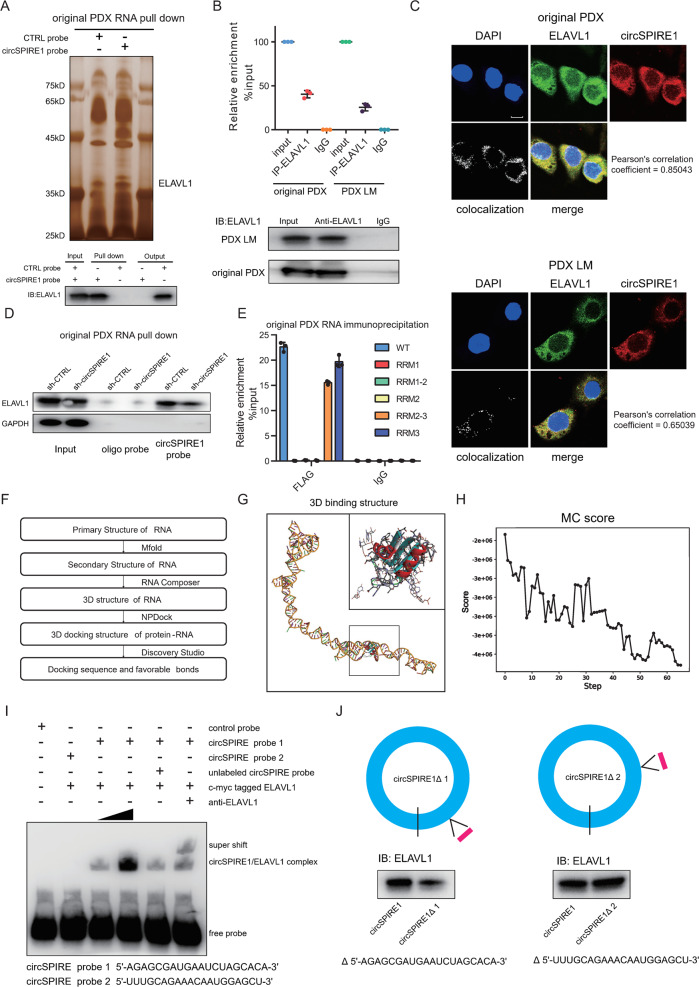
Fig. 3 5ʹ-AGAGCGAUGAAUCUAGCACA-3ʹ sequence of circSPIRE1 interacts with RRM3 domain of ELAVL1. A Top, identification of the circSPIRE1-protein complex pulled down by circSPIRE1 junction probe with protein extracts from original PDX cells. Bottom, immunoblot analysis of ELAVL1 after pulldown assay showing its specific association with circSPIRE1. B RIP assays showing the association of ELAVL1 with circSPIRE1. Relative enrichment representing RNA levels associated with ELAVL1 compared to an input control. IgG antibody served as a control. Data represent mean ± S.D.; dot plots reflect data points from three independent experiments. C IF-FISH assay showing that circSPIRE1 is colocalized with ELAVL1 protein in the cytoplasm. Scale bar, 10 µm. D Western blotting assay showing the level of ELAVL1 protein pulled down by biotin-labeled circSPIRE1 probes from the lysates of original PDX cells following transfection with shRNAs targeted circSPIRE1 and negative control. E Relative enrichment representing circSPIRE1 levels associated with truncated ELAVL1 relative to an input control. Data represent mean ± S.D.; dot plots reflect data points from three independent experiments. F Flowchart illustrating the computational analysis of circSPIRE1 interaction with ELAVL1. G Graphical representation of the best scored three-dimensional structures of circSPIRE1 and ELAVL1 (RRM3 domain) docking models with a zoom-in image. H Refinement of the best docked circSPIRE1-ELAVL1 (RRM3 domain) model showing MC score vs steps of simulation. I RNA-EMSA assay showing the binding ability of purified ELAVL1 with two biotin-labeled oligonucleotides containing two predicted sequence from circSPIRE1. J Western blotting assay showing the level of ELAVL1 protein pulled down by biotin-labeled circSPIRE1 probes from the lysates of 293 T following transfection with circSPIRE1 full-length plasmid or truncated circSPIRE1 plasmid.
Fig. 3 5ʹ-AGAGCGAUGAAUCUAGCACA-3ʹ sequence of circSPIRE1 interacts with RRM3 domain of ELAVL1. A Top, identification of the circSPIRE1-protein complex pulled down by circSPIRE1 junction probe with protein extracts from original PDX cells. Bottom, immunoblot analysis of ELAVL1 after pulldown assay showing its specific association with circSPIRE1. B RIP assays showing the association of ELAVL1 with circSPIRE1. Relative enrichment representing RNA levels associated with ELAVL1 compared to an input control. IgG antibody served as a control. Data represent mean ± S.D.; dot plots reflect data points from three independent experiments. C IF-FISH assay showing that circSPIRE1 is colocalized with ELAVL1 protein in the cytoplasm. Scale bar, 10 µm. D Western blotting assay showing the level of ELAVL1 protein pulled down by biotin-labeled circSPIRE1 probes from the lysates of original PDX cells following transfection with shRNAs targeted circSPIRE1 and negative control. E Relative enrichment representing circSPIRE1 levels associated with truncated ELAVL1 relative to an input control. Data represent mean ± S.D.; dot plots reflect data points from three independent experiments. F Flowchart illustrating the computational analysis of circSPIRE1 interaction with ELAVL1. G Graphical representation of the best scored three-dimensional structures of circSPIRE1 and ELAVL1 (RRM3 domain) docking models with a zoom-in image. H Refinement of the best docked circSPIRE1-ELAVL1 (RRM3 domain) model showing MC score vs steps of simulation. I RNA-EMSA assay showing the binding ability of purified ELAVL1 with two biotin-labeled oligonucleotides containing two predicted sequence from circSPIRE1. J Western blotting assay showing the level of ELAVL1 protein pulled down by biotin-labeled circSPIRE1 probes from the lysates of 293 T following transfection with circSPIRE1 full-length plasmid or truncated circSPIRE1 plasmid.CC BY · PubMed Central
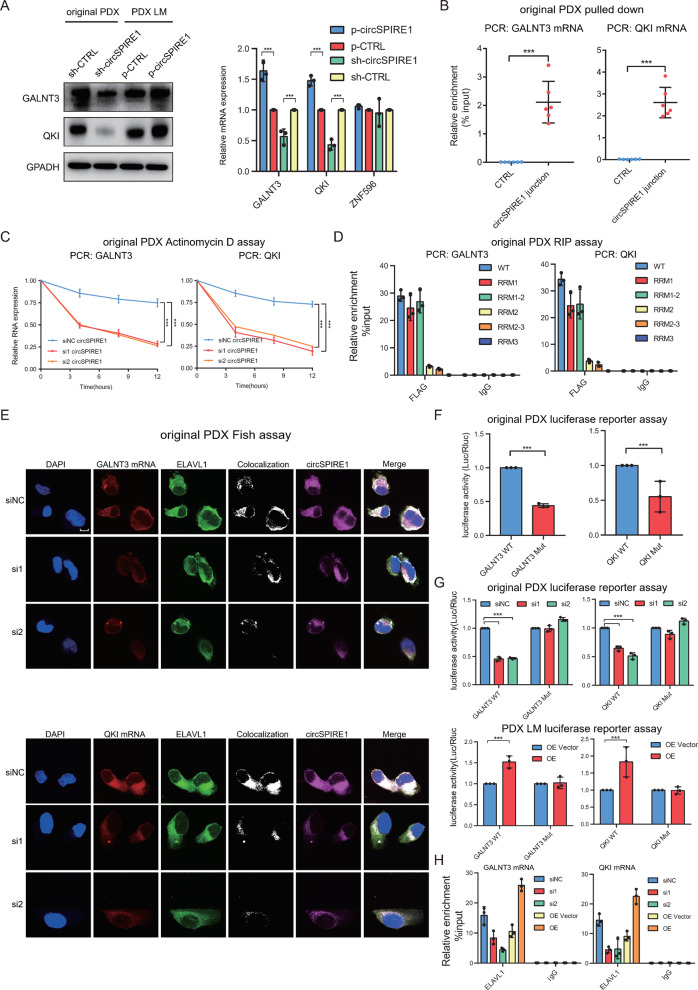
Fig. 4 CircSPIRE1/ELAVL1/mRNA ternary complex stabilizes GALNT3 and QKI mRNA. A Western blotting (left) as well as qPCR (right) validation of GALNT3 and QKI upon circSPIRE1 knockdown and overexpression. B Relative enrichment representing GALNT3 mRNA (left) and QKI mRNA (right) levels associated with circSPIRE1 junction compared to controls. Data represent mean ± S.D.; dot plots reflect data points from three independent experiments. The P values were determined by Student’s t test. C Reduced stability of GALNT3 (left) and QKI (right) upon circSPIRE1 knockdown. D Relative enrichment representing the enrichment of GALNT3 mRNA (left) and QKI mRNA (right) associated with the truncated ELAVL1 protein complex compared to an input control. IgG antibody served as a control. Data represent mean ± S.D.; dot plots reflect data points from three independent experiments. E IF-FISH assay showing that the colocalization of circSPIRE1/ELAVL1/mRNA was decreased upon knockdown of circSPIRE1. Scale bar, 10 µm. F Relative luciferase activity of luciferase reporter gene with GALNT3-WT or GALNT3-Mut (left) and QKI-WT or QKI-Mut (right). Data represent mean ± S.D.; dot plots reflect data points from three independent experiments. The P value was determined by Student’s t test. G Upon knockdown or overexpression of circSPIRE1, relative luciferase activity of luciferase reporter gene with GALNT3-WT or GALNT3-Mut (left) and QKI-WT or QKI-Mut (right). Data represent mean ± S.D.; dot plots reflect data points from three independent experiment. The P value was determined by Student’s t test. H Upon knockdown or overexpression of circSPIRE1, relative enrichment representing GALNT3 mRNA (left) and QKI mRNA (right) levels associated with ELAVL1 protein complex compared to an input control. IgG antibody served as a control. Data represent mean ± S.D.; dot plots reflect data points from three independent experiments.
Fig. 4 CircSPIRE1/ELAVL1/mRNA ternary complex stabilizes GALNT3 and QKI mRNA. A Western blotting (left) as well as qPCR (right) validation of GALNT3 and QKI upon circSPIRE1 knockdown and overexpression. B Relative enrichment representing GALNT3 mRNA (left) and QKI mRNA (right) levels associated with circSPIRE1 junction compared to controls. Data represent mean ± S.D.; dot plots reflect data points from three independent experiments. The P values were determined by Student’s t test. C Reduced stability of GALNT3 (left) and QKI (right) upon circSPIRE1 knockdown. D Relative enrichment representing the enrichment of GALNT3 mRNA (left) and QKI mRNA (right) associated with the truncated ELAVL1 protein complex compared to an input control. IgG antibody served as a control. Data represent mean ± S.D.; dot plots reflect data points from three independent experiments. E IF-FISH assay showing that the colocalization of circSPIRE1/ELAVL1/mRNA was decreased upon knockdown of circSPIRE1. Scale bar, 10 µm. F Relative luciferase activity of luciferase reporter gene with GALNT3-WT or GALNT3-Mut (left) and QKI-WT or QKI-Mut (right). Data represent mean ± S.D.; dot plots reflect data points from three independent experiments. The P value was determined by Student’s t test. G Upon knockdown or overexpression of circSPIRE1, relative luciferase activity of luciferase reporter gene with GALNT3-WT or GALNT3-Mut (left) and QKI-WT or QKI-Mut (right). Data represent mean ± S.D.; dot plots reflect data points from three independent experiment. The P value was determined by Student’s t test. H Upon knockdown or overexpression of circSPIRE1, relative enrichment representing GALNT3 mRNA (left) and QKI mRNA (right) levels associated with ELAVL1 protein complex compared to an input control. IgG antibody served as a control. Data represent mean ± S.D.; dot plots reflect data points from three independent experiments.CC BY · PubMed Central
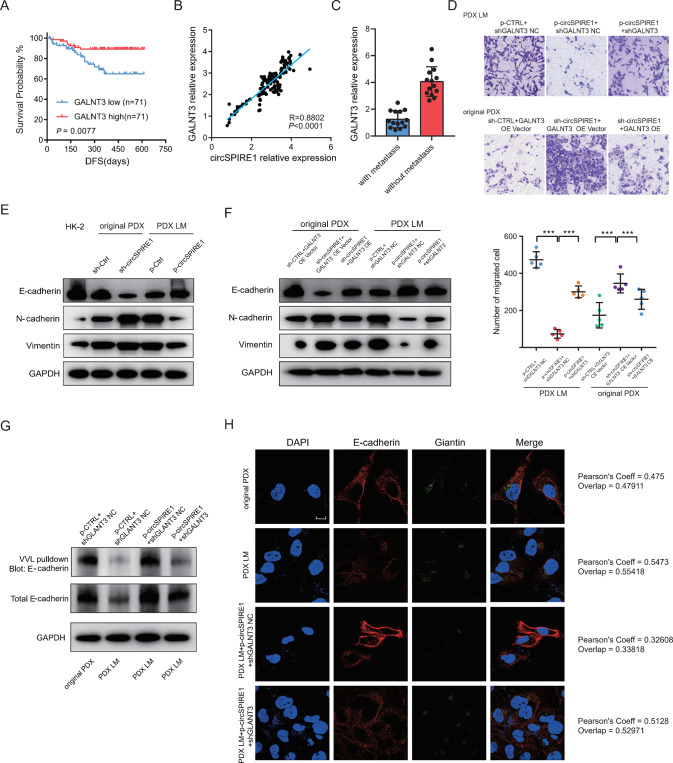
Fig. 5 CircSPIRE1 suppresses EMT of RCC cells through stabilizing GALNT3 mRNA. A Kaplan−Meier analysis of DFS in RCC patients with low versus high expression of GALNT3. The P-value was determined by the Log-rank test. B Positive correlation between GALNT3 expression and circSPIRE1 expression in 142 clinical samples of RCC. C qRT-PCR analysis of GALNT3 expression in 14 RCC patients with metastasis and 14 patients without metastasis. Data represent mean ± S.D.; the P values were determined by Student’s t test. D Transwell assays showing that circSPIRE1 suppresses the migration ability of RCC cells depending on GALNT3. Top, representative images of the Transwell assay. Scale bar, 100 µm. Bottom, numbers of migrating cells (n = 5/group). E Western blots of epithelial and mesenchymal markers upon overexpression of circSPIRE1 in PDX LM and knockdown of circSPIRE1 in original PDX. F Western blots of enhanced epithelial markers upon overexpression of circSPIRE1 was reversed by GALNT3 knockdown in PDX LM and reduced epithelial markers upon knockdown of circSPIRE1 was reversed by GALNT3 overexpression in original PDX. G E-cadherin O-GalNAc glycosylation decreases in PDX LM comparing with original PDX and increases upon circSPIRE1 overexpression. Knockdown of GALNT3 reversed the effect of circSPIRE1 overexpression. H E-cadherin retention in the Golgi increases in PDX LM compared to original PDX and decreases upon circSPIRE1 overexpression. Knockdown of GALNT3 reversed the effect of circSPIRE1 overexpression. Scale bar, 10 µm. Pearson’s coeff was used as quantifications.
Fig. 5 CircSPIRE1 suppresses EMT of RCC cells through stabilizing GALNT3 mRNA. A Kaplan−Meier analysis of DFS in RCC patients with low versus high expression of GALNT3. The P-value was determined by the Log-rank test. B Positive correlation between GALNT3 expression and circSPIRE1 expression in 142 clinical samples of RCC. C qRT-PCR analysis of GALNT3 expression in 14 RCC patients with metastasis and 14 patients without metastasis. Data represent mean ± S.D.; the P values were determined by Student’s t test. D Transwell assays showing that circSPIRE1 suppresses the migration ability of RCC cells depending on GALNT3. Top, representative images of the Transwell assay. Scale bar, 100 µm. Bottom, numbers of migrating cells (n = 5/group). E Western blots of epithelial and mesenchymal markers upon overexpression of circSPIRE1 in PDX LM and knockdown of circSPIRE1 in original PDX. F Western blots of enhanced epithelial markers upon overexpression of circSPIRE1 was reversed by GALNT3 knockdown in PDX LM and reduced epithelial markers upon knockdown of circSPIRE1 was reversed by GALNT3 overexpression in original PDX. G E-cadherin O-GalNAc glycosylation decreases in PDX LM comparing with original PDX and increases upon circSPIRE1 overexpression. Knockdown of GALNT3 reversed the effect of circSPIRE1 overexpression. H E-cadherin retention in the Golgi increases in PDX LM compared to original PDX and decreases upon circSPIRE1 overexpression. Knockdown of GALNT3 reversed the effect of circSPIRE1 overexpression. Scale bar, 10 µm. Pearson’s coeff was used as quantifications.CC BY · PubMed Central
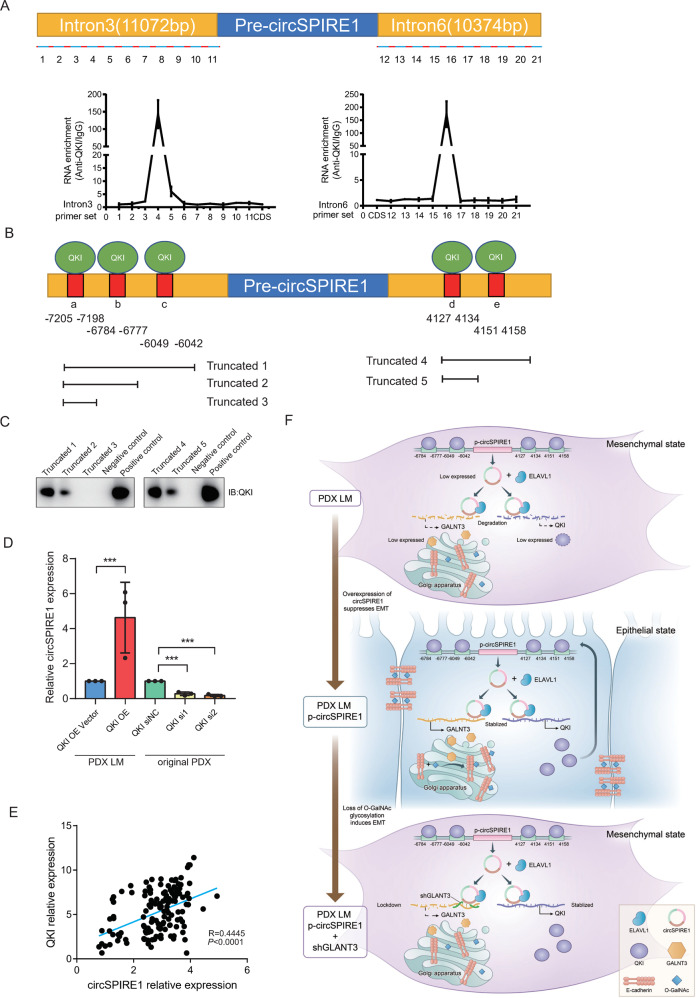
Fig. 6 CircSPIRE1 expression was dependent on the QKI positive feedback loop. A QKI was associated with the introns flanking circSPIRE1. RIP assays were conducted with a QKI antibody or control IgG, and primer sets covering the introns flanking circSPIRE1 (top). RNA enrichment indicates the levels of the indicated fragments in the anti-QKI precipitates relative to those in the IgG precipitates (bottom). Mean ± S.D. are provided. Dot plots reflect data points from three independent experiments. B Schematic structures showing RNA-binding sequence in the introns flanking the circSPIRE1 and a summary of intron truncations. C RNA pull-down assay performed to analyze the interaction between QKI and introns flanking circSPIRE1. D CircSPIRE1 expression upon QKI knockdown or overexpression. E Positive correlation between QKI expression and circSPIRE1 expression in 142 clinical samples of RCC. F Schematic diagram of mechanism of circSPIRE1 during RCC metastasis in RCC cells.
Fig. 6 CircSPIRE1 expression was dependent on the QKI positive feedback loop. A QKI was associated with the introns flanking circSPIRE1. RIP assays were conducted with a QKI antibody or control IgG, and primer sets covering the introns flanking circSPIRE1 (top). RNA enrichment indicates the levels of the indicated fragments in the anti-QKI precipitates relative to those in the IgG precipitates (bottom). Mean ± S.D. are provided. Dot plots reflect data points from three independent experiments. B Schematic structures showing RNA-binding sequence in the introns flanking the circSPIRE1 and a summary of intron truncations. C RNA pull-down assay performed to analyze the interaction between QKI and introns flanking circSPIRE1. D CircSPIRE1 expression upon QKI knockdown or overexpression. E Positive correlation between QKI expression and circSPIRE1 expression in 142 clinical samples of RCC. F Schematic diagram of mechanism of circSPIRE1 during RCC metastasis in RCC cells.CC BY · PubMed Central
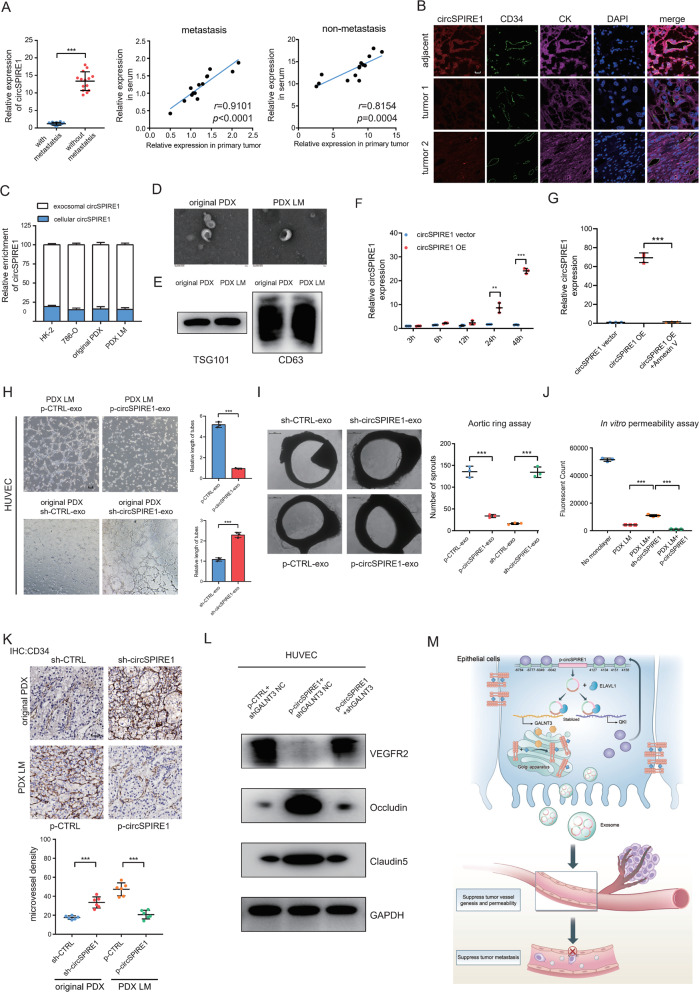
Fig. 7 RCC-secreted circSPIRE1 is transferred to endothelial cells and suppressed vascular permeability and angiogenesis. A Left, qRT-PCR analysis of circSPIRE1 expression in sera of 14 RCC patients with metastasis and 14 patients without metastasis. Data represent mean ± S.D.; The P values were determined by Student’s t test. Right, correlation of circSPIRE1 expression between in serum and in primary tumor. B Correlation analysis of circSPIRE1 (red) expression in RCC epithelium and stroma (labeled by CK, purple) and their adjacent endothelial cells (labeled by CD34, green). CircSPIRE1 levels were determined by the FISH score, Spearman rank correlation coefficient (rs), and P value. P value is from Spearman’s test. Scale bar, 50 µm. C Cytoplasmic and exosome RNA fractionation experiment showing that circSPIRE1 mainly localized in the exosome. D Transmission electron microscopy of exosomes derived from original PDX and PDX LM. E Exosome marker TSG101 and CD63 analyzed through western blotting. F RT-PCR analysis of circSPIRE1 expression in HUVECs incubated with exosomes derived from p-CTRL and p-circSPIRE1 cells for 3, 6, 12, 24, and 48 h. Data represent mean ± S.D.; dot plots reflect data points from three independent experiments. The P values were determined by Student’s t test. G Effect of p-CTRL, p-circSPIRE1 and p-circSPIRE1 + Annexin V treatments on circSPIRE1 expression in HUVECs. Data represent mean ± S.D.; dot plots reflect data points from three independent experiments. The P values were determined by Student’s t test. H Effect of exosomes derived from circSPIRE1 knockdown and control as well as overexpression and control on tube formation ability of HUVECs by tube formation assay. Mean ± S.D. are provided (n = 3/group). Scale bar represents 100 µm. I Effect of exosomes derived from circSPIRE1 knockdown and control as well as overexpression and control on vascular outgrowth of rat aortic rings. Vascular outgrowth was quantified by counting all sprouts from one ring. Left, representative aortic ring images (n = 3/group). Data represent mean ± S.D.; dot plot reflects data points from three independent experiments. Scale bar represents 200 µm. J Permeability of the HUVEC monolayers to rhodamine–dextran (70 kDa) after exposure to exosomes derived from circSPIRE1 knockdown or overexpression cells for 72 h. Mean ± S.D. are shown. Dot plots reflect data points from three independent experiments. The P values were determined by Student’s t test. K Effect of circSPIRE1 knockdown or overexpression on tumor microvessel genesis. Top, representative tumor stained with CD34 anti-body. Bottom, microvessel density for each group. Data represent mean ± S.D.; dot plots reflect data points from six independent experiments. The P values were determined by Student’s t test. L VEGFR2, Occluding and Claudin5 protein expression in circSPIRE1 overexpression or circSPIRE1 overexpression combined GALNT3 knockdown HUVECs by western blot. M Schematic diagram of mechanism of circSPIRE1 during RCC metastasis in tumor microenvironment.
Fig. 7 RCC-secreted circSPIRE1 is transferred to endothelial cells and suppressed vascular permeability and angiogenesis. A Left, qRT-PCR analysis of circSPIRE1 expression in sera of 14 RCC patients with metastasis and 14 patients without metastasis. Data represent mean ± S.D.; The P values were determined by Student’s t test. Right, correlation of circSPIRE1 expression between in serum and in primary tumor. B Correlation analysis of circSPIRE1 (red) expression in RCC epithelium and stroma (labeled by CK, purple) and their adjacent endothelial cells (labeled by CD34, green). CircSPIRE1 levels were determined by the FISH score, Spearman rank correlation coefficient (rs), and P value. P value is from Spearman’s test. Scale bar, 50 µm. C Cytoplasmic and exosome RNA fractionation experiment showing that circSPIRE1 mainly localized in the exosome. D Transmission electron microscopy of exosomes derived from original PDX and PDX LM. E Exosome marker TSG101 and CD63 analyzed through western blotting. F RT-PCR analysis of circSPIRE1 expression in HUVECs incubated with exosomes derived from p-CTRL and p-circSPIRE1 cells for 3, 6, 12, 24, and 48 h. Data represent mean ± S.D.; dot plots reflect data points from three independent experiments. The P values were determined by Student’s t test. G Effect of p-CTRL, p-circSPIRE1 and p-circSPIRE1 + Annexin V treatments on circSPIRE1 expression in HUVECs. Data represent mean ± S.D.; dot plots reflect data points from three independent experiments. The P values were determined by Student’s t test. H Effect of exosomes derived from circSPIRE1 knockdown and control as well as overexpression and control on tube formation ability of HUVECs by tube formation assay. Mean ± S.D. are provided (n = 3/group). Scale bar represents 100 µm. I Effect of exosomes derived from circSPIRE1 knockdown and control as well as overexpression and control on vascular outgrowth of rat aortic rings. Vascular outgrowth was quantified by counting all sprouts from one ring. Left, representative aortic ring images (n = 3/group). Data represent mean ± S.D.; dot plot reflects data points from three independent experiments. Scale bar represents 200 µm. J Permeability of the HUVEC monolayers to rhodamine–dextran (70 kDa) after exposure to exosomes derived from circSPIRE1 knockdown or overexpression cells for 72 h. Mean ± S.D. are shown. Dot plots reflect data points from three independent experiments. The P values were determined by Student’s t test. K Effect of circSPIRE1 knockdown or overexpression on tumor microvessel genesis. Top, representative tumor stained with CD34 anti-body. Bottom, microvessel density for each group. Data represent mean ± S.D.; dot plots reflect data points from six independent experiments. The P values were determined by Student’s t test. L VEGFR2, Occluding and Claudin5 protein expression in circSPIRE1 overexpression or circSPIRE1 overexpression combined GALNT3 knockdown HUVECs by western blot. M Schematic diagram of mechanism of circSPIRE1 during RCC metastasis in tumor microenvironment.CC BY · PubMed Central
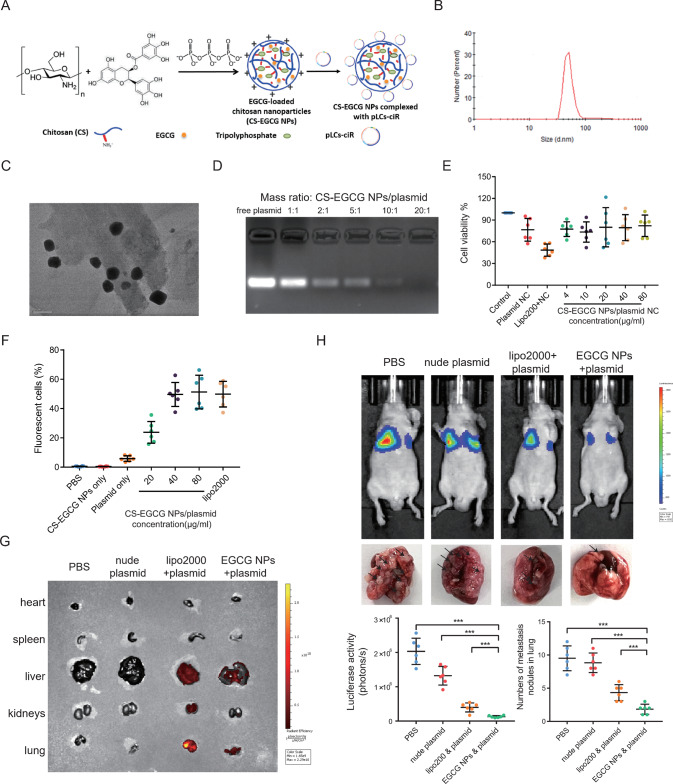
Fig. 8 CS-EGCG NPs/circSPIRE1 overexpression plasmid nanocomplexes inhibits RCC metastasis in vivo. A Chemical structure of Chitosan-EGCG nanoparticles and schematic structures of CS-EGCG NPs complexing with plasmid. B Mean particle size of CS-EGCG nanoparticles. C TEM image of CS-EGCG NPs. D Binding ability of CS-EGCG NPs to circSPIRE1 overexpression plasmid at different mass ratios characterized by gel electrophoresis. E Cell cytotoxicity of CS-EGCG NPs complexing with plasmid assessed by CCK8 assay and the percentage of viable cells was calculated relative to untreated control cells. Data represent mean ± S.D.; dot plots reflect data points from six independent experiments. F Percentage of fluorescent cells analyzed by flow cytometry. Data represent mean ± S.D.; dot plots reflect data points from six independent experiments. G Fluorescence images of nude mice bearing metastatic renal cell carcinoma after tail vein injection of PBS, nude plasmid, lipo2000 and plasmid, as well as CS-EGCG NPs and overexpression plasmid complexes. H Top, bioluminescent in the lungs and tumor metastasis formed in the lungs after tail vein injection of PBS, nude plasmid, lipo2000, and plasmid, as well as CS-EGCG NPs and overexpression plasmid complexes. Bottom, statistical analysis of bioluminescent and tumor metastasis plots (n = 6 mice/group). Data represent mean ± S.D.; dot plot reflects data points from independent experiments. The P values were determined by Student’s t test.
Fig. 8 CS-EGCG NPs/circSPIRE1 overexpression plasmid nanocomplexes inhibits RCC metastasis in vivo. A Chemical structure of Chitosan-EGCG nanoparticles and schematic structures of CS-EGCG NPs complexing with plasmid. B Mean particle size of CS-EGCG nanoparticles. C TEM image of CS-EGCG NPs. D Binding ability of CS-EGCG NPs to circSPIRE1 overexpression plasmid at different mass ratios characterized by gel electrophoresis. E Cell cytotoxicity of CS-EGCG NPs complexing with plasmid assessed by CCK8 assay and the percentage of viable cells was calculated relative to untreated control cells. Data represent mean ± S.D.; dot plots reflect data points from six independent experiments. F Percentage of fluorescent cells analyzed by flow cytometry. Data represent mean ± S.D.; dot plots reflect data points from six independent experiments. G Fluorescence images of nude mice bearing metastatic renal cell carcinoma after tail vein injection of PBS, nude plasmid, lipo2000 and plasmid, as well as CS-EGCG NPs and overexpression plasmid complexes. H Top, bioluminescent in the lungs and tumor metastasis formed in the lungs after tail vein injection of PBS, nude plasmid, lipo2000, and plasmid, as well as CS-EGCG NPs and overexpression plasmid complexes. Bottom, statistical analysis of bioluminescent and tumor metastasis plots (n = 6 mice/group). Data represent mean ± S.D.; dot plot reflects data points from independent experiments. The P values were determined by Student’s t test.CC BY · PubMed Central

Verification

Claims the paper makes

The claims and statistics of this paper haven’t been checked yet.

Run the check — free, no account needed. It reads the open-access text and checks the sources it cites.

A few free checks a day · papers already verified open instantly · results are public

Claims other papers make about this one

Each is checked against this paper’s own text: does it say what the citing paper says it does?

Self-check

Percentages, sums and reported differences re-computed from the paper’s own numbers.

The self-check needs the paper’s full text.

Citations

Cites

Show all 2 references

Research works printed but not linked: 51

  1. Siegel RL, Miller KD, Fuchs HE, Jemal A. Cancer statistics, 2021. CA: A Cancer J Clin. 2021;71:7–33.
  2. Capitanio U, Montorsi F. Renal cancer. Lancet. 2016;387:894–906. · DOI
  3. Welch HG, Skinner JS, Schroeck FR, Zhou W, Black WC. Regional variation of computed tomographic imaging in the united states and the risk of nephrectomy. JAMA Intern Med. 2018;178:221–7. · DOI
  4. Jonasch E, Gao J, Rathmell WK. Renal cell carcinoma. BMJ (Clin Res ed). 2014;349:g4797.
  5. Lara PN Jr, Evans CP. Cytoreductive nephrectomy in metastatic renal cell cancer: not all that it’s cut out to be. JAMA Oncol. 2019;5:171–2. · DOI
  6. Molina AM, Lin X, Korytowsky B, Matczak E, Lechuga MJ, Wiltshire R, et al. Sunitinib objective response in metastatic renal cell carcinoma: analysis of 1059 patients treated on clinical trials. Eur J Cancer (Oxf, Engl: 1990). 2014;50:351–8. · DOI
  7. Rodrigues JG, Balmaña M, Macedo JA, Poças J, Fernandes Â, de-Freitas-Junior JCM, et al. Glycosylation in cancer: selected roles in tumour progression, immune modulation and metastasis. Cell Immunol. 2018;333:46–57. · DOI
  8. Pinho SS, Reis CA. Glycosylation in cancer: mechanisms and clinical implications. Nat Rev Cancer. 2015;15:540–55. · DOI
  9. Paredes J, Figueiredo J, Albergaria A, Oliveira P, Carvalho J, Ribeiro AS, et al. Epithelial E- and P-cadherins: role and clinical significance in cancer. Biochim et Biophys Acta. 2012;1826:297–311.
  10. de Freitas Junior JC, Silva Bdu R, de Souza WF, de Araújo WM, Abdelhay ES, Morgado-Díaz JA. Inhibition of N-linked glycosylation by tunicamycin induces E-cadherin-mediated cell-cell adhesion and inhibits cell proliferation in undifferentiated human colon cancer cells. Cancer Chemother Pharmacol. 2011;68:227–38. · DOI
  11. Carvalho S, Oliveira T, Bartels MF, Miyoshi E, Pierce M, Taniguchi N, et al. O-mannosylation and N-glycosylation: two coordinated mechanisms regulating the tumour suppressor functions of E-cadherin in cancer. Oncotarget. 2016;7:65231–46. · DOI
  12. Raghu D, Mobley RJ, Shendy NAM, Perry CH, Abell AN. GALNT3 maintains the epithelial state in trophoblast stem cells. Cell Rep. 2019;26:3684–97.e7. · DOI
  13. Vo JN, Cieslik M, Zhang Y, Shukla S, Xiao L, Zhang Y, et al. The landscape of circular RNA in Cancer. Cell 2019;176:869–81. e13. · DOI
  14. Li X, Yang L, Chen LL. The biogenesis, functions, and challenges of circular RNAs. Mol Cell. 2018;71:428–42. · DOI
  15. Han B, Chao J, Yao H. Circular RNA and its mechanisms in disease: From the bench to the clinic. Pharmacol Ther. 2018;187:31–44. · DOI
  16. Wang Y, Zhang Y, Wang P, Fu X, Lin W. Circular RNAs in renal cell carcinoma: implications for tumorigenesis, diagnosis, and therapy. Mol Cancer. 2020;19:149. · DOI
  17. Huang W, Ling Y, Zhang S, Xia Q, Cao R, Fan X, et al. TransCirc: an interactive database for translatable circular RNAs based on multi-omics evidence. Nucleic Acids Res. 2021;49:D236–d42. · DOI
  18. Xu J, Ji L, Liang Y, Wan Z, Zheng W, Song X, et al. CircRNA-SORE mediates sorafenib resistance in hepatocellular carcinoma by stabilizing YBX1. Signal Transduct Target Ther. 2020;5:298. · DOI
  19. Zuker M. Mfold web server for nucleic acid folding and hybridization prediction. Nucleic Acids Res. 2003;31:3406–15. · DOI · Paper page
  20. Popenda M, Szachniuk M, Antczak M, Purzycka KJ, Lukasiak P, Bartol N, et al. Automated 3D structure composition for large RNAs. Nucleic Acids Res. 2012;40:e112. · DOI
  21. Antczak M, Popenda M, Zok T, Sarzynska J, Ratajczak T, Tomczyk K, et al. New functionality of RNAComposer: an application to shape the axis of miR160 precursor structure. Acta Biochim Pol. 2016;63:737–44.
  22. Tuszynska I, Magnus M, Jonak K, Dawson W, Bujnicki JM. NPDock: a web server for protein-nucleic acid docking. Nucleic Acids Res. 2015;43:W425–30. · DOI
  23. Ripin N, Boudet J, Duszczyk MM, Hinniger A, Faller M, Krepl M, et al. Molecular basis for AU-rich element recognition and dimerization by the HuR C-terminal RRM. Proc Natl Acad Sci USA. 2019;116:2935–44. · DOI
  24. Tran H, Maurer F, Nagamine Y. Stabilization of urokinase and urokinase receptor mRNAs by HuR is linked to its cytoplasmic accumulation induced by activated mitogen-activated protein kinase-activated protein kinase 2. Mol Cell Biol. 2003;23:7177–88. · DOI
  25. Doller A, Akool el S, Huwiler A, Müller R, Radeke HH, Pfeilschifter J, et al. Posttranslational modification of the AU-rich element binding protein HuR by protein kinase Cdelta elicits angiotensin II-induced stabilization and nuclear export of cyclooxygenase 2 mRNA. Mol Cell Biol. 2008;28:2608–25. · DOI
  26. Chen X, Li A, Sun BF, Yang Y, Han YN, Yuan X, et al. 5-methylcytosine promotes pathogenesis of bladder cancer through stabilizing mRNAs. Nat Cell Biol. 2019;21:978–90. · DOI
  27. Li JH, Liu S, Zhou H, Qu LH, Yang JH. starBase v2.0: decoding miRNA-ceRNA, miRNA-ncRNA and protein-RNA interaction networks from large-scale CLIP-Seq data. Nucleic acids Res 2014;42:D92–7. · DOI · Paper page
  28. Wang H, Zeng F, Liu Q, Liu H, Liu Z, Niu L, et al. The structure of the ARE-binding domains of Hu antigen R (HuR) undergoes conformational changes during RNA binding. Acta Crystallogr Sect D Biol Crystallogr 2013;69:373–80. · DOI
  29. Conn SJ, Pillman KA, Toubia J, Conn VM, Salmanidis M, Phillips CA, et al. The RNA binding protein quaking regulates formation of circRNAs. Cell. 2015;160:1125–34. · DOI
  30. Bailey TL, Boden M, Buske FA, Frith M, Grant CE, Clementi L, et al. MEME SUITE: tools for motif discovery and searching. Nucleic Acids Res. 2009;37:W202–8. · DOI · Paper page
  31. Becker A, Thakur BK, Weiss JM, Kim HS, Peinado H, Lyden D. Extracellular vesicles in cancer: cell-to-cell mediators of metastasis. Cancer Cell. 2016;30:836–48. · DOI · Paper page
  32. Zhu C, Jung S, Luo S, Meng F, Zhu X, Park TG, et al. Co-delivery of siRNA and paclitaxel into cancer cells by biodegradable cationic micelles based on PDMAEMA-PCL-PDMAEMA triblock copolymers. Biomaterials. 2010;31:2408–16. · DOI
  33. Cavet ME, Harrington KL, Vollmer TR, Ward KW, Zhang JZ. Anti-inflammatory and anti-oxidative effects of the green tea polyphenol epigallocatechin gallate in human corneal epithelial cells. Mol Vis. 2011;17:533–42.
  34. Klaus S, Pültz S, Thöne-Reineke C, Wolfram S. Epigallocatechin gallate attenuates diet-induced obesity in mice by decreasing energy absorption and increasing fat oxidation. Int J Obes (2005). 2005;29:615–23. · DOI
  35. Lee MS, Kim CT, Kim Y. Green tea (-)-epigallocatechin-3-gallate reduces body weight with regulation of multiple genes expression in adipose tissue of diet-induced obese mice. Ann Nutr Metab. 2009;54:151–7. · DOI
  36. Wolfram S, Raederstorff D, Preller M, Wang Y, Teixeira SR, Riegger C, et al. Epigallocatechin gallate supplementation alleviates diabetes in rodents. J Nutr. 2006;136:2512–8. · DOI
  37. Lee YH, Kwak J, Choi HK, Choi KC, Kim S, Lee J, et al. EGCG suppresses prostate cancer cell growth modulating acetylation of androgen receptor by anti-histone acetyltransferase activity. Int J Mol Med. 2012;30:69–74.
  38. Sadreddini S, Safaralizadeh R, Baradaran B, Aghebati-Maleki L, Hosseinpour-Feizi MA, Shanehbandi D, et al. Chitosan nanoparticles as a dual drug/siRNA delivery system for treatment of colorectal cancer. Immunol Lett. 2017;181:79–86. · DOI · Paper page
  39. Alameh M, Lavertu M, Tran-Khanh N, Chang CY, Lesage F, Bail M, et al. siRNA delivery with chitosan: influence of chitosan molecular weight, degree of deacetylation, and amine to phosphate ratio on in vitro silencing efficiency, hemocompatibility, biodistribution, and in vivo efficacy. Biomacromolecules. 2018;19:112–31. · DOI
  40. Cheaib JG, Patel HD, Johnson MH, Gorin MA, Haut ER, Canner JK, et al. Stage-specific conditional survival in renal cell carcinoma after nephrectomy. Urol Oncol. 2020;38:6.e1–6.e7. · DOI
  41. Yang L, Zou X, Zou J, Zhang G. Functions of circular RNAs in bladder, prostate and renal cell cancer (Review). Mol Med Rep. 2021;23:307. · DOI
  42. Chen RX, Chen X, Xia LP, Zhang JX, Pan ZZ, Ma XD, et al. N(6)-methyladenosine modification of circNSUN2 facilitates cytoplasmic export and stabilizes HMGA2 to promote colorectal liver metastasis. Nat Commun. 2019;10:4695. · DOI
  43. Mrena J, Wiksten JP, Thiel A, Kokkola A, Pohjola L, Lundin J, et al. Cyclooxygenase-2 is an independent prognostic factor in gastric cancer and its expression is regulated by the messenger RNA stability factor HuR. Clin Cancer Res. 2005;11:7362–8. · DOI
  44. López de Silanes I, Fan J, Yang X, Zonderman AB, Potapova O, Pizer ES, et al. Role of the RNA-binding protein HuR in colon carcinogenesis. Oncogene. 2003;22:7146–54. · DOI
  45. Pan H, Strickland A, Madhu V, Johnson ZI, Chand SN, Brody JR, et al. RNA binding protein HuR regulates extracellular matrix gene expression and pH homeostasis independent of controlling HIF-1α signaling in nucleus pulposus cells. Matrix Biol. 2019;77:23–40. · DOI
  46. Ivanov A, Memczak S, Wyler E, Torti F, Porath HT, Orejuela MR, et al. Analysis of intron sequences reveals hallmarks of circular RNA biogenesis in animals. Cell Rep. 2015;10:170–7. · DOI
  47. Bachmayr-Heyda A, Reiner AT, Auer K, Sukhbaatar N, Aust S, Bachleitner-Hofmann T, et al. Correlation of circular RNA abundance with proliferation-exemplified with colorectal and ovarian cancer, idiopathic lung fibrosis, and normal human tissues. Sci Rep. 2015;5:8057. · DOI
  48. Pinho SS, Seruca R, Gärtner F, Yamaguchi Y, Gu J, Taniguchi N, et al. Modulation of E-cadherin function and dysfunction by N-glycosylation. Cell Mol Life Sci. 2011;68:1011–20. · DOI
  49. Ma M, Fu Y, Zhou X, Guan F, Wang Y, Li X. Functional roles of fucosylated and O-glycosylated cadherins during carcinogenesis and metastasis. Cell Signal. 2019;63:109365. · DOI
  50. Bennett EP, Mandel U, Clausen H, Gerken TA, Fritz TA, Tabak LA. Control of mucin-type O-glycosylation: a classification of the polypeptide GalNAc-transferase gene family. Glycobiology. 2012;22:736–56. · DOI · Paper page
  51. Gu Y, Mi W, Ge Y, Liu H, Fan Q, Han C, et al. GlcNAcylation plays an essential role in breast cancer metastasis. Cancer Res. 2010;70:6344–51. · DOI

Cited by

Sorted by citations

Metadata

Authors
Shu, G., Lu, X., Pan, Y., Cen, J., Huang, K., Zhou, M., Lu, J., Dong, J., Han, H., Chen, W., Lin, J., Luo, J., & Zhang, J.
Venue
Oncogene
Published
2023-04-12
Volume
42
Issue
22
Pages
1802-1820
ISSN
  • 0950-9232
  • 1476-5594
Cited by
35
References
2
Language
en
Funders
  • National Natural Science Foundation of China (82073381, 81772514, 82002684, 81772718)
  • Pearl River S and T Nova Program of Guangzhou (201806010005)
  • Natural Science Foundation of Guangdong Province (S2019B151502046)
  • China Postdoctoral Science Foundation (236464, 2021TQ0381, 2021M703700)

About these checks

Registry, retraction, Cites and statistics results are computed, not judged, with one exception: a printed reference that no index lists is read once by a model before it counts as a citation error. Claims are extracted by a model and kept only when their quote appears verbatim in the text; each cited source is then checked, with a model’s help, for whether it says what the claim relies on. Those verdicts can be wrong — read the claim’s quote and the cited source before relying on one.

Statistics and arithmetic are recomputed, not judged.

Confidence bands are shown only for fields calibrated on our annotated test set. None is calibrated yet, so no band is shown.

What counts as a claim ›How we measure confidence ›How we check this ›

Are you an author, or do you see a problem with this page? Request a review