

The DOI matches its Crossref record; 6 of the 6 references it cites were found in a registry or an index.
Genetically engineered MAPT 10+16 mutation causes pathophysiological excitability of human iPSC-derived neurons related to 4R tau-induced dementia
Abstract
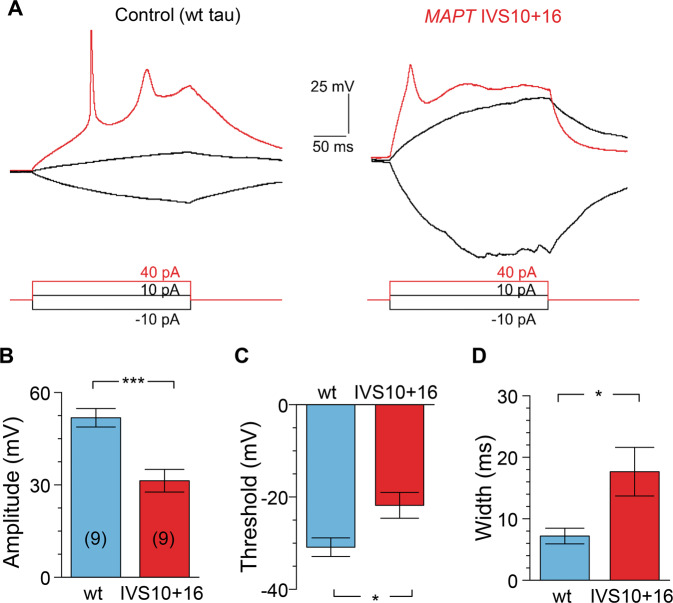
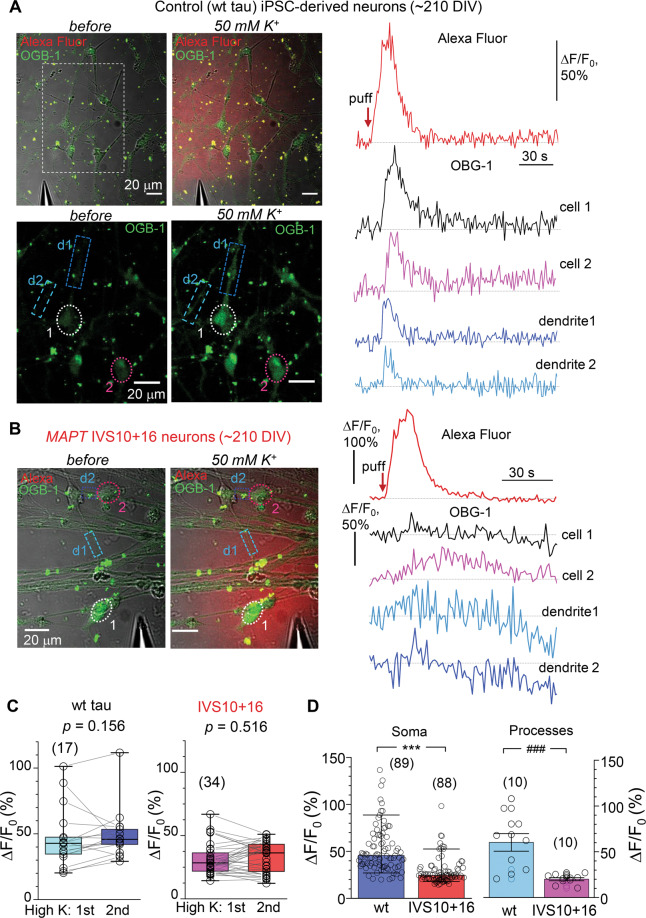
Human iPSC lines represent a powerful translational model of tauopathies. We have recently described a pathophysiological phenotype of neuronal excitability of human cells derived from the patients with familial frontotemporal dementia and parkinsonism (FTDP-17) caused by the MAPT 10+16 splice-site mutation. This mutation leads to the increased splicing of 4R tau isoforms. However, the role of different isoforms of tau protein in initiating neuronal dementia-related dysfunction, and the causality between the MAPT 10+16 mutation and altered neuronal activity have remained unclear. Here, we employed genetically engineered cells, in which the IVS10+16 mutation was introduced into healthy donor iPSCs to increase the expression of 4R tau isoform in exon 10, aiming to explore key physiological traits of iPSC-derived MAPT IVS10+16 neurons using patch-clamp electrophysiology and multiphoton fluorescent imaging techniques. We found that during late in vitro neurogenesis (from ~180 to 230 days) iPSC-derived cortical neurons of the control group (parental wild-type tau) exhibited membrane properties compatible with “mature” neurons. In contrast,MAPT IVS10+16 neurons displayed impaired excitability, as reflected by a depolarized resting membrane potential, an increased input resistance, and reduced voltage-gated Na+- and K+-channel-mediated currents. The mutation changed the channel properties of fast-inactivating Na v and decreased the Na v 1.6 protein level.MAPT IVS10+16 neurons exhibited reduced firing accompanied by a changed action potential waveform and severely disturbed intracellular Ca 2+dynamics, both in the soma and dendrites, upon neuronal depolarization. These results unveil a causal link between the MAPT 10+16 mutation, hence overproduction of 4R tau, and a dysfunction of human cells, identifying a biophysical basis of changed neuronal activity in 4R tau-triggered dementia. Our study lends further support to using iPSC lines as a suitable platform for modelling tau-induced human neuropathology in vitro.
Overview
The claims and statistics of this paper haven’t been checked yet.
Run the check — free, no account needed. It reads the open-access text and checks the sources it cites.
Integrity signals
Registry
Cites
Statistics
Figures
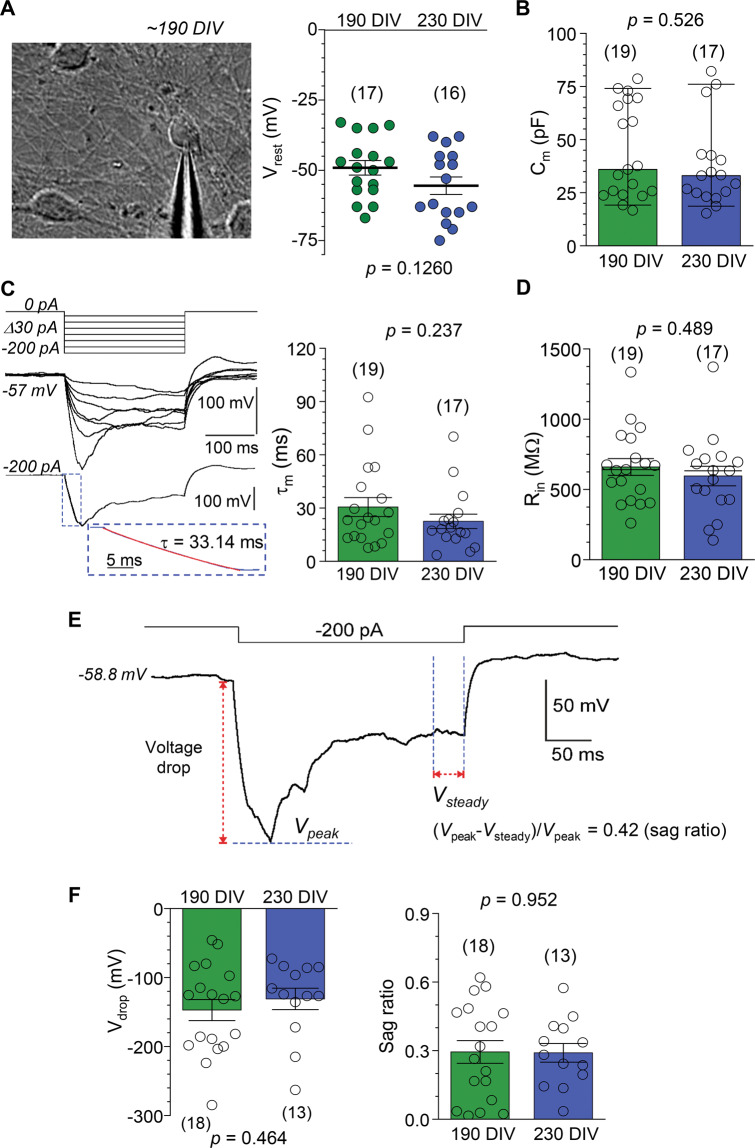
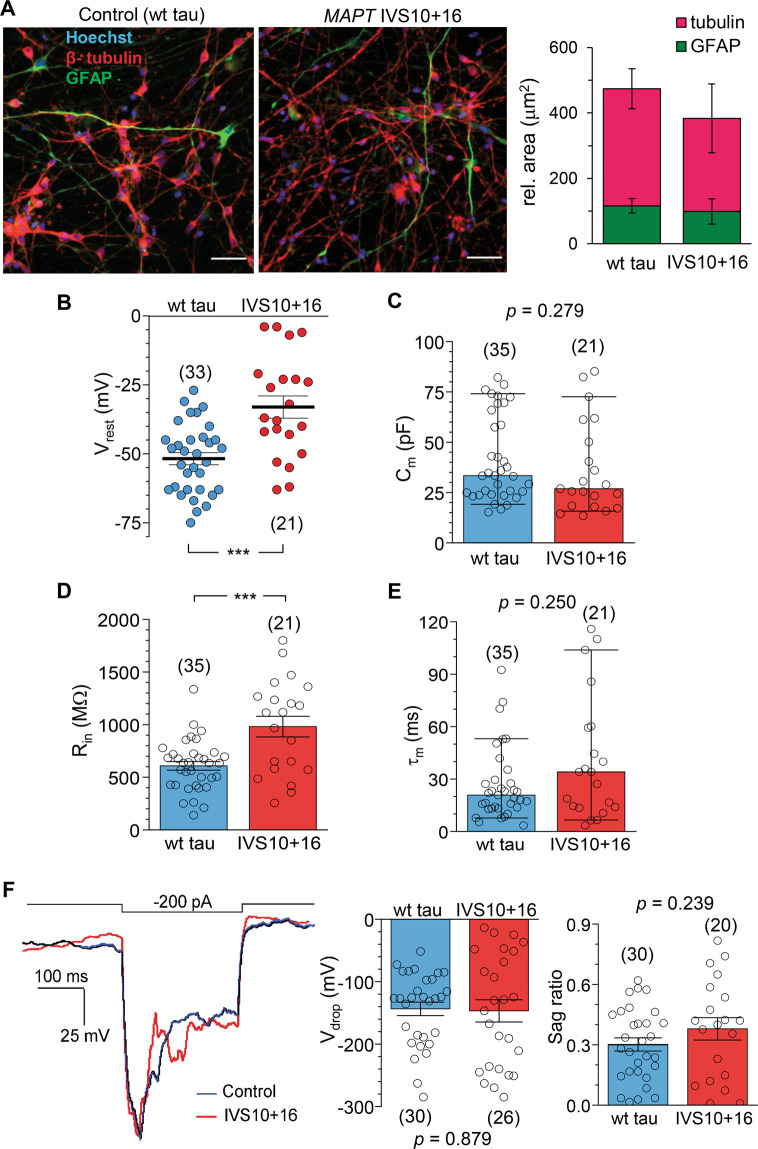
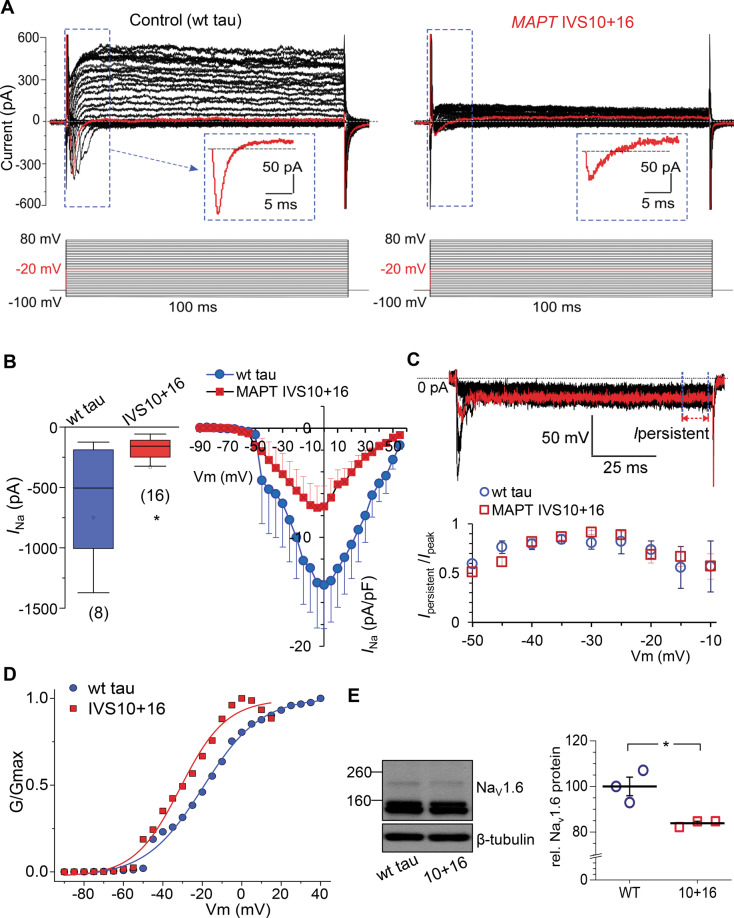
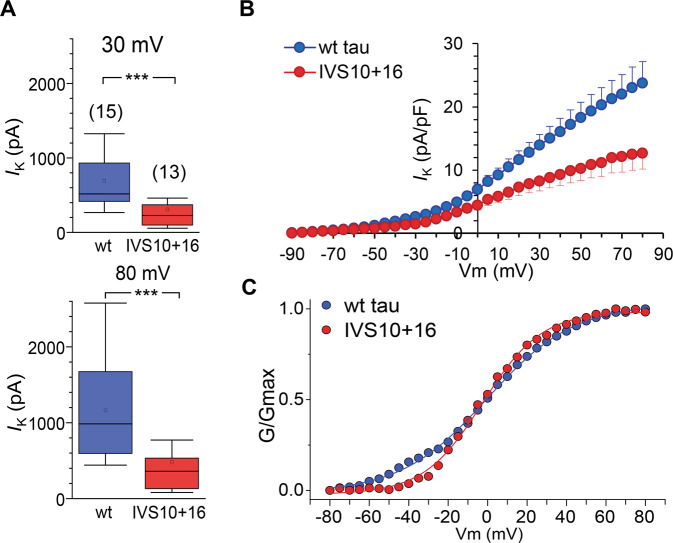
Verification
Claims the paper makes
The claims and statistics of this paper haven’t been checked yet.
Run the check — free, no account needed. It reads the open-access text and checks the sources it cites.
Claims other papers make about this one
Each is checked against this paper’s own text: does it say what the citing paper says it does?
In the citing paper
“Mature neurons derived from 10 + 16 hiPSCs with 120-day-long differentiation protocol are obtained to recapitulate several FTD hallmarks: 4R/3R Tau unbalance, neurodegenerative and neurodevelopmental phenotypes [48] and impaired neuronal excitability [49, 50].”
From miR-92a-3p and miR-320a are Upregulated in Plasma Neuron-Derived Extracellular Vesicles of Patients with Frontotemporal Dementia (2025) · cites this paper as [50]
Self-check
Percentages, sums and reported differences re-computed from the paper’s own numbers.
The self-check needs the paper’s full text.
Citations
Cites
Tau impairs neural circuits, dominating amyloid-β effects, in Alzheimer models in vivo
Busche, M. A., Wegmann, S., Dujardin, S., Commins, C., Schiantarelli, J., Klickstein, N., Kamath, T. V., Carlson, G. A., Nelken, I., & Hyman, B. T. (2019) · Nature Neuroscience · doi:10.1038/s41593-018-0289-8 · Cited by 413
Meier, S., Bell, M., Lyons, D. N., Rodriguez-Rivera, J., Ingram, A., Fontaine, S. N., Mechas, E., Chen, J., Wolozin, B., LeVine, H., et al. (2016) · The Journal of Neuroscience · doi:10.1523/jneurosci.3029-15.2016 · Cited by 190
Pathological Tau Disrupts Ongoing Network Activity
Menkes-Caspi, N., Yamin, H. G., Kellner, V., Spires-Jones, T. L., Cohen, D., & Stern, E. A. (2015) · Neuron · doi:10.1016/j.neuron.2015.01.025 · Cited by 184
Astroglial Calcium Signaling in Aging and Alzheimer's Disease
Verkhratsky, A. (2019) · Cold Spring Harbor Perspectives in Biology · doi:10.1101/cshperspect.a035188 · Cited by 99
Using Human iPSC-Derived Neurons to Model TAU Aggregation
Verheyen, A., Diels, A., Dijkmans, J., Oyelami, T., Meneghello, G., Mertens, L., Versweyveld, S., Borgers, M., Buist, A., Peeters, P., et al. (2015) · PLOS ONE · doi:10.1371/journal.pone.0146127 · Cited by 86
Esteras, N., Kundel, F., Amodeo, G. F., Pavlov, E. V., Klenerman, D., & Abramov, A. Y. (2021) · The FEBS Journal · doi:10.1111/febs.15340 · Cited by 78 · cited 2×
“The pathogenic tau protein was found to promote Ca influx through muscarinic receptors [59] and glutamate receptors in primary brain neurons and astrocytes [12, 60], but failed to induce Ca release from Ca stores of the endoplasmic reticulum [10].”
BackgroundSelf-citation
Research works printed but not linked: 54
- Goedert M, Spillantini MG, Jakes R, Rutherford D, Crowther RA. Multiple isoforms of human microtubule-associated protein tau: sequences and localization in neurofibrillary tangles of Alzheimer’s disease. Neuron. 1989;3:519–26. · DOI · Paper page
- Matsuo ES, Shin RW, Billingsley ML, Van deVoorde A, O’Connor M, Trojanowski JQ, et al. Biopsy-derived adult human brain tau is phosphorylated at many of the same sites as Alzheimer’s disease paired helical filament tau. Neuron. 1994;13:989–1002. · DOI
- Ishizawa T, Mattila P, Davies P, Wang D, Dickson DW. Colocalization of tau and alpha-synuclein epitopes in Lewy bodies. J Neuropathol Exp Neurol. 2003;62:389–97. · DOI
- Hutton M, Lendon CL, Rizzu P, Baker M, Froelich S, Houlden H, et al. Association of missense and 5’-splice-site mutations in tau with the inherited dementia FTDP-17. Nature. 1998;393:702–5. · DOI · Paper page
- Pickering-Brown SM, Richardson AM, Snowden JS, McDonagh AM, Burns A, Braude W, et al. Inherited frontotemporal dementia in nine British families associated with intronic mutations in the tau gene. Brain: J Neurol. 2002;125:732–51. · DOI
- Poorkaj P, Bird TD, Wijsman E, Nemens E, Garruto RM, Anderson L, et al. Tau is a candidate gene for chromosome 17 frontotemporal dementia. Ann Neurol. 1998;43:815–25. · DOI · Paper page
- Schweers O, Schönbrunn-Hanebeck E, Marx A, Mandelkow E. Structural studies of tau protein and Alzheimer paired helical filaments show no evidence for beta-structure. J Biol Chem. 1994;269:24290–7. · DOI
- Bunker JM, Kamath K, Wilson L, Jordan MA, Feinstein SC. FTDP-17 mutations compromise the ability of tau to regulate microtubule dynamics in cells. J Biol Chem. 2006;281:11856–63. · DOI
- Kadavath H, Hofele RV, Biernat J, Kumar S, Tepper K, Urlaub H, et al. Tau stabilizes microtubules by binding at the interface between tubulin heterodimers. Proc. Natl Acad. Sci. USA. 2015;112:7501–6. · DOI · Paper page
- Mahoney R, Ochoa Thomas E, Ramirez P, Miller HE, Beckmann A, Zuniga G, et al. Pathogenic tau causes a toxic depletion of nuclear calcium. Cell Rep. 2020;32:107900. · DOI
- Esteras N, Kopach O, Maiolino M, Lariccia V, Amoroso S, Qamar S, et al. Mitochondrial ROS control neuronal excitability and cell fate in frontotemporal dementia. Alzheimers Dement. 2021. https://doi.org/10.1002/alz.12394. · DOI
- Garcia ML, Cleveland DW. Going new places using an old MAP: tau, microtubules and human neurodegenerative disease. Curr Opin Cell Biol. 2001;13:41–48. · DOI
- Iovino M, Agathou S, Gonzalez-Rueda A, Del Castillo Velasco-Herrera M, Borroni B, Alberici A, et al. Early maturation and distinct tau pathology in induced pluripotent stem cell-derived neurons from patients with MAPT mutations. Brain: J Neurol. 2015;138:3345–59. · DOI · Paper page
- Ortiz-Virumbrales M, Moreno CL, Kruglikov I, Marazuela P, Sproul A, Jacob S, et al. CRISPR/Cas9-Correctable mutation-related molecular and physiological phenotypes in iPSC-derived Alzheimer’s PSEN2 (N141I) neurons. Acta Neuropathol. Commun. 2017;5:77. · DOI
- Sposito T, Preza E, Mahoney CJ, Seto-Salvia N, Ryan NS, Morris HR, et al. Developmental regulation of tau splicing is disrupted in stem cell-derived neurons from frontotemporal dementia patients with the 10 + 16 splice-site mutation in MAPT. Hum Mol Genet. 2015;24:5260–9. · DOI · Paper page
- Kopach O, Esteras N, Wray S, Rusakov DA, Abramov AY. Maturation and phenotype of pathophysiological neuronal excitability of human cells in tau-related dementia. J Cell Sci. 2020;133:10. · DOI · Paper page
- Esteras N, Rohrer JD, Hardy J, Wray S, Abramov AY. Mitochondrial hyperpolarization in iPSC-derived neurons from patients of FTDP-17 with 10+16 MAPT mutation leads to oxidative stress and neurodegeneration. Redox Biol. 2017;12:410–22. · DOI
- Verheyen A, Diels A, Reumers J, Van Hoorde K, Van den Wyngaert I, van Outryve d’Ydewalle C, et al. Genetically engineered iPSC-Derived FTDP-17 MAPT neurons display mutation-specific neurodegenerative and neurodevelopmental phenotypes. Stem Cell Rep. 2018;11:363–79. · DOI · Paper page
- Shi Y, Kirwan P, Livesey FJ. Directed differentiation of human pluripotent stem cells to cerebral cortex neurons and neural networks. Nat Protoc. 2012;7:1836–46. · DOI · Paper page
- Kopach O, Rybachuk O, Krotov V, Kyryk V, Voitenko N, Pivneva T. Maturation of neural stem cells and integration into hippocampal circuits—a functional study in an in situ model of cerebral ischemia. J Cell Sci. 2018;131:1–10. · DOI
- Henneberger C, Bard L, Panatier A, Reynolds JP, Kopach O, Medvedev NI, et al. LTP induction boosts glutamate spillover by driving withdrawal of perisynaptic astroglia. Neuron. 2020;108:919–.e911. · DOI
- Kopach O, Zheng K, Rusakov DA. Optical monitoring of glutamate release at multiple synapses in situ detects changes following LTP induction. Mol Brain. 2020;13:39. · DOI
- Kopach O, Zheng K, Sindeeva OA, Gai M, Sukhorukov GB, Rusakov DA. Polymer microchamber arrays for geometry-controlled drug release: a functional study in human cells of neuronal phenotype. Biomater Sci. 2019;7:2358–71. · DOI
- Michaluk P, Heller JP, Rusakov DA. Rapid recycling of glutamate transporters on the astroglial surface. Elife. 2021. https://doi.org/10.7554/eLife.64714. · DOI
- Rusakov DA, Fine A. Extracellular Ca2+ depletion contributes to fast activity-dependent modulation of synaptic transmission in the brain. Neuron. 2003;37:287–97. · DOI
- Kalmbach BE, Buchin A, Long B, Close J, Nandi A, Miller JA, et al. h-Channels contribute to divergent intrinsic membrane properties of supragranular pyramidal. Neurons Hum versus Mouse Cereb Cortex Neuron. 2018;100:1194–.e1195.
- Nolan MF, Malleret G, Dudman JT, Buhl DL, Santoro B, Gibbs E, et al. A behavioral role for dendritic integration: HCN1 channels constrain spatial memory and plasticity at inputs to distal dendrites of CA1 pyramidal neurons. Cell. 2004;119:719–32.
- Magee JC. Dendritic hyperpolarization-activated currents modify the integrative properties of hippocampal CA1 pyramidal neurons. J Neurosci. 1998;18:7613–24. · DOI · Paper page
- Gawlak M, Szulczyk B, Berłowski A, Grzelka K, Stachurska A, Pełka J, et al. Age-dependent expression of Nav1.9 channels in medial prefrontal cortex pyramidal neurons in rats. Dev Neurobiol. 2017;77:1371–84. · DOI
- Cummins TR, Xia Y, Haddad GG. Functional properties of rat and human neocortical voltage-sensitive sodium currents. J Neurophysiol. 1994;71:1052–64. · DOI
- Hu W, Tian C, Li T, Yang M, Hou H, Shu Y. Distinct contributions of Na(v)1.6 and Na(v)1.2 in action potential initiation and backpropagation. Nat Neurosci. 2009;12:996–1002. · DOI · Paper page
- Zhang W, Tarutani A, Newell KL, Murzin AG, Matsubara T, Falcon B, et al. Novel tau filament fold in corticobasal degeneration. Nature. 2020;580:283–7. · DOI
- Mann DMA, Snowden JS. Frontotemporal lobar degeneration: pathogenesis, pathology and pathways to phenotype. Brain Pathol. 2017;27:723–36. · DOI
- Ling H, Kovacs GG, Vonsattel JP, Davey K, Mok KY, Hardy J, et al. Astrogliopathy predominates the earliest stage of corticobasal degeneration pathology. Brain: J Neurol. 2016;139:3237–52. · DOI
- Kovacs GG, Pittman A, Revesz T, Luk C, Lees A, Kiss E, et al. MAPT S305I mutation: implications for argyrophilic grain disease. Acta Neuropathol. 2008;116:103–18. · DOI
- Kovacs GG, Majtenyi K, Spina S, Murrell JR, Gelpi E, Hoftberger R, et al. White matter tauopathy with globular glial inclusions: a distinct sporadic frontotemporal lobar degeneration. J Neuropathol Exp Neurol. 2008;67:963–75. · DOI
- Iwasaki Y, Mori K, Ito M, Tatsumi S, Mimuro M, Kuwano R, et al. An autopsied case of unclassifiable sporadic four-repeat tauopathy presenting with parkinsonism and speech disturbances. Neuropathology. 2016;36:295–304. · DOI
- Nakano M, Riku Y, Nishioka K, Hasegawa M, Washimi Y, Arahata Y, et al. Unclassified four-repeat tauopathy associated with familial parkinsonism and progressive respiratory failure. Acta Neuropathol Commun. 2020;8:148. · DOI
- Ingram EM, Spillantini MG. Tau gene mutations: dissecting the pathogenesis of FTDP-17. Trends Mol Med. 2002;8:555–62. · DOI
- Medda X, Mertens L, Versweyveld S, Diels A, Barnham L, Bretteville A, et al. Development of a scalable, high-throughput-compatible assay to detect tau aggregates using iPSC-derived cortical neurons maintained in a three-dimensional culture format. J Biomol Screen. 2016;21:804–15. · DOI
- García-León JA, Cabrera-Socorro A, Eggermont K, Swijsen A, Terryn J, Fazal R, et al. Generation of a human induced pluripotent stem cell-based model for tauopathies combining three microtubule-associated protein TAU mutations which displays several phenotypes linked to neurodegeneration. Alzheimers Dement. 2018;14:1261–80. · DOI
- Fieblinger T, Graves SM, Sebel LE, Alcacer C, Plotkin JL, Gertler TS, et al. Cell type-specific plasticity of striatal projection neurons in parkinsonism and L-DOPA-induced dyskinesia. Nat Commun. 2014;5:5316. · DOI
- Bok E, Leem E, Lee BR, Lee JM, Yoo CJ, Lee EM, et al. Role of the lipid membrane and membrane proteins in tau pathology. Front Cell Dev Biol. 2021;9:653815. · DOI · Paper page
- Mari SA, Wegmann S, Tepper K, Hyman BT, Mandelkow EM, Mandelkow E, et al. Reversible cation-selective attachment and self-assembly of human tau on supported brain lipid membranes. Nano Lett. 2018;18:3271–81. · DOI
- Fanni AM, Vander Zanden CM, Majewska PV, Majewski J, Chi EY. Membrane-mediated fibrillation and toxicity of the tau hexapeptide PHF6. J Biol Chem. 2019;294:15304–17. · DOI
- Shrivastava AN, Redeker V, Pieri L, Bousset L, Renner M, Madiona K, et al. Clustering of Tau fibrils impairs the synaptic composition of α3-Na(+)/K(+)-ATPase and AMPA receptors. EMBO J. 2019;38:1–22. · DOI
- Solé L, Tamkun MM. Trafficking mechanisms underlying Na(v) channel subcellular localization in neurons. Channels (Austin). 2020;14:1–17. · DOI
- Estacion M, O’Brien JE, Conravey A, Hammer MF, Waxman SG, Dib-Hajj SD, et al. A novel de novo mutation of SCN8A (Nav1.6) with enhanced channel activation in a child with epileptic encephalopathy. Neurobiol Dis. 2014;69:117–23. · DOI
- Lopez-Santiago LF, Yuan Y, Wagnon JL, Hull JM, Frasier CR, O’Malley HA, et al. Neuronal hyperexcitability in a mouse model of SCN8A epileptic encephalopathy. Proc Natl Acad Sci USA. 2017;114:2383–8. · DOI
- Wagnon JL, Barker BS, Ottolini M, Park Y, Volkheimer A, Valdez P, et al. Loss-of-function variants of SCN8A in intellectual disability without seizures. Neurol Genet. 2017;3:e170. · DOI
- Bezprozvanny I, Mattson MP. Neuronal calcium mishandling and the pathogenesis of Alzheimer’s disease. Trends Neurosci. 2008;31:454–63. · DOI · Paper page
- Lim D, Rodríguez-Arellano JJ, Parpura V, Zorec R, Zeidán-Chuliá F, Genazzani AA, et al. Calcium signalling toolkits in astrocytes and spatio-temporal progression of Alzheimer’s disease. Curr Alzheimer Res. 2016;13:359–69. · DOI
- Gómez-Ramos A, Díaz-Hernández M, Rubio A, Miras-Portugal MT, Avila J. Extracellular tau promotes intracellular calcium increase through M1 and M3 muscarinic receptors in neuronal cells. Mol Cell Neurosci. 2008;37:673–81. · DOI
- Britti E, Ros J, Esteras N, Abramov AY. Tau inhibits mitochondrial calcium efflux and makes neurons vulnerable to calcium-induced cell death. Cell Calcium. 2020;86:102150. · DOI
Cited by
Sorted by citations
Manzini, V., Cappelletti, P., Orefice, N. S., Brentari, I., Rigby, M. J., Lo Giudice, M., Feligioni, M., Rivabene, R., Crestini, A., Manfredi, F., et al. (2025) · Molecular Neurobiology · doi:10.1007/s12035-024-04386-z · Cited by 16
Metadata
- Authors
- Kopach, O., Esteras, N., Wray, S., Abramov, A. Y., & Rusakov, D. A.
- Venue
- Cell Death & Disease
- Published
- 2021-07-17
- Volume
- 12
- Issue
- 8
- ISSN
- 2041-4889
- PMC
- PMC8286258
- Cited by
- 26
- References
- 6
- Language
- en
- Funders
- Alzheimer’s Research UK (ARUKSRF2016B-2)
- NIHR UCLH/UCL Biomedical Research Centre
- RCUK | Engineering and Physical Sciences Research Council (EP/R024898/1)
- Wellcome Trust (212251_Z_18_Z)
- European Commission (NEUROTWIN grant 857562)
About these checks
Registry, retraction, Cites and statistics results are computed, not judged, with one exception: a printed reference that no index lists is read once by a model before it counts as a citation error. Claims are extracted by a model and kept only when their quote appears verbatim in the text; each cited source is then checked, with a model’s help, for whether it says what the claim relies on. Those verdicts can be wrong — read the claim’s quote and the cited source before relying on one.
Statistics and arithmetic are recomputed, not judged.
Confidence bands are shown only for fields calibrated on our annotated test set. None is calibrated yet, so no band is shown.
What counts as a claim ›How we measure confidence ›How we check this ›
Are you an author, or do you see a problem with this page? Request a review
