Cited by 41

The DOI matches its Crossref record; 4 of the 4 references it cites were found in a registry or an index.

Anti-mitotic chemotherapeutics promote apoptosis through TL1A-activated death receptor 3 in cancer cells

Qi, Chen, Wang, Xin, Shen, Zhirong, Chen, She, Yu, Hong, Williams, Noelle, Wang, Gelin·2018·Cell Research

Overview

The claims and statistics of this paper haven’t been checked yet.

Run the check — free, no account needed. It reads the open-access text and checks the sources it cites.

A few free checks a day · papers already verified open instantly · results are public

Integrity signals

Registry

Crossref · 10.1038/s41422-018-0018-6

Cites

4 of 4 references verified0 citation errors · 0 not checkable

Statistics

Figures

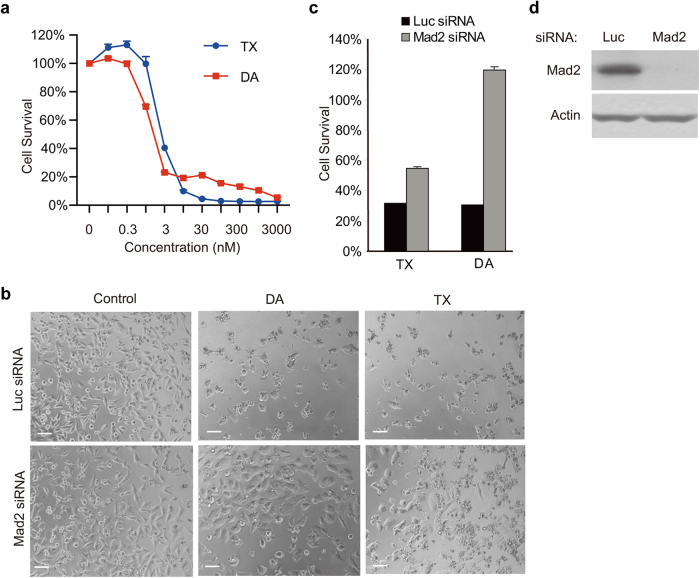
Fig. 1 Depletion of spindle checkpoint blocks cell death induced by diazonamide or taxol. a Dose-dependent killing of HeLa cells by diazonamide (DA) or taxol (TX). Cells were treated with indicated concentrations of diazonamide or taxol. Cell viability was determined by measuring ATP levels using the CellTiter-Glo assay kit. In this and all the subsequent studies, cell survival was presented as the percentage of viable or dead cells compared with untreated control, and is represented as the mean ± s.d. of triplicates. b–d Effect of knockdown of spindle checkpoint protein Mad2 on diazonamide- or taxol- induced cell death. b HeLa cells were transfected with Luciferase siRNA or Mad2 siRNA for 24 h prior to incubation with 100 nM diazonamide or taxol for another 48 h. Phase-contrast images of cells are shown. Scale bars represent 100 µm. c Cell viability was determined after 48 h treatment of 100 nM diazonamide or taxol. d Mad2 knockdown efficiency was analyzed by western blotting with an anti-Mad2 antibody and normalized by Actin
Fig. 1 Depletion of spindle checkpoint blocks cell death induced by diazonamide or taxol. a Dose-dependent killing of HeLa cells by diazonamide (DA) or taxol (TX). Cells were treated with indicated concentrations of diazonamide or taxol. Cell viability was determined by measuring ATP levels using the CellTiter-Glo assay kit. In this and all the subsequent studies, cell survival was presented as the percentage of viable or dead cells compared with untreated control, and is represented as the mean ± s.d. of triplicates. b–d Effect of knockdown of spindle checkpoint protein Mad2 on diazonamide- or taxol- induced cell death. b HeLa cells were transfected with Luciferase siRNA or Mad2 siRNA for 24 h prior to incubation with 100 nM diazonamide or taxol for another 48 h. Phase-contrast images of cells are shown. Scale bars represent 100 µm. c Cell viability was determined after 48 h treatment of 100 nM diazonamide or taxol. d Mad2 knockdown efficiency was analyzed by western blotting with an anti-Mad2 antibody and normalized by ActinCC BY · PubMed Central
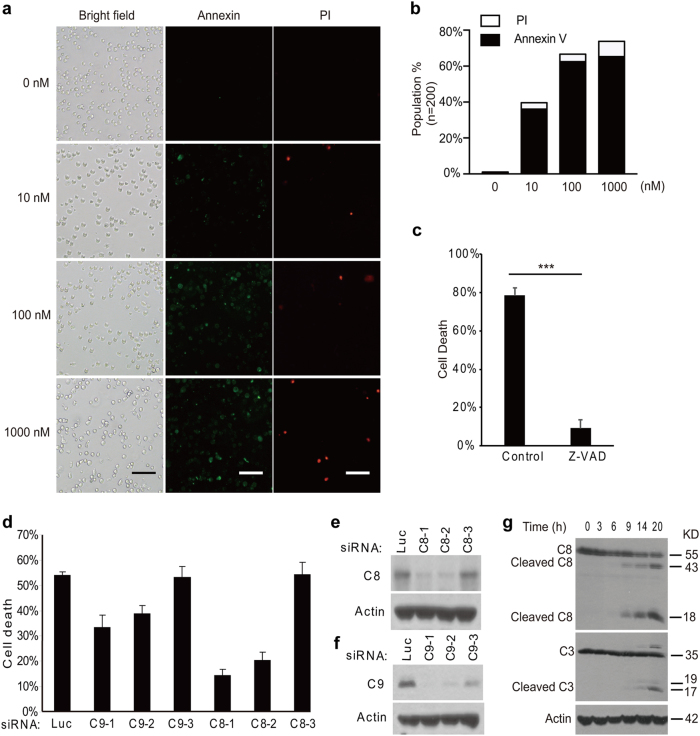
Fig. 2 Antimitotics induce caspase-8-dependent apoptosis. a Fluorescent images of Annexin V/PI staining of HeLa cells treated with DMSO or indicated concentrations of diazonamide for 16 h. Scale bar: 100 μm. b The quantification of the cells positive for Annexin V or PI staining (n = 200). c HeLa cells were pretreated with 100 μM z-VAD for 2 h followed by 48 h treatment of 100 nM diazonamide (*p < 0.001). d–f HeLa cells were transfected with multiple siRNAs targeting caspase-8 or caspase-9. After 48 h, the cells were treated with 100 nM diazonamide for another 48 h. d Cell viability was determined by measuring ATP levels. e, f Whole-cell extracts were prepared followed by western blotting analysis for caspase-8 or caspase-9. g HeLa cells were treated with 100 nM diazonamide for the indicated time. Caspase activation, the hallmark of apoptosis, was determined by western blotting with anti-caspase-8 and anti-caspase-3 antibodies
Fig. 2 Antimitotics induce caspase-8-dependent apoptosis. a Fluorescent images of Annexin V/PI staining of HeLa cells treated with DMSO or indicated concentrations of diazonamide for 16 h. Scale bar: 100 μm. b The quantification of the cells positive for Annexin V or PI staining (n = 200). c HeLa cells were pretreated with 100 μM z-VAD for 2 h followed by 48 h treatment of 100 nM diazonamide (*p < 0.001). d–f HeLa cells were transfected with multiple siRNAs targeting caspase-8 or caspase-9. After 48 h, the cells were treated with 100 nM diazonamide for another 48 h. d Cell viability was determined by measuring ATP levels. e, f Whole-cell extracts were prepared followed by western blotting analysis for caspase-8 or caspase-9. g HeLa cells were treated with 100 nM diazonamide for the indicated time. Caspase activation, the hallmark of apoptosis, was determined by western blotting with anti-caspase-8 and anti-caspase-3 antibodiesCC BY · PubMed Central
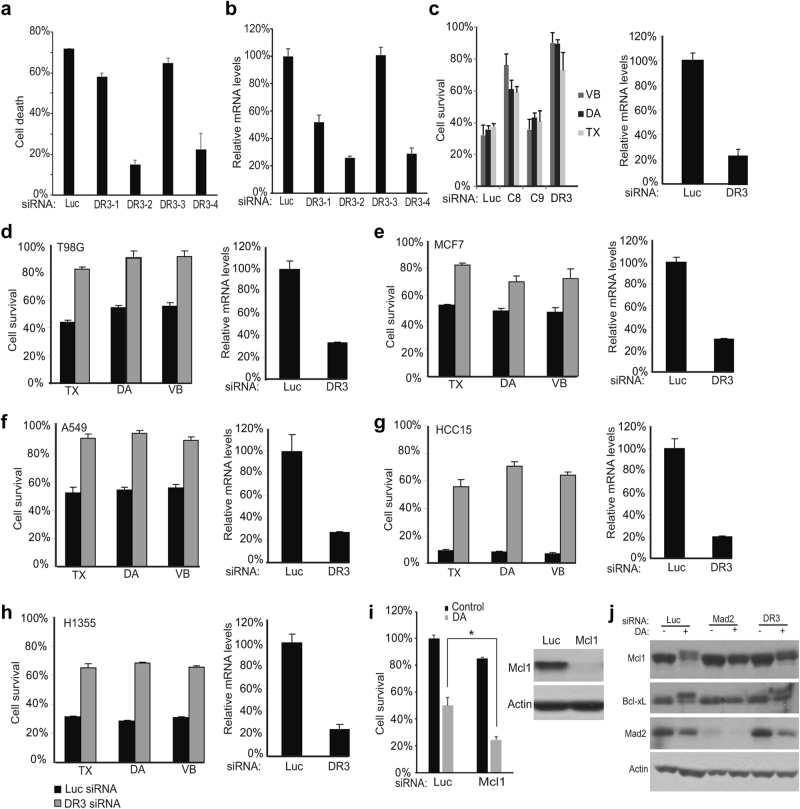
Fig. 3 DR3 is necessary for apoptotic cell death. a HeLa cells were transfected with four DR3 siRNAs for 48 h. The cells were then treated with 100 nM diazonamide for another 48 h. The cell viability was determined by measuring ATP levels. b DR3 mRNA levels in knockdown cells were analyzed using quantitative RT-PCR. c HeLa cells were transfected with siRNAs targeting caspase-8, caspase-9 or DR3. After 48 h, the cells were treated with 100 nM diazonamide (DA), 100 nM taxol (TX) or 30 nM vinblastine (VB) for another 48 h. d–h DR3 is critical in initiating apoptosis induced by taxol, diazonamide or vinblastine in a variety of cancer cell lines. The cells were transfected with Luciferase or DR3 siRNA oligos followed by treatment with 100 nM diazonamide or taxol, or 30 nM vinblastine for 48 h. Cell viability (left panel) and DR3 mRNA levels (right panel) were determined. The following cancer cells were tested: (d) T98G (brain glioblastoma), (e) MCF7 (breast cancer), (f) A549 (lung cancer), (g) HCC15 (lung cancer), and (h) H1355 (lung cancer). i Knockdown of Mcl1 sensitizes HeLa cells to diazonamide. Mcl1 was knocked down in HeLa cells. Cell viability was determined by measuring cellular ATP levels (left panel) (*p < 0.05). The Mcl1 levels were measured by western blotting (right panel). j The effect of DR3 on the mitotic regulation of Mcl1 and Bcl-xL. Mad2 and DR3 in HeLa cells were knocked down followed by treatment with DMSO or diazonamide for 12 h. The cell lysates were analyzed by western blotting using antibodies as indicated
Fig. 3 DR3 is necessary for apoptotic cell death. a HeLa cells were transfected with four DR3 siRNAs for 48 h. The cells were then treated with 100 nM diazonamide for another 48 h. The cell viability was determined by measuring ATP levels. b DR3 mRNA levels in knockdown cells were analyzed using quantitative RT-PCR. c HeLa cells were transfected with siRNAs targeting caspase-8, caspase-9 or DR3. After 48 h, the cells were treated with 100 nM diazonamide (DA), 100 nM taxol (TX) or 30 nM vinblastine (VB) for another 48 h. d–h DR3 is critical in initiating apoptosis induced by taxol, diazonamide or vinblastine in a variety of cancer cell lines. The cells were transfected with Luciferase or DR3 siRNA oligos followed by treatment with 100 nM diazonamide or taxol, or 30 nM vinblastine for 48 h. Cell viability (left panel) and DR3 mRNA levels (right panel) were determined. The following cancer cells were tested: (d) T98G (brain glioblastoma), (e) MCF7 (breast cancer), (f) A549 (lung cancer), (g) HCC15 (lung cancer), and (h) H1355 (lung cancer). i Knockdown of Mcl1 sensitizes HeLa cells to diazonamide. Mcl1 was knocked down in HeLa cells. Cell viability was determined by measuring cellular ATP levels (left panel) (*p < 0.05). The Mcl1 levels were measured by western blotting (right panel). j The effect of DR3 on the mitotic regulation of Mcl1 and Bcl-xL. Mad2 and DR3 in HeLa cells were knocked down followed by treatment with DMSO or diazonamide for 12 h. The cell lysates were analyzed by western blotting using antibodies as indicatedCC BY · PubMed Central
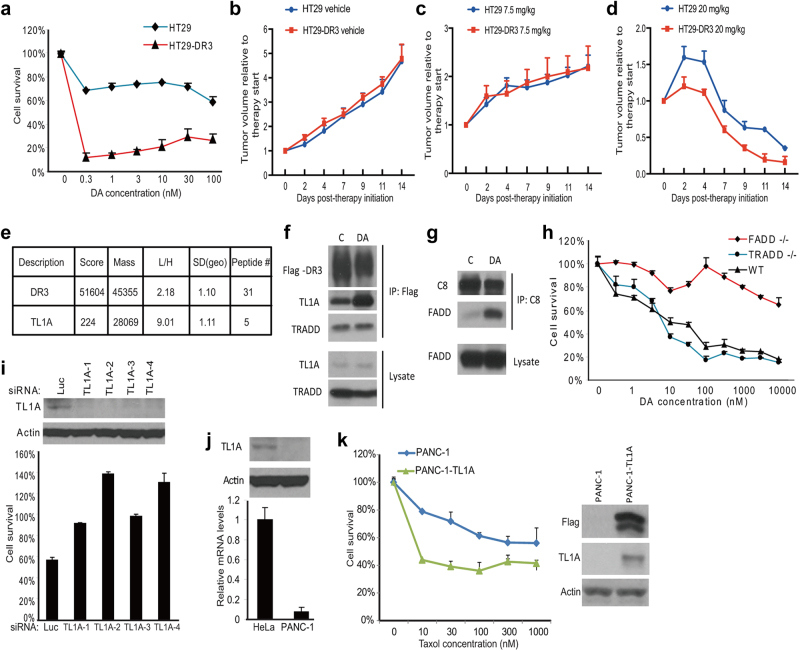
Fig. 4 The ligand of DR3, TL1A, is required for DR3-mediated apoptosis. a The cell line stably expressing Flag-tagged DR3 was established in HT29 cells. Dose response curves of HT29 cells and HT29-DR3 cells to diazonamide were plotted. Cell viability was measured after 48 h of treatment. b–d HT29 or HT29-DR3 tumor-bearing mice were treated with vehicle (b), 7.5 mg/kg taxol (c), or 20 mg/kg taxol (d) for the indicated time. Tumor growth was monitored. Error bars, SEM. e Identification of TL1A as the only TNF family death ligand bound to DR3. A SILAC experiment was carried out to quantify the DR3 binding proteins as described in the Materials and Methods. HT29-DR3 cells growing in the light medium were treated with 100 nM diazonamide for 12 h. Untreated cells were grown in the heavy medium. Equally combined cell lysates were subjected to immunoprecipitation with an anti-Flag antibody. Proteins in the whole elution with 3× Flag peptide were quantified and the Light/Heavy ratios were calculated. SD (geo) stands for geometric s.d. The closer the SD (geo) is to 1, the better the protein quantification is. The median from peptide ratios was used as the protein ratio. (f) HT29-DR3 cells were treated with 100 nM diazonamide for 12 h. The DR3/TL1A complex was analyzed by Flag immunoprecipitation followed by western blotting with antibodies against Flag, TL1A, and TRADD. g HT29-DR3 cells were treated as in f. The DISC complex was analyzed by caspase-8 immunoprecipitation followed by western blotting with antibodies against caspase-8 and FADD. h The dose response curves of wild-type MEFs, FADD-/- MEFs, and TRADD-/- MEFs to diazonamide. i Knockdown of TL1A blocked anti-mitotics-induced apoptosis. HeLa cells were transfected with four TL1A siRNAs for three rounds before being treated with 100 nM diazonamide for 48 h. Cell viability was determined (lower panel). Protein levels of TL1A in the knockdown cells were determined by western blotting with an anti-TL1A antibody (upper panel). j, k Exogenous expression of TL1A sensitizes PANC-1 cells to taxol. j The relative TL1A mRNA levels in HeLa and PANC-1 cells were determined by qRT-PCR (lower panel). TL1A protein levels in HeLa or PANC-1 cells were determined by western blotting with anti-TL1A and anti-Actin antibodies (upper panel). k Flag-tagged TL1A was stably expressed in PANC-1 cells. Dose response curves to taxol were plotted for parental PANC-1 cells and PANC-1-TL1A cells. Cell viability was measured after 48 h treatment (left panel). Cell lysates from PANC-1 and PANC-1-TL1A cells were subjected to western blotting with anti-Flag, anti-TL1A and anti-Actin antibodies (right panel)
Fig. 4 The ligand of DR3, TL1A, is required for DR3-mediated apoptosis. a The cell line stably expressing Flag-tagged DR3 was established in HT29 cells. Dose response curves of HT29 cells and HT29-DR3 cells to diazonamide were plotted. Cell viability was measured after 48 h of treatment. b–d HT29 or HT29-DR3 tumor-bearing mice were treated with vehicle (b), 7.5 mg/kg taxol (c), or 20 mg/kg taxol (d) for the indicated time. Tumor growth was monitored. Error bars, SEM. e Identification of TL1A as the only TNF family death ligand bound to DR3. A SILAC experiment was carried out to quantify the DR3 binding proteins as described in the Materials and Methods. HT29-DR3 cells growing in the light medium were treated with 100 nM diazonamide for 12 h. Untreated cells were grown in the heavy medium. Equally combined cell lysates were subjected to immunoprecipitation with an anti-Flag antibody. Proteins in the whole elution with 3× Flag peptide were quantified and the Light/Heavy ratios were calculated. SD (geo) stands for geometric s.d. The closer the SD (geo) is to 1, the better the protein quantification is. The median from peptide ratios was used as the protein ratio. (f) HT29-DR3 cells were treated with 100 nM diazonamide for 12 h. The DR3/TL1A complex was analyzed by Flag immunoprecipitation followed by western blotting with antibodies against Flag, TL1A, and TRADD. g HT29-DR3 cells were treated as in f. The DISC complex was analyzed by caspase-8 immunoprecipitation followed by western blotting with antibodies against caspase-8 and FADD. h The dose response curves of wild-type MEFs, FADD-/- MEFs, and TRADD-/- MEFs to diazonamide. i Knockdown of TL1A blocked anti-mitotics-induced apoptosis. HeLa cells were transfected with four TL1A siRNAs for three rounds before being treated with 100 nM diazonamide for 48 h. Cell viability was determined (lower panel). Protein levels of TL1A in the knockdown cells were determined by western blotting with an anti-TL1A antibody (upper panel). j, k Exogenous expression of TL1A sensitizes PANC-1 cells to taxol. j The relative TL1A mRNA levels in HeLa and PANC-1 cells were determined by qRT-PCR (lower panel). TL1A protein levels in HeLa or PANC-1 cells were determined by western blotting with anti-TL1A and anti-Actin antibodies (upper panel). k Flag-tagged TL1A was stably expressed in PANC-1 cells. Dose response curves to taxol were plotted for parental PANC-1 cells and PANC-1-TL1A cells. Cell viability was measured after 48 h treatment (left panel). Cell lysates from PANC-1 and PANC-1-TL1A cells were subjected to western blotting with anti-Flag, anti-TL1A and anti-Actin antibodies (right panel)CC BY · PubMed Central
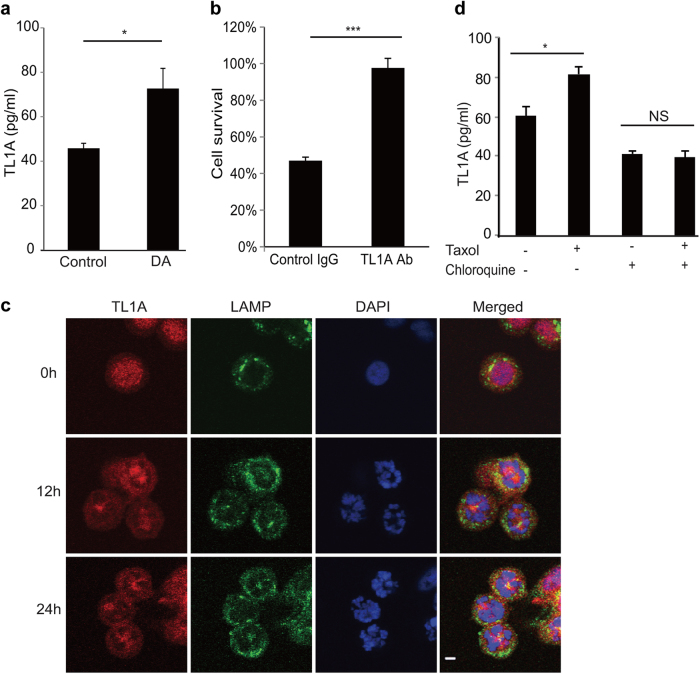
Fig. 5 Autocrine TL1A activates DR3. a HT29 cells were treated with or without 100 nM biotinylated diazonamide for 16 h before the conditioned cell culture media were removed for soluble TL1A analysis. A TL1A ELISA kit was used to determine the concentration of TL1A released into the media. b HT29 cells were treated as in a. Then biotinylated diazonamide was eliminated from condition medium by streptavidin agarose. The concentrated medium was applied to the HT29-DR3 cells pretreated with control IgG or TL1A neutralizing antibody. Values are presented as means ± s.d. c, d DR3 secretion is lysosome-dependent. c HT29-DR3 cells were grown in the chamber slides and treated with 100 nM taxol for the indicated time. Cells were fixed and stained with anti-TL1A and anti-LAMP2 antibodies. The slides were mounted in a medium containing DAPI to stain DNA (Scale bar: 5 μm). d HT29-DR3 cells were treated with 100 nM taxol in the presence or absence of 100 μM chloroquine for 16 h. TL1A ELISA kit was used to measure the concentrations of TL1A in the medium. *p < 0.05, ***p < 0.001
Fig. 5 Autocrine TL1A activates DR3. a HT29 cells were treated with or without 100 nM biotinylated diazonamide for 16 h before the conditioned cell culture media were removed for soluble TL1A analysis. A TL1A ELISA kit was used to determine the concentration of TL1A released into the media. b HT29 cells were treated as in a. Then biotinylated diazonamide was eliminated from condition medium by streptavidin agarose. The concentrated medium was applied to the HT29-DR3 cells pretreated with control IgG or TL1A neutralizing antibody. Values are presented as means ± s.d. c, d DR3 secretion is lysosome-dependent. c HT29-DR3 cells were grown in the chamber slides and treated with 100 nM taxol for the indicated time. Cells were fixed and stained with anti-TL1A and anti-LAMP2 antibodies. The slides were mounted in a medium containing DAPI to stain DNA (Scale bar: 5 μm). d HT29-DR3 cells were treated with 100 nM taxol in the presence or absence of 100 μM chloroquine for 16 h. TL1A ELISA kit was used to measure the concentrations of TL1A in the medium. *p < 0.05, ***p < 0.001CC BY · PubMed Central
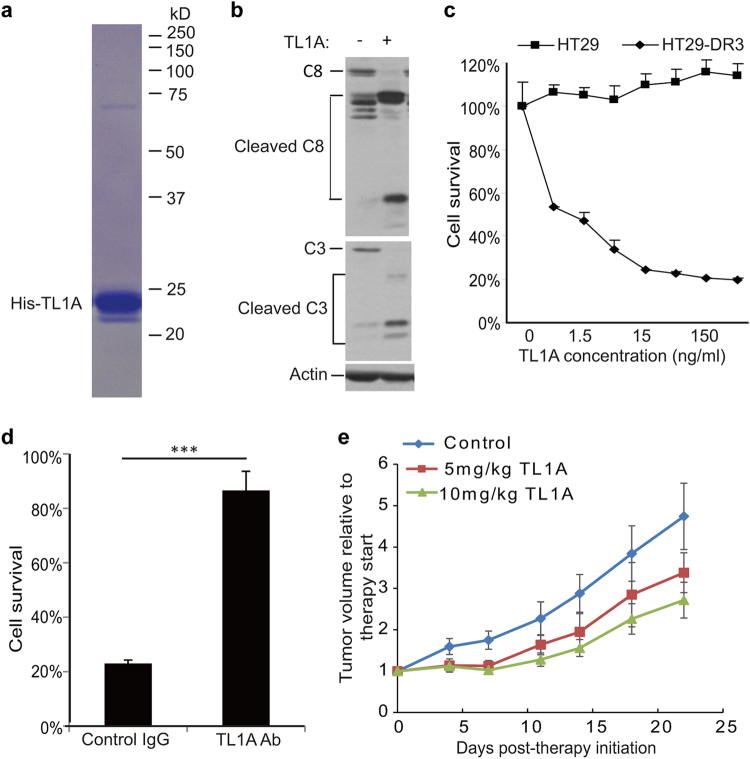
Fig. 6 Pro-apoptotic activity of recombinant TL1A against HT29-DR3 cells. a Purified recombinant His-tagged TL1A on the coomassie blue stained SDS-PAGE gel. b HT29-DR3 cells were treated with 100 ng/ml His-TL1A for 24 h. Cell lysates were subjected to western blotting analysis of caspase-8 and caspase-3 activation. c HT29 cells and HT29-DR3 cells were treated with the indicated concentrations of His-TL1A. After 72 h, cell viability was measured. d HT29-DR3 cells were co-treated with 100 ng/ml His-TL1A and 2 μg/ml TL1A neutralizing antibody for 72 h. Values are presented as means ± s.d. (***p < 0.001). e Relative tumor growth curves of xenografts derived from HT29-DR3 cells. Athymic nude mice were injected subcutaneously with HT29-DR3 cells and then randomly separated into three treatment groups: control (n = 6), TL1A at 5 mg/kg (n = 4), or 10 mg/kg (n = 5). The mice were given six intravenous injections of TL1A or saline every other day. Tumors were measured twice per week until the end of the experiment
Fig. 6 Pro-apoptotic activity of recombinant TL1A against HT29-DR3 cells. a Purified recombinant His-tagged TL1A on the coomassie blue stained SDS-PAGE gel. b HT29-DR3 cells were treated with 100 ng/ml His-TL1A for 24 h. Cell lysates were subjected to western blotting analysis of caspase-8 and caspase-3 activation. c HT29 cells and HT29-DR3 cells were treated with the indicated concentrations of His-TL1A. After 72 h, cell viability was measured. d HT29-DR3 cells were co-treated with 100 ng/ml His-TL1A and 2 μg/ml TL1A neutralizing antibody for 72 h. Values are presented as means ± s.d. (***p < 0.001). e Relative tumor growth curves of xenografts derived from HT29-DR3 cells. Athymic nude mice were injected subcutaneously with HT29-DR3 cells and then randomly separated into three treatment groups: control (n = 6), TL1A at 5 mg/kg (n = 4), or 10 mg/kg (n = 5). The mice were given six intravenous injections of TL1A or saline every other day. Tumors were measured twice per week until the end of the experimentCC BY · PubMed Central
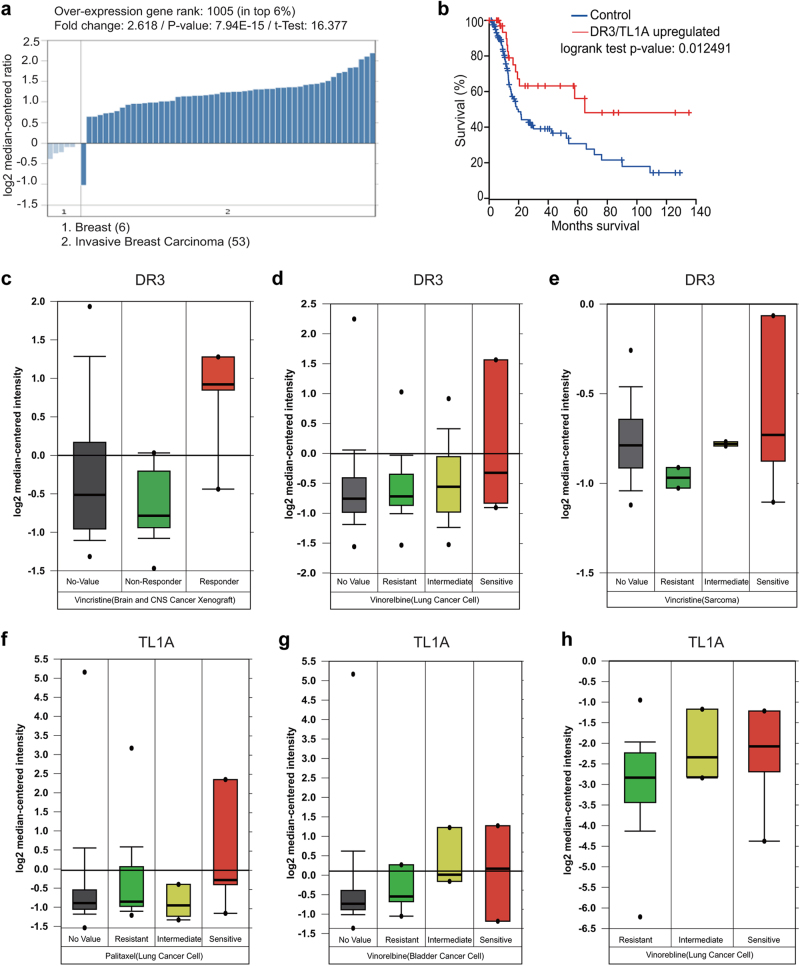
Fig. 7 Expression of DR3 and TL1A correlates with the apoptotic response of cancer cells. a TL1A is overexpressed in most breast cancers. The Oncomine analysis was performed in six normal breast tissues and 53 invasive breast carcinomas. b Breast cancer patients with higher expression of DR3 or TL1A show better prognosis. Kaplan–Meier survival curves were generated from The Cancer Genome Atlas using the invasive breast cancer datasets. c–h Box plot showing the significant association between DR3 (c–e) and TL1A (f–h) expression and the response to antimitotic drugs (Vincristine, Vinorelbine, Paclitaxel) in multiple cancer types (brain, lung, sarcoma, and bladder cancers). Data have three sources. First, the Pediatric Preclinical Testing program (PPTP) using human tumor xenograft models and derived cell lines; second, a large-scale screen using 639 human cancer cell lines that aims to identify drug-sensitivity biomarkers to a broad range of cancer drugs;41 third, expression signatures that associate with metastasis and resistance to chemotherapy in 27 initial tumor biopsies of Ewing’s sarcoma family of tumors (ESFT).42 Data were mined through the Oncomine website. The response to Vincristine in sarcoma cancer cells can be found at: https://www.oncomine.org/resource/ui/component/dataset.html?component=d:97761287. All other data can be found at: https://www.oncomine.org/resource/ui/component/dataset.html?component=d:156636665
Fig. 7 Expression of DR3 and TL1A correlates with the apoptotic response of cancer cells. a TL1A is overexpressed in most breast cancers. The Oncomine analysis was performed in six normal breast tissues and 53 invasive breast carcinomas. b Breast cancer patients with higher expression of DR3 or TL1A show better prognosis. Kaplan–Meier survival curves were generated from The Cancer Genome Atlas using the invasive breast cancer datasets. c–h Box plot showing the significant association between DR3 (c–e) and TL1A (f–h) expression and the response to antimitotic drugs (Vincristine, Vinorelbine, Paclitaxel) in multiple cancer types (brain, lung, sarcoma, and bladder cancers). Data have three sources. First, the Pediatric Preclinical Testing program (PPTP) using human tumor xenograft models and derived cell lines; second, a large-scale screen using 639 human cancer cell lines that aims to identify drug-sensitivity biomarkers to a broad range of cancer drugs;41 third, expression signatures that associate with metastasis and resistance to chemotherapy in 27 initial tumor biopsies of Ewing’s sarcoma family of tumors (ESFT).42 Data were mined through the Oncomine website. The response to Vincristine in sarcoma cancer cells can be found at: https://www.oncomine.org/resource/ui/component/dataset.html?component=d:97761287. All other data can be found at: https://www.oncomine.org/resource/ui/component/dataset.html?component=d:156636665CC BY · PubMed Central

Verification

Claims the paper makes

The claims and statistics of this paper haven’t been checked yet.

Run the check — free, no account needed. It reads the open-access text and checks the sources it cites.

A few free checks a day · papers already verified open instantly · results are public

Claims other papers make about this one

Each is checked against this paper’s own text: does it say what the citing paper says it does?

Self-check

Percentages, sums and reported differences re-computed from the paper’s own numbers.

The self-check needs the paper’s full text.

Citations

Cites

Research works printed but not linked: 43

  1. Wood, K. W., Cornwell, W. D. & Jackson, J. R. Past and future of the mitotic spindle as an oncology target. Curr. Opin. Pharmacol. 1, 370–377 (2001). · DOI
  2. Bhalla, K. N. Microtubule-targeted anticancer agents and apoptosis. Oncogene 22, 9075–9086 (2003). · DOI
  3. Jackson, J. R., Patrick, D. R., Dar, M. M. & Huang, P. S. Targeted antimitotic therapies: can we improve on tubulin agents? Nat. Rev. Cancer 7, 107–117 (2007). · DOI
  4. Jordan, M. A. & Wilson, L. Microtubules as a target for anticancer drugs. Nat. Rev. Cancer 4, 253–265 (2004). · DOI · Paper page
  5. Paull, K. D., Lin, C. M., Malspeis, L. & Hamel, E. Identification of novel antimitotic agents acting at the tubulin level by computer-assisted evaluation of differential cytotoxicity data. Cancer Res. 52, 3892–3900 (1992).
  6. Cruz-Monserrate, Z. et al. Diazonamide A and a synthetic structural analog: disruptive effects on mitosis and cellular microtubules and analysis of their interactions with tubulin. Mol. Pharmacol. 63, 1273–1280 (2003). · DOI
  7. Li, J., Burgett, A. W. G., Esser, L., Amezcua, C. & Harran, P. G. Total synthesis of nominal diazonamides. Part 2: On the true structure and origin of natural isolates. Angew. Chem. Int Ed. Engl. 40, 4770–4773 (2001). · DOI
  8. Wang, G., Shang, L., Burgett, A. W., Harran, P. G. & Wang, X. Diazonamide toxins reveal an unexpected function for ornithine delta-amino transferase in mitotic cell division. Proc. Natl Acad. Sci. USA 104, 2068–2073 (2007). · DOI
  9. Williams, N. S. et al. Therapeutic anticancer efficacy of a synthetic diazonamide analog in the absence of overt toxicity. Proc. Natl Acad. Sci. USA 104, 2074–2079 (2007). · DOI
  10. Wieczorek, M. et al. The synthetic diazonamide DZ-2384 has distinct effects on microtubule curvature and dynamics without neurotoxicity. Sci. Transl. Med. 8, 365ra159 (2016). · DOI
  11. Tunquist, B. J., Woessner, R. D. & Walker, D. H. Mcl-1 stability determines mitotic cell fate of human multiple myeloma tumor cells treated with the kinesin spindle protein inhibitor ARRY-520. Mol. Cancer Ther. 9, 2046–2056 (2010). · DOI
  12. Sloss, O., Topham, C., Diez, M. & Taylor, S. Mcl-1 dynamics influence mitotic slippage and death in mitosis. Oncotarget 7, 5176–5192 (2016). · DOI
  13. Wertz, I. E. et al. Sensitivity to antitubulin chemotherapeutics is regulated by MCL1 and FBW7. Nature 471, 110–114 (2011). · DOI
  14. Ham, J. et al. Exploitation of the apoptosis-primed state of MYCN-amplified neuroblastoma to develop a potent and specific targeted therapy combination. Cancer Cell 29, 159–172 (2016). · DOI
  15. Miller, A. V. et al. Paclitaxel-induced apoptosis is BAK-dependent, but BAX and BIM-independent in breast tumor. PLoS ONE 8, e60685 (2013). · DOI
  16. Colin, D. J., Hain, K. O., Allan, L. A. & Clarke, P. R. Cellular responses to a prolonged delay in mitosis are determined by a DNA damage response controlled by Bcl-2 family proteins. Open Biol. 5, 140156 (2015). · DOI
  17. Rieder, C. L. & Maiato, H. Stuck in division or passing through: what happens when cells cannot satisfy the spindle assembly checkpoint. Dev. Cell 7, 637–651 (2004). · DOI
  18. Weaver, B. A. & Cleveland, D. W. Decoding the links between mitosis, cancer, and chemotherapy: The mitotic checkpoint, adaptation, and cell death. Cancer Cell 8, 7–12 (2005). · DOI
  19. Li, Y. & Benezra, R. Identification of a human mitotic checkpoint gene: hsMAD2. Science 274, 246–248 (1996). · DOI
  20. Jiang, X. & Wang, X. Cytochrome C-mediated apoptosis. Annu Rev. Biochem 73, 87–106 (2004). · DOI
  21. Thornberry, N. A. & Lazebnik, Y. Caspases: enemies within. Science 281, 1312–1316 (1998). · DOI
  22. Petersen, S. L. et al. Autocrine TNFalpha signaling renders human cancer cells susceptible to Smac-mimetic-induced apoptosis. Cancer Cell 12, 445–456 (2007). · DOI
  23. Wang, G. et al. Small-molecule activation of the TRAIL receptor DR5 in human cancer cells. Nat. Chem. Biol. 9, 84–89 (2013). · DOI
  24. Green, D. R. Apoptotic pathways: ten minutes to dead. Cell 121, 671–674 (2005). · DOI
  25. Ashkenazi, A. & Dixit, V. M. Death receptors: signaling and modulation. Science 281, 1305–1308 (1998). · DOI · Paper page
  26. Sakurikar, N., Eichhorn, J. M., Alford, S. E. & Chambers, T. C. Identification of a mitotic death signature in cancer cell lines. Cancer Lett. 343, 232–238 (2014). · DOI
  27. Terrano, D. T., Upreti, M. & Chambers, T. C. Cyclin-dependent kinase 1-mediated Bcl-xL/Bcl-2 phosphorylation acts as a functional link coupling mitotic arrest and apoptosis. Mol. Cell Biol. 30, 640–656 (2010). · DOI
  28. Chinnaiyan, A. M. et al. Signal transduction by DR3, a death domain-containing receptor related to TNFR-1 and CD95. Science 274, 990–992 (1996). · DOI
  29. Screaton, G. R. et al. LARD: a new lymphoid-specific death domain containing receptor regulated by alternative pre-mRNA splicing. Proc. Natl Acad. Sci. USA 94, 4615–4619 (1997). · DOI
  30. Nakayama, M. et al. Multiple pathways of TWEAK-induced cell death. J. Immunol. 168, 734–743 (2002). · DOI
  31. Tao, W. et al. Induction of apoptosis by an inhibitor of the mitotic kinesin KSP requires both activation of the spindle assembly checkpoint and mitotic slippage. Cancer Cell 8, 49–59 (2005). · DOI
  32. Migone, T. S. et al. TL1A is a TNF-like ligand for DR3 and TR6/DcR3 and functions as a T cell costimulator. Immunity 16, 479–492 (2002). · DOI
  33. Meylan, F. et al. The TNF-family receptor DR3 is essential for diverse T cell-mediated inflammatory diseases. Immunity 29, 79–89 (2008). · DOI
  34. Marsters, S. A. et al. Identification of a ligand for the death-domain-containing receptor Apo3. Curr. Biol. 8, 525–528 (1998). · DOI
  35. Kaptein, A. et al. Studies on the interaction between TWEAK and the death receptor WSL-1/TRAMP (DR3). FEBS Lett. 485, 135–141 (2000). · DOI
  36. Wiley, S. R. et al. A novel TNF receptor family member binds TWEAK and is implicated in angiogenesis. Immunity 15, 837–846 (2001). · DOI
  37. Chin, L., Andersen, J. N. & Futreal, P. A. Cancer genomics: from discovery science to personalized medicine. Nat. Med 17, 297–303 (2011). · DOI
  38. Neale, G. et al. Molecular characterization of the pediatric preclinical testing panel. Clin. Cancer Res 14, 4572–4583 (2008). · DOI
  39. Schaefer, K. L. et al. Microarray analysis of Ewing’s sarcoma family of tumours reveals characteristic gene expression signatures associated with metastasis and resistance to chemotherapy. Eur. J. Cancer 44, 699–709 (2008). · DOI
  40. Inuzuka, H. et al. SCF(FBW7) regulates cellular apoptosis by targeting MCL1 for ubiquitylation and destruction. Nature 471, 104–109 (2011). · DOI
  41. Kueh, H. Y., Zhu, Y. & Shi, J. A simplified Bcl-2 network model reveals quantitative determinants of cell-to-cell variation in sensitivity to anti-mitotic chemotherapeutics. Sci. Rep. 6, 36585 (2016). · DOI
  42. Ashkenazi, A. & Dixit, V. M. Apoptosis control by death and decoy receptors. Curr. Opin. Cell Biol. 11, 255–260 (1999). · DOI
  43. Gascoigne, K. E. & Taylor, S. S. Cancer cells display profound intra- and interline variation following prolonged exposure to antimitotic drugs. Cancer Cell 14, 111–122 (2008). · DOI · Paper page

Cited by

Sorted by citations

See all 41

Metadata

Authors
Qi, C., Wang, X., Shen, Z., Chen, S., Yu, H., Williams, N., & Wang, G.
Venue
Cell Research
Published
2018-03-01
Volume
28
Issue
5
Pages
544-555
ISSN
  • 1001-0602
  • 1748-7838
Cited by
41
References
4
Language
en

About these checks

Registry, retraction, Cites and statistics results are computed, not judged, with one exception: a printed reference that no index lists is read once by a model before it counts as a citation error. Claims are extracted by a model and kept only when their quote appears verbatim in the text; each cited source is then checked, with a model’s help, for whether it says what the claim relies on. Those verdicts can be wrong — read the claim’s quote and the cited source before relying on one.

Statistics and arithmetic are recomputed, not judged.

Confidence bands are shown only for fields calibrated on our annotated test set. None is calibrated yet, so no band is shown.

What counts as a claim ›How we measure confidence ›How we check this ›

Are you an author, or do you see a problem with this page? Request a review