

The DOI matches its Crossref record; 76 of the 76 references it cites were found in a registry or an index.
Gaining comprehensive biological insight into the transcriptome by performing a broad-spectrum RNA-seq analysis
Open accessAbstract
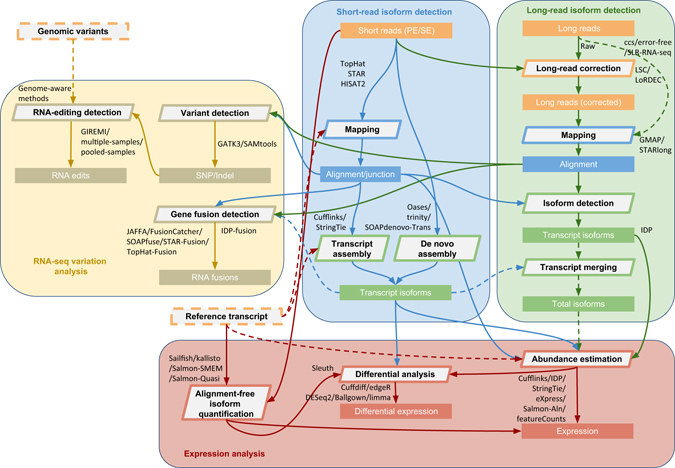
RNA-sequencing (RNA-seq) is an essential technique for transcriptome studies, hundreds of analysis tools have been developed since it was debuted. Although recent efforts have attempted to assess the latest available tools, they have not evaluated the analysis workflows comprehensively to unleash the power within RNA-seq. Here we conduct an extensive study analysing a broad spectrum of RNA-seq workflows. Surpassing the expression analysis scope, our work also includes assessment of RNA variant-calling, RNA editing and RNA fusion detection techniques. Specifically, we examine both short- and long-read RNA-seq technologies, 39 analysis tools resulting in ~120 combinations, and ~490 analyses involving 15 samples with a variety of germline, cancer and stem cell data sets. We report the performance and propose a comprehensive RNA-seq analysis protocol, named RNACocktail, along with a computational pipeline achieving high accuracy. Validation on different samples reveals that our proposed protocol could help researchers extract more biologically relevant predictions by broad analysis of the transcriptome.
Overview
The claims and statistics of this paper haven’t been checked yet.
Run the check — free, no account needed. It reads the open-access text and checks the sources it cites.
Integrity signals
Registry
Cites
Statistics
Figures
Verification
Claims the paper makes
The claims and statistics of this paper haven’t been checked yet.
Run the check — free, no account needed. It reads the open-access text and checks the sources it cites.
Claims other papers make about this one
Each is checked against this paper’s own text: does it say what the citing paper says it does?
The source backs part of the claim, not all of it — or backs it for a different population, condition or comparison.
In the citing paper
“This has been noted by others in the past, and GATK recommendations for variant calling on bulk RNAseq involve removing these regions of the alignments prior to variant calling23.”
From Souporcell: robust clustering of single-cell RNA-seq data by genotype without reference genotypes (2020) · cites this paper as [23]
Experimental — accuracy not yet measured
Self-check
Percentages, sums and reported differences re-computed from the paper’s own numbers.
The self-check needs the paper’s full text.
Citations
Cites
Moderated estimation of fold change and dispersion for RNA-seq data with DESeq2
Love, M. I., Huber, W., & Anders, S. (2014) · Genome Biology · doi:10.1186/s13059-014-0550-8 · Cited by 95,106
Trimmomatic: a flexible trimmer for Illumina sequence data
Bolger, A. M., Lohse, M., & Usadel, B. (2014) · Bioinformatics · doi:10.1093/bioinformatics/btu170 · Cited by 65,548
The Sequence Alignment/Map format and SAMtools
Li, H., Handsaker, B., Wysoker, A., Fennell, T., Ruan, J., Homer, N., Marth, G., Abecasis, G., Durbin, R., & 1000 Genome Project Data Processing Subgroup (2009) · Bioinformatics · doi:10.1093/bioinformatics/btp352 · Cited by 62,041
STAR: ultrafast universal RNA-seq aligner
Dobin, A., Davis, C. A., Schlesinger, F., Drenkow, J., Zaleski, C., Jha, S., Batut, P., Chaisson, M., & Gingeras, T. R. (2013) · Bioinformatics · doi:10.1093/bioinformatics/bts635 · Cited by 51,709
Robinson, M. D., McCarthy, D. J., & Smyth, G. K. (2010) · Bioinformatics · doi:10.1093/bioinformatics/btp616 · Cited by 41,364
limma powers differential expression analyses for RNA-sequencing and microarray studies
Ritchie, M. E., Phipson, B., Wu, D., Hu, Y., Law, C. W., Shi, W., & Smyth, G. K. (2015) · Nucleic Acids Research · doi:10.1093/nar/gkv007 · Cited by 40,458
featureCounts: an efficient general purpose program for assigning sequence reads to genomic features
Liao, Y., Smyth, G. K., & Shi, W. (2014) · Bioinformatics · doi:10.1093/bioinformatics/btt656 · Cited by 27,219
HISAT: a fast spliced aligner with low memory requirements
Kim, D., Langmead, B., & Salzberg, S. L. (2015) · Nature Methods · doi:10.1038/nmeth.3317 · Cited by 24,112
RSEM: accurate transcript quantification from RNA-Seq data with or without a reference genome
Li, B., & Dewey, C. N. (2011) · BMC Bioinformatics · doi:10.1186/1471-2105-12-323 · Cited by 22,179
Full-length transcriptome assembly from RNA-Seq data without a reference genome
Grabherr, M. G., Haas, B. J., Yassour, M., Levin, J. Z., Thompson, D. A., Amit, I., Adiconis, X., Fan, L., Raychowdhury, R., Zeng, Q., et al. (2011) · Nature Biotechnology · doi:10.1038/nbt.1883 · Cited by 21,201
Cited by
Sorted by citations
Items 301–386 of 386
Does periphyton turn less palatable under grazing pressure?
Zhu, F., Tan, X., Wang, X., & Zhang, Q. (2024) · ISME Communications · doi:10.1093/ismeco/ycae146
He, D., Liu, J., Xu, W., Hu, Y., Chen, W., Fan, Z., & Wang, Z. (2025) · Journal of Asia-Pacific Entomology · doi:10.1016/j.aspen.2025.102391
Siminea, N., Anand, P., Păun, A., Chiosis, G., Freeman, A., & Petre, I. (2025) · Elsevier eBooks · doi:10.1016/b978-0-443-29808-0.00021-2
Ruan, X., Yang, F., Li, M., Dong, Q., Hao, W., Zhang, W., Yun, X., Li, D., Zhao, J., Qin, X., et al. (2025) · Thyroid · doi:10.1089/thy.2024.0611
Wang, W., Guo, Y., Zhao, G., Jia, W., Wang, Y., Zhang, Y., Mu, J., Wang, Z., He, S., & Jing, S. (2025) · Scientia Horticulturae · doi:10.1016/j.scienta.2025.114219
Identification of Rare Variants in Schizophrenia-relevant Pathways: A Computational Analysis
Slay, O. K. (2024) · Sheffield Hallam University · doi:10.7190/shu-thesis-00693
NGP: A Tool to Detect Noncoding RNA-Gene Regulatory Pairs from Transcriptomic Data
Ke, H., & Ma, T. (2025) · Methods in molecular biology · doi:10.1007/978-1-0716-4566-6_12
Genetic Signatures of Competitive Performance in Burmese Gamecocks: A Transcriptomic Analysis
Piratae, S., Yamtubtim, C., Nonsri, T., Poomprasert, P., & Purisotayo, T. (2025) · Biology · doi:10.3390/biology14081066
Hussein, S. H., Mahmoudi-Aznaveh, A., Nekoeian, S., Qurbani, K., Panji, M., Zakeri, P., Bandarian, F., Motevaseli, E., & Azizi, Z. (2025) · Molecular Biology Reports · doi:10.1007/s11033-025-11056-3
Yu, C., Xiaomao, T., Luo, J., Wan, Y., Hong, Y., Liu, Z., Zhang, J., Pei, J., He, X., Wen, S., et al. (2025) · PLoS ONE · doi:10.1371/journal.pone.0331020 · Cited by 1
Wen, S., Meng, L., Yang, J., Zhang, A., Ma, Z., Zhao, B., Wang, Y., Jia, X. T., Li, Y., Wang, X., et al. (2025) · Plant Disease · doi:10.1094/pdis-05-25-1016-re
Qu, S., Zhang, M., Hu, S., Song, G., Li, H., Teng, W., Li, Y., Zhao, X., & Han, Y. (2025) · Agronomy · doi:10.3390/agronomy15122752
Tseng, Y.-T., Chang, C.-T., HuangFu, W., & Liu, I.-H. (2025) · Frontiers in Cell and Developmental Biology · doi:10.3389/fcell.2025.1719544
Additional file 3 of ROGUE: an R Shiny app for RNA sequencing analysis and biomarker discovery
Farrel, A., Li, P., Veenbergen, S., Patel, K., Maris, J. M., & Leonard, W. J. (2023) · Figshare · doi:10.6084/m9.figshare.23804910
Additional file 11 of Annotation depth confounds direct comparison of gene expression across species
Oziolor, E. M., Arat, S., & Martin, M. (2021) · Figshare · doi:10.6084/m9.figshare.16821487
Duan, G., Liu, W., Han, H., Li, D., Lei, Q., Zhou, Y., Liu, J., Wang, J., Du, Y., 曹顶国, et al. (2024) · Figshare · doi:10.6084/m9.figshare.26649495
Lu, K., Zhao, Y., Li, Y., Fu, Z., Chen, Y., Kong, Y., & Li, G. (2024) · Figshare · doi:10.6084/m9.figshare.26729398
Chang, O.-C., & Lin, W.-Y. (2023) · Figshare · doi:10.6084/m9.figshare.23535979
Duan, G., Liu, W., Han, H., Li, D., Lei, Q., Zhou, Y., Liu, J., Wang, J., Du, Y., 曹顶国, et al. (2024) · Figshare · doi:10.6084/m9.figshare.26649489
Lu, K., Zhao, Y., Li, Y., Fu, Z., Chen, Y., Kong, Y., & Li, G. (2024) · Figshare · doi:10.6084/m9.figshare.26729395
Lei, J., Pan, Y., Gao, R., He, B., Wang, Z., Lei, X., Zhang, Z., Yang, N., & Yan, M. (2023) · Figshare · doi:10.6084/m9.figshare.23983350
Lu, K., Zhao, Y., Li, Y., Fu, Z., Chen, Y., Kong, Y., & Li, G. (2024) · Figshare · doi:10.6084/m9.figshare.26729383
Additional file 7 of A comparison of transcriptome analysis methods with reference genome
Liu, X., Zhao, J., Xue, L., Zhao, T., Ding, W., Han, Y., & Ye, H. (2022) · Figshare · doi:10.6084/m9.figshare.19424931
Duan, G., Liu, W., Han, H., Li, D., Lei, Q., Zhou, Y., Liu, J., Wang, J., Du, Y., Cao, D., et al. (2024) · Figshare · doi:10.6084/m9.figshare.26649486
Additional file 3 of Impact of human gene annotations on RNA-seq differential expression analysis
Hamaguchi, Y., Zeng, C., & Hamada, M. (2021) · Figshare · doi:10.6084/m9.figshare.16778414
Additional file 9 of Annotation depth confounds direct comparison of gene expression across species
Oziolor, E. M., Arat, S., & Martin, M. (2021) · Figshare · doi:10.6084/m9.figshare.16821529
Additional file 4 of Annotation depth confounds direct comparison of gene expression across species
Oziolor, E. M., Arat, S., & Martin, M. (2021) · Figshare · doi:10.6084/m9.figshare.16821514
Additional file 5 of A comparison of transcriptome analysis methods with reference genome
Liu, X., Zhao, J., Xue, L., Zhao, T., Ding, W., Han, Y., & Ye, H. (2022) · Figshare · doi:10.6084/m9.figshare.19424925
Additional file 5 of Annotation depth confounds direct comparison of gene expression across species
Oziolor, E. M., Arat, S., & Martin, M. (2021) · Figshare · doi:10.6084/m9.figshare.16821517
Additional file 14 of Annotation depth confounds direct comparison of gene expression across species
Oziolor, E. M., Arat, S., & Martin, M. (2021) · Figshare · doi:10.6084/m9.figshare.16821496
Lu, K., Zhao, Y., Li, Y., Fu, Z., Chen, Y., Kong, Y., & Li, G. (2024) · Figshare · doi:10.6084/m9.figshare.26729386
Additional file 6 of A comparison of transcriptome analysis methods with reference genome
Liu, X., Zhao, J., Xue, L., Zhao, T., Ding, W., Han, Y., & Ye, H. (2022) · Figshare · doi:10.6084/m9.figshare.19424928
Additional file 1 of Impact of human gene annotations on RNA-seq differential expression analysis
Hamaguchi, Y., Zeng, C., & Hamada, M. (2021) · Figshare · doi:10.6084/m9.figshare.16778408
Additional file 2 of Annotation depth confounds direct comparison of gene expression across species
Oziolor, E. M., Arat, S., & Martin, M. (2021) · Figshare · doi:10.6084/m9.figshare.16821508
Lu, K., Zhao, Y., Li, Y., Fu, Z., Chen, Y., Kong, Y., & Li, G. (2024) · Figshare · doi:10.6084/m9.figshare.26729401
Wang, V., Tseng, K.-Y., Kuo, T.-T., Huang, E. Y., Lan, K.-L., Chen, Z.-R., Ma, K.-H., Greig, N. H., Jung, J. H., Choi, H.-I., et al. (2024) · Figshare · doi:10.6084/m9.figshare.26707895
Duan, G., Liu, W., Han, H., Li, D., Lei, Q., Zhou, Y., Liu, J., Wang, J., Du, Y., 曹顶国, et al. (2024) · Figshare · doi:10.6084/m9.figshare.26649483
Additional file 3 of A comparison of transcriptome analysis methods with reference genome
Liu, X., Zhao, J., Xue, L., Zhao, T., Ding, W., Han, Y., & Ye, H. (2022) · Figshare · doi:10.6084/m9.figshare.19424916
Additional file 4 of A comparison of transcriptome analysis methods with reference genome
Liu, X., Zhao, J., Xue, L., Zhao, T., Ding, W., Han, Y., & Ye, H. (2022) · Figshare · doi:10.6084/m9.figshare.19424922
Additional file 7 of Annotation depth confounds direct comparison of gene expression across species
Oziolor, E. M., Arat, S., & Martin, M. (2021) · Figshare · doi:10.6084/m9.figshare.16821523
Additional file 13 of Annotation depth confounds direct comparison of gene expression across species
Oziolor, E. M., Arat, S., & Martin, M. (2021) · Figshare · doi:10.6084/m9.figshare.16821493
Additional file 3 of Annotation depth confounds direct comparison of gene expression across species
Oziolor, E. M., Arat, S., & Martin, M. (2021) · Figshare · doi:10.6084/m9.figshare.16821511
Additional file 4 of ROGUE: an R Shiny app for RNA sequencing analysis and biomarker discovery
Farrel, A., Li, P., Veenbergen, S., Patel, K., Maris, J. M., & Leonard, W. J. (2023) · Figshare · doi:10.6084/m9.figshare.23804913
Lu, K., Zhao, Y., Li, Y., Fu, Z., Chen, Y., Kong, Y., & Li, G. (2024) · Figshare · doi:10.6084/m9.figshare.26729389
Duan, G., Liu, W., Han, H., Li, D., Lei, Q., Zhou, Y., Liu, J., Wang, J., Du, Y., 曹顶国, et al. (2024) · Figshare · doi:10.6084/m9.figshare.26649492
Chou, Y.-J., & Ting, Y. (2024) · Figshare · doi:10.6084/m9.figshare.26653407
Additional file 1 of Annotation depth confounds direct comparison of gene expression across species
Oziolor, E. M., Arat, S., & Martin, M. (2021) · Figshare · doi:10.6084/m9.figshare.16821505
Weng, H.-P., Ke, C.-H., Tung, C.-W., Tani, A., Wang, C.-C., Yang, W.-Y., Wang, Y.-S., Han, W., Liao, C.-H., Tomiyasu, H., et al. (2024) · Figshare · doi:10.6084/m9.figshare.26632582
Additional file 12 of Annotation depth confounds direct comparison of gene expression across species
Oziolor, E. M., Arat, S., & Martin, M. (2021) · Figshare · doi:10.6084/m9.figshare.16821490
Additional file 2 of A comparison of transcriptome analysis methods with reference genome
Liu, X., Zhao, J., Xue, L., Zhao, T., Ding, W., Han, Y., & Ye, H. (2022) · Figshare · doi:10.6084/m9.figshare.19424913
Lu, K., Zhao, Y., Li, Y., Fu, Z., Chen, Y., Kong, Y., & Li, G. (2024) · Figshare · doi:10.6084/m9.figshare.26729392
Additional file 6 of ROGUE: an R Shiny app for RNA sequencing analysis and biomarker discovery
Farrel, A., Li, P., Veenbergen, S., Patel, K., Maris, J. M., & Leonard, W. J. (2023) · Figshare · doi:10.6084/m9.figshare.23804919
Additional file 6 of Annotation depth confounds direct comparison of gene expression across species
Oziolor, E. M., Arat, S., & Martin, M. (2021) · Figshare · doi:10.6084/m9.figshare.16821520
Additional file 8 of Annotation depth confounds direct comparison of gene expression across species
Oziolor, E. M., Arat, S., & Martin, M. (2021) · Figshare · doi:10.6084/m9.figshare.16821526
Additional file 2 of ROGUE: an R Shiny app for RNA sequencing analysis and biomarker discovery
Farrel, A., Li, P., Veenbergen, S., Patel, K., Maris, J. M., & Leonard, W. J. (2023) · Figshare · doi:10.6084/m9.figshare.23804907
Lei, J., Pan, Y., Gao, R., He, B., Wang, Z., Lei, X., Zhang, Z., Yang, N., & Yan, M. (2023) · Figshare · doi:10.6084/m9.figshare.23983353
Additional file 1 of A comparison of transcriptome analysis methods with reference genome
Liu, X., Zhao, J., Xue, L., Zhao, T., Ding, W., Han, Y., & Ye, H. (2022) · Figshare · doi:10.6084/m9.figshare.19424910
Additional file 1 of ROGUE: an R Shiny app for RNA sequencing analysis and biomarker discovery
Farrel, A., Li, P., Veenbergen, S., Patel, K., Maris, J. M., & Leonard, W. J. (2023) · Figshare · doi:10.6084/m9.figshare.23804904
Additional file 10 of Annotation depth confounds direct comparison of gene expression across species
Oziolor, E. M., Arat, S., & Martin, M. (2021) · Figshare · doi:10.6084/m9.figshare.16821484
Lu, K., Zhao, Y., Li, Y., Fu, Z., Chen, Y., Kong, Y., & Li, G. (2024) · Figshare · doi:10.6084/m9.figshare.26729404
Vandenabeele, L., Gibert, A., Salvado, P., Buscail, R., Llauro, C., Laudié, M., Philippe, H., & Bertrand, J. A. M. (2026) · Genome Biology and Evolution · doi:10.1093/gbe/evag202
resolveS: rapid inference of RNA-seq library strandedness using universal rRNA alignmentsPreprint
Long, X., Zhao, T., & Yu, D. (2026) · bioRxiv (Cold Spring Harbor Laboratory) · doi:10.64898/2026.01.08.698333
Zhang, Y., Liu, N., Yang, H., Wang, F., Guo, J., Wang, H., Tang, Y., Shao, R., Wang, Y., & Yang, Q. (2026) · Plant Physiology and Biochemistry · doi:10.1016/j.plaphy.2026.111068
Song, G., Zhu, T., Zhen, L., Chang, L., Solomon, A., Jie, W., Wang, S., Song, B., Dong, X., & Ren, Z. (2026) · BMC Genomics · doi:10.1186/s12864-026-12587-0
Ma, Y., Guo, X., Wu, Z., Wu, Q.-L., Li, J., Mao, T.-L., Li, Z., Shang, Y., Thakur, K., & Wei, Z. (2026) · eFood · doi:10.1002/efd2.70131
PGST: A Prototype-Guided Parameter-Efficient Network for Spatial Transcriptomics Prediction
He, Y., Hu, K., Sun, C., Wei, L., & Su, R. (2026) · IEEE Journal of Biomedical and Health Informatics · doi:10.1109/jbhi.2026.3666148
Development of autotrophy in Escherichia coli through adaptive laboratory evolutionPreprint
Huang, S., Peng, J.-H., Lo, S.-C., Liu, C.-H., Lin, Y., Chiang, E. I., & Huang, C. W. (2026) · bioRxiv (Cold Spring Harbor Laboratory) · doi:10.64898/2026.02.23.707615
A 3D Renal Microsphere Model Reveals Antagonism in Ochratoxin a and Citrinin Co-Exposure
Wu, D., Ning, X., Ye, Y., Ji, J., Sun, J., Wang, J.-S., Wang, G., & Sun, X. (2026) · Journal of Agricultural and Food Chemistry · doi:10.1021/acs.jafc.6c00721
Lai, Z., Lee, C., Chiu, Y.-C., Lin, C.-H., Yang, C., Ho, C.-C., Liu, L. Y., & Chuang, Y. (2026) · Cardiovascular Toxicology · doi:10.1007/s12012-026-10113-y
Carbon allocation strategy of Thalassiosira weissflogii in response to elevated pCO2
Cheng, M., Liu, C., Li, D., Wang, J., Duan, D., & Shao, Z. (2026) · BMC Plant Biology · doi:10.1186/s12870-026-08495-w
Gong, Y., Guo, H., Ding, H., Hu, X., Ding, Z., Ma, M., & Chen, J. (2026) · PLoS ONE · doi:10.1371/journal.pone.0349749
Genomic and transcriptomic insights into color pigmentation variation in barred chickens
Chen, T., Ren, X., Zuo, D., Zhao, X., Chen, A., Li, F., Zhang, X., Jiang, X., Yu, H., & Qu, L. (2026) · Poultry Science · doi:10.1016/j.psj.2026.107245
Saleem, K., Paracha, R. Z., Khalid, L., Manzoor, A., Nisar, M., Murad, D., Din, N. M., & Amir, A. (2026) · Journal of Computer-Aided Molecular Design · doi:10.1007/s10822-026-00837-y
Zhu, J., LIU, J., Hou, P., Ma, W., Amuti, S., Liu, W., Zeng, J., & Yiming, A. (2026) · Sexual Medicine · doi:10.1093/sexmed/qfag055
Yang, W., Li, Y., Wang, X. T., Tang, Y., Tao, Z., Li, P., Du, S., Mu, Z., Lu, X., & Zhao, X. Y. (2026) · Chinese Medicine · doi:10.1186/s13020-026-01459-0
Li, S., Zhang, J., Hu, X., & Chen, Q. (2026) · Journal of Agronomy and Crop Science · doi:10.1111/jac.70226
Zhang, J., Gao, M., Cai, R., Jiang, X., Zhang, B., Li, Z., Yang, N., & Sun, C. (2026) · iMetaOmics. · doi:10.1002/imo2.70128
Hsu, S., Chua, H., Liou, B., Cheng, Y., Lin, C.-R., Chen, Y., Yang, T., Wu, S., Tsuei, D., Chen, H., et al. (2026) · The Journal of Pathology · doi:10.1002/path.70101
Sun, Y., Li, T., Wang, Y., Fan, M., Huang, Z., Ren, Y., Wang, K., Qian, H., Li, Y., & Wang, L. (2026) · Food Research International · doi:10.1016/j.foodres.2026.120244
Yu, D., Long, X., & Zhao, T. (2026) · Genomics Communications · doi:10.48130/gcomm-0026-0020
Tian, R., Lv, Y., Chen, Y., Wang, Z., Wang, A., Gu, B., & Jiang, H. (2026) · Biology · doi:10.3390/biology15201828
Meng, L., Yonezawa, R., Qiu, L., Bailey‐Kobayashi, N., Hashimoto, N., Maeyama, K., Yoshida, T., Nagai, K., Watabe, S., Kinoshita, S., et al. (2026) · Aquaculture Reports · doi:10.1016/j.aqrep.2026.103888
Yang, J., Xu, C., Shi, C., Li, J., Xu, D., Wang, X., Zihui, A., Cong, D., Liu, X., Zhang, X., et al. (2026) · Journal of Biological Chemistry · doi:10.1016/j.jbc.2026.113683
Pei, Y., Wan, H., He, X., Liu, Y., Qian, F., Tian, S., Wang, J., Liu, C., Chen, Q., Xin, D., et al. (2026) · Journal of Agricultural and Food Chemistry · doi:10.1021/acs.jafc.6c06644
Metadata
- Authors
- Sahraeian, S. M. E., Mohiyuddin, M., Sebra, R., Tilgner, H., Afshar, P. T., Au, K. F., Bani Asadi, N., Gerstein, M. B., Wong, W. H., Snyder, M. P., Schadt, E., & Lam, H. Y. K.
- Affiliations
- Icahn School of Medicine at Mount Sinai (US)
- Stanford Medicine (US)
- Stanford University (US)
- University of Iowa (US)
- Yale University (US)
- Corresponding author
- Lam, Hugo Y. K.
- ORCID
- Venue
- Nature Communications
- Published
- 2017-07-05
- Volume
- 8
- Issue
- 1
- Pages
- 59-59
- ISSN
- 2041-1723 (ISSN-L)
- PMC
- PMC5498581
- OpenAlex
- W2731748842
- Cited by
- 376
- References
- 76
- Citations by year
- 2026: 29 · 2025: 48 · 2024: 64 · 2023: 41 · 2022: 49 · 2021: 60 · 2020: 28 · 2019: 31 · 2018: 20 · 2017: 5
- FWCI
- 9.38
- Type
- journal article
- Language
- en
- Open access
- gold
- doi.org
- Locations
- Nature Communications (publishedVersion, cc-by)
- Europe PMC (PubMed Central) (publishedVersion, cc-by)
- PubMed Central (publishedVersion, cc-by)
- PubMed (publishedVersion)
- RePEc: Research Papers in Economics (submittedVersion)
- DOAJ (DOAJ: Directory of Open Access Journals) (submittedVersion, cc-by-sa)
- Funders
- National Institutes of Health
- Genentech
- National Human Genome Research Institute (R01HG008759, P50HG007735, R01HG007834)
- Topics
- Life Sciences › Biochemistry, Genetics and Molecular Biology › Molecular Biology › Genomics and Phylogenetic Studies
- Life Sciences › Biochemistry, Genetics and Molecular Biology › Molecular Biology › Single-cell and spatial transcriptomics
- Life Sciences › Biochemistry, Genetics and Molecular Biology › Molecular Biology › RNA Research and Splicing
- Keywords
- gene expression profiling, RNA editing, computational pipeline, tumor transcriptome
- MeSH terms
- Base Sequence, Cell Line, Humans, Embryonic Stem Cells, Transcriptome
About these checks
Registry, retraction, Cites and statistics results are computed, not judged, with one exception: a printed reference that no index lists is read once by a model before it counts as a citation error. Claims are extracted by a model and kept only when their quote appears verbatim in the text; each cited source is then checked, with a model’s help, for whether it says what the claim relies on. Those verdicts can be wrong — read the claim’s quote and the cited source before relying on one.
Statistics and arithmetic are recomputed, not judged.
Confidence bands are shown only for fields calibrated on our annotated test set. None is calibrated yet, so no band is shown.
What counts as a claim ›How we measure confidence ›How we check this ›
Are you an author, or do you see a problem with this page? Request a review
