

The DOI matches its Crossref record; 70 of the 70 references it cites were found in a registry or an index.
Survival of pancreatic cancer cells lacking KRAS function
Open accessAbstract
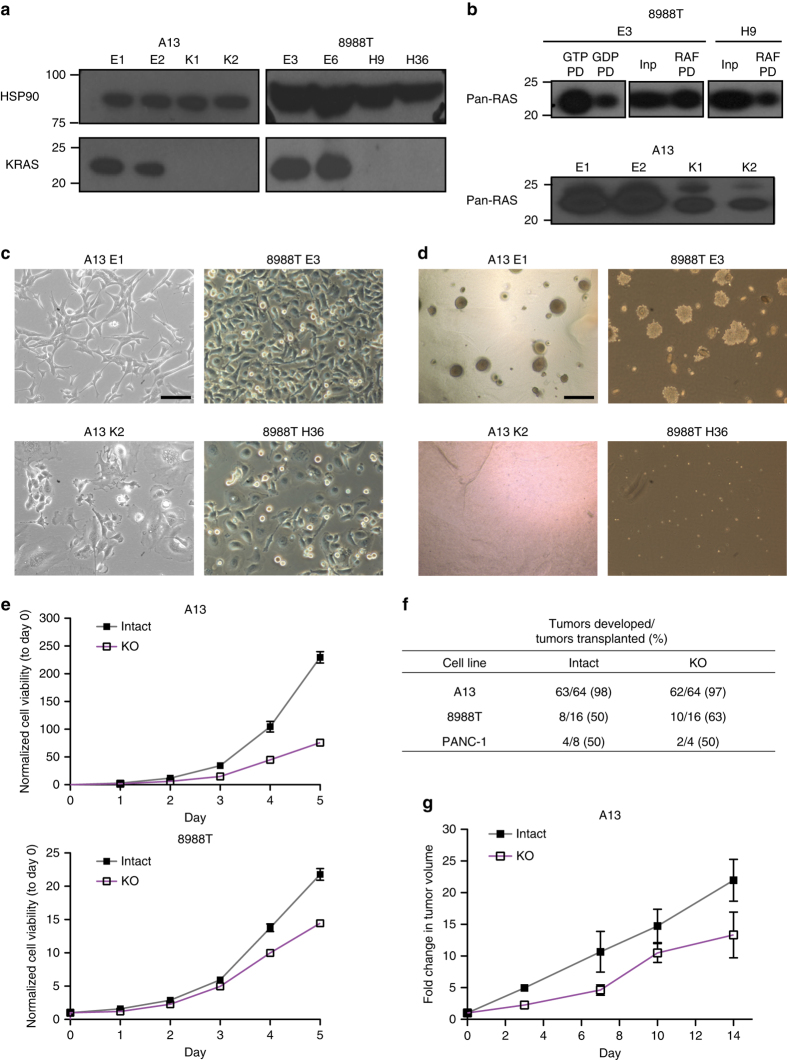
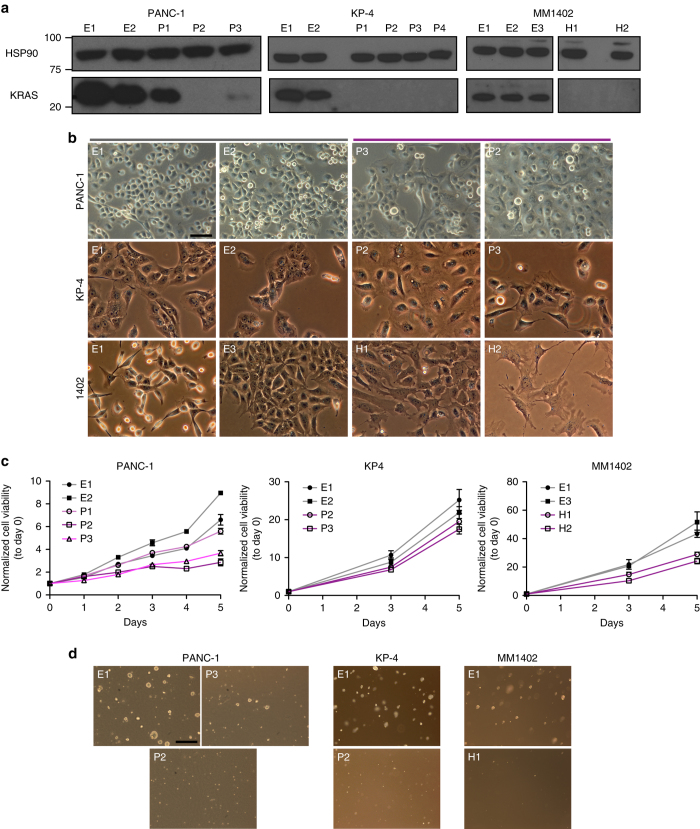
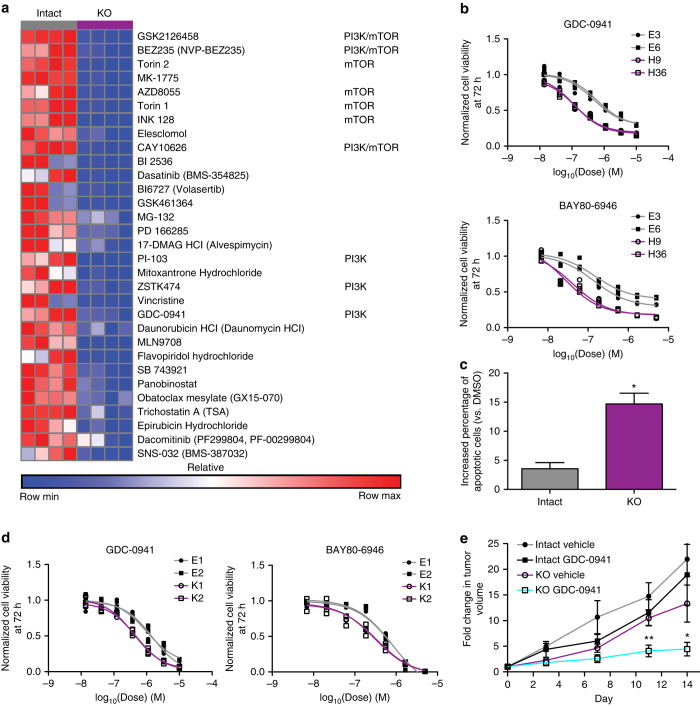
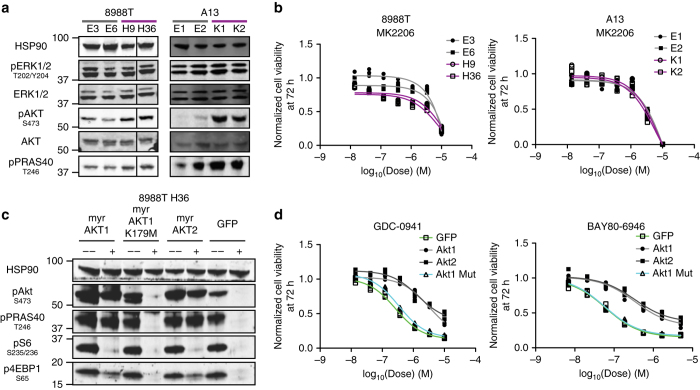
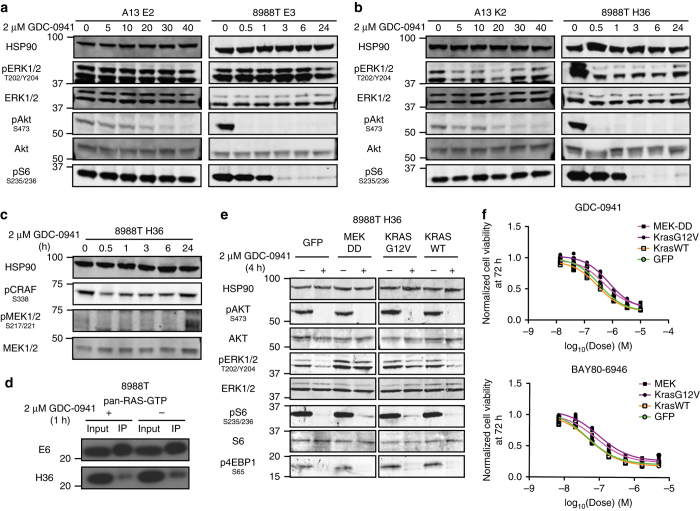
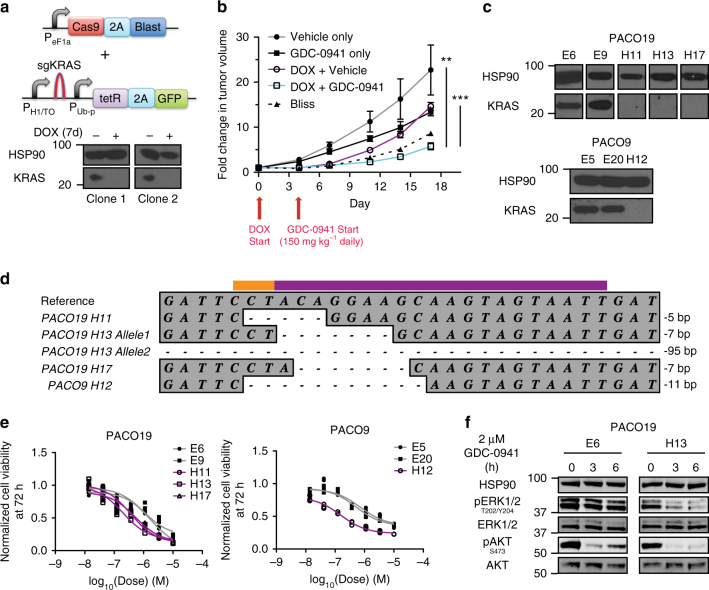
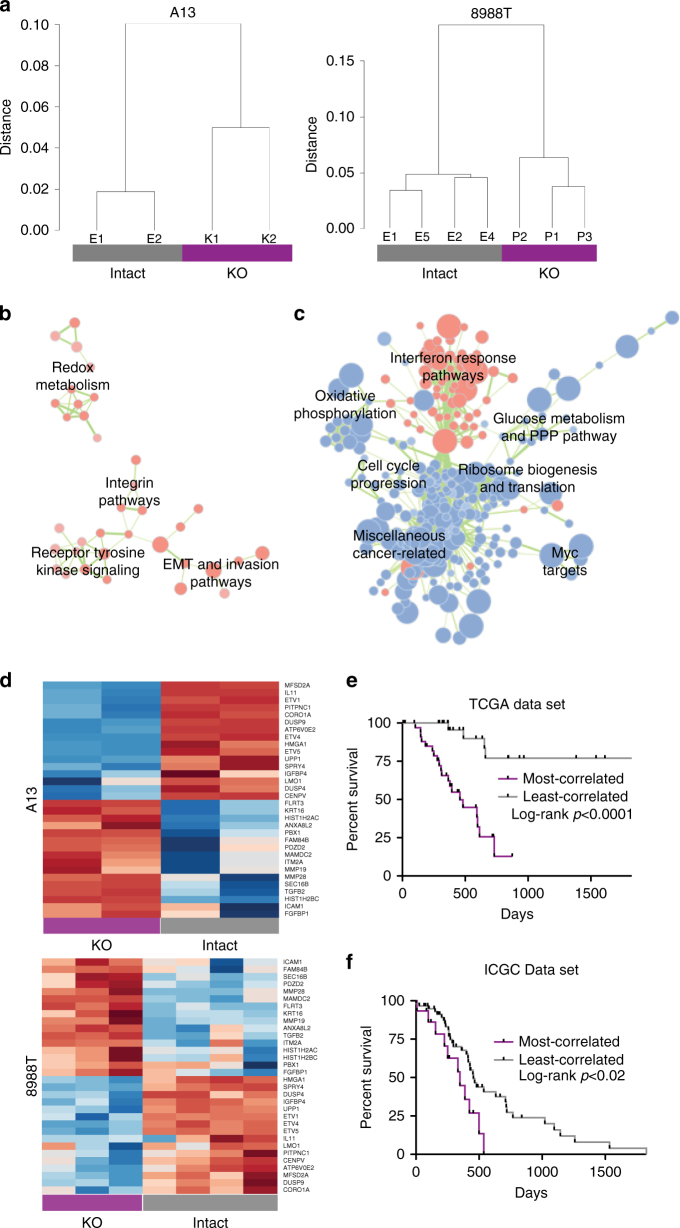
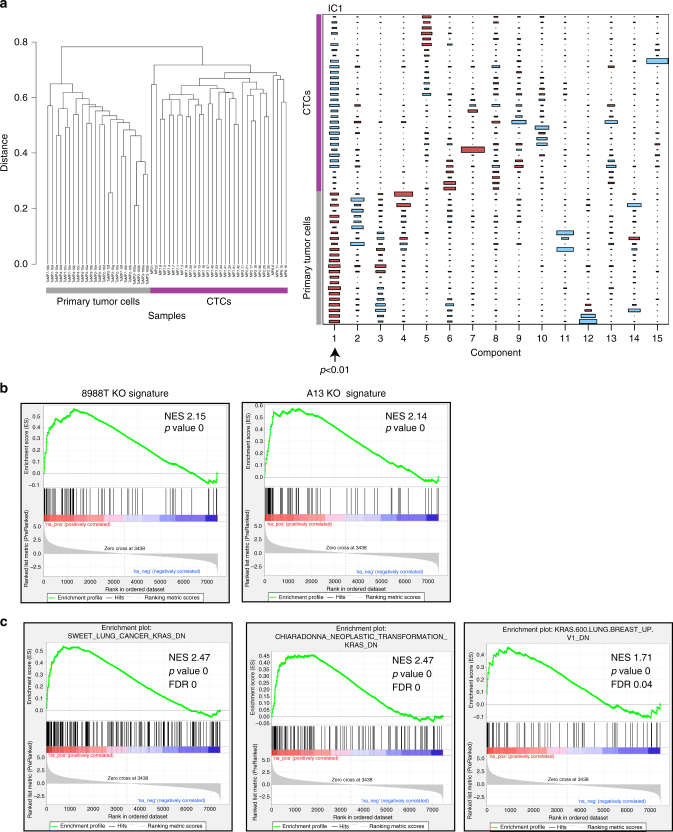
Activating mutations in the proto-oncogene KRAS are a hallmark of pancreatic ductal adenocarcinoma (PDAC), an aggressive malignancy with few effective therapeutic options. Despite efforts to develop KRAS-targeted drugs, the absolute dependence of PDAC cells on KRAS remains incompletely understood. Here we model complete KRAS inhibition using CRISPR/Cas-mediated genome editing and demonstrate that KRAS is dispensable in a subset of human and mouse PDAC cells. Remarkably, nearly all KRAS deficient cells exhibit phosphoinositide 3-kinase (PI3K)-dependent mitogen-activated protein kinase (MAPK) signaling and induced sensitivity to PI3K inhibitors. Furthermore, comparison of gene expression profiles of PDAC cells retaining or lacking KRAS reveal a role of KRAS in the suppression of metastasis-related genes. Collectively, these data underscore the potential for PDAC resistance to even the very best KRAS inhibitors and provide insights into mechanisms of response and resistance to KRAS inhibition.
Overview
The claims and statistics of this paper haven’t been checked yet.
Run the check — free, no account needed. It reads the open-access text and checks the sources it cites.
Integrity signals
Registry
Cites
Statistics
Figures
Verification
Claims the paper makes
The claims and statistics of this paper haven’t been checked yet.
Run the check — free, no account needed. It reads the open-access text and checks the sources it cites.
Claims other papers make about this one
Each is checked against this paper’s own text: does it say what the citing paper says it does?
The cited source says what the claim attributes to it.
In the citing paper
“Moreover, KRAS-independent survival was observed in some PDAC cells, with the PI3K pathway playing a compensatory role.”
From Significance of TP53, CDKN2A, SMAD4 and KRAS in Pancreatic Cancer (2024) · cites this paper as [92]
In the citing paper
“In some cases, even complete ablation of KRAS gene using CRISPR-Cas9 technology does not affect cell viability in KRAS mutant models.63”
From Overcoming Resistance to Drugs Targeting KRAS Mutation (2020) · cites this paper as [63]
In the citing paper
“Therefore, the redundancy of parallel growth signals could bypass the necessity of mutant K-Ras in promoting cell proliferation and underlies the inherent resistance to K-RasG12C-targeted therapies (Figure 3A–3C).12,63”
From Overcoming Resistance to Drugs Targeting KRAS Mutation (2020) · cites this paper as [63]
Self-check
Percentages, sums and reported differences re-computed from the paper’s own numbers.
The self-check needs the paper’s full text.
Citations
Cites
Subramanian, A., Tamayo, P., Mootha, V. K., Mukherjee, S., Ebert, B. L., Gillette, M. A., Paulovich, A., Pomeroy, S. L., Golub, T. R., Lander, E. S., et al. (2005) · Proceedings of the National Academy of Sciences · doi:10.1073/pnas.0506580102 · Cited by 53,625
Genome engineering using the CRISPR-Cas9 system
Ran, F. A., Hsu, P. D., Wright, J., Agarwala, V., Scott, D. A., & Zhang, F. (2013) · Nature Protocols · doi:10.1038/nprot.2013.143 · Cited by 11,133
Mootha, V. K., Lindgren, C. M., Eriksson, K.-F., Subramanian, A., Sihag, S., Lehar, J., Puigserver, P., Carlsson, E., Ridderstråle, M., Laurila, E., et al. (2003) · Nature Genetics · doi:10.1038/ng1180 · Cited by 10,197
Independent component analysis: algorithms and applications
Hyvärinen, A., & Erkki Oja, A. (2000) · Neural Networks · doi:10.1016/s0893-6080(00)00026-5 · Cited by 8,926
FOLFIRINOX versus Gemcitabine for Metastatic Pancreatic Cancer
Conroy, T., Desseigne, F., Ychou, M., Bouché, O., Guimbaud, R., Bécouarn, Y., Adenis, A., Raoul, J.-L., Gourgou-Bourgade, S., de la Fouchardière, C., et al. (2011) · New England Journal of Medicine · doi:10.1056/nejmoa1011923 · Cited by 7,810
Increased Survival in Pancreatic Cancer with nab-Paclitaxel plus Gemcitabine
Von Hoff, D. D., Ervin, T., Arena, F. P., Chiorean, E. G., Infante, J., Moore, M., Seay, T., Tjulandin, S. A., Ma, W. W., Saleh, M. N., et al. (2013) · New England Journal of Medicine · doi:10.1056/nejmoa1304369 · Cited by 6,712
Improved vectors and genome-wide libraries for CRISPR screening
Sanjana, N. E., Shalem, O., & Zhang, F. (2014) · Nature Methods · doi:10.1038/nmeth.3047 · Cited by 5,239
Core Signaling Pathways in Human Pancreatic Cancers Revealed by Global Genomic Analyses
Jones, S., Zhang, X., Parsons, D. W., Lin, J. C.-H., Leary, R. J., Angenendt, P., Mankoo, P., Carter, H., Kamiyama, H., Jimeno, A., et al. (2008) · Science · doi:10.1126/science.1164368 · Cited by 3,969
Genomic analyses identify molecular subtypes of pancreatic cancer
Bailey, P., Chang, D. K., Nones, K., Johns, A. L., Patch, A.-M., Gingras, M.-C., Miller, D. K., Christ, A. N., Bruxner, T. J. C., Quinn, M. C., et al. (2016) · Nature · doi:10.1038/nature16965 · Cited by 3,621
Whole genomes redefine the mutational landscape of pancreatic cancer
Initiative, A. P. C. G., Waddell, N., Pajic, M., Patch, A.-M., Chang, D. K., Kassahn, K. S., Bailey, P., Johns, A. L., Miller, D., Nones, K., et al. (2015) · Nature · doi:10.1038/nature14169 · Cited by 2,642
Cited by
Sorted by citations
KRAS Mutation: From Undruggable to Druggable in Cancer
Huang, L., Guo, Z., Wang, F., & Fu, L. (2021) · Signal Transduction and Targeted Therapy · doi:10.1038/s41392-021-00780-4 · Cited by 1,127
Tumor biomarkers for diagnosis, prognosis and targeted therapy
Zhou, Y., Tao, L., Qiu, J., Xu, J., Yang, X., Zhang, Y., Tian, X., Guan, X., Cen, X., & Zhao, Y. (2024) · Signal Transduction and Targeted Therapy · doi:10.1038/s41392-024-01823-2 · Cited by 836
Therapeutic strategies to target RAS-mutant cancers
Ryan, M. B., & Corcoran, R. B. (2018) · Nature Reviews Clinical Oncology · doi:10.1038/s41571-018-0105-0 · Cited by 420
The metabolic landscape of RAS-driven cancers from biology to therapy
Mukhopadhyay, S., Vander Heiden, M. G., & McCormick, F. (2021) · Nature Cancer · doi:10.1038/s43018-021-00184-x · Cited by 315
The Hippo pathway in cancer: YAP/TAZ and TEAD as therapeutic targets in cancer
Cunningham, R., & Hansen, C. G. (2022) · Clinical Science · doi:10.1042/cs20201474 · Cited by 355
KRAS G12C NSCLC Models Are Sensitive to Direct Targeting of KRAS in Combination with PI3K Inhibition
Misale, S., Fatherree, J. P., Cortez, E., Li, C., Bilton, S., Timonina, D., Myers, D. T., Lee, D., Gomez-Caraballo, M., Greenberg, M., et al. (2019) · Clinical Cancer Research · doi:10.1158/1078-0432.ccr-18-0368 · Cited by 259
Chehelgerdi, M., Chehelgerdi, M., Khorramian-Ghahfarokhi, M., Shafieizadeh, M., Mahmoudi, E., Eskandari, F., Rashidi, M., Arshi, A., & Mokhtari-Farsani, A. (2024) · Molecular Cancer · doi:10.1186/s12943-023-01925-5 · Cited by 251
Yi, M., Nissley, D. V., McCormick, F. P., & Stephens, R. M. (2020) · Scientific Reports · doi:10.1038/s41598-020-66986-8 · Cited by 235
Metabolic networks in mutant KRAS-driven tumours: tissue specificities and the microenvironment
Kerk, S. A., Papagiannakopoulos, T. Y., Shah, Y. M., & Lyssiotis, C. A. (2021) · Nature reviews. Cancer · doi:10.1038/s41568-021-00375-9 · Cited by 246
Dey, P., Li, J., Zhang, J., Chaurasiya, S., Strom, A., Wang, H., Liao, W.-T., Cavallaro, F., Denz, P., Bernard, V., et al. (2020) · Cancer Discovery · doi:10.1158/2159-8290.cd-19-0297 · Cited by 213
“In addition, although KRAS* is critical for all stages of tumorigenesis from initiation to metastasis, challenges surrounding anti–mutant KRAS therapeutics, coupled with murine studies showing bypass of KRAS* dependency (3, 55), underscore the need for alternative strategies targeting KRAS*dependent circuitry to treat…”
BackgroundExosome-mediated delivery of CRISPR/Cas9 for targeting of oncogenic Kras G12D in pancreatic cancer
McAndrews, K. M., Xiao, F., Chronopoulos, A., LeBleu, V. S., Kugeratski, F. G., & Kalluri, R. (2021) · Life Science Alliance · doi:10.26508/lsa.202000875 · Cited by 216
Rational Design and Synthesis of Novel Dual PROTACs for Simultaneous Degradation of EGFR and PARP
Zheng, M., Huo, J., Gu, X., Wang, Y., Wu, C., Zhang, Q., Wang, W., Liu, Y., Liu, Y., Zhou, X., et al. (2021) · Journal of Medicinal Chemistry · doi:10.1021/acs.jmedchem.1c00649 · Cited by 206
KRAS drives immune evasion in a genetic model of pancreatic cancer
Ischenko, I., D’Amico, S., Rao, M., Li, J., Hayman, M. J., Powers, S., Petrenko, O., & Reich, N. C. (2021) · Nature Communications · doi:10.1038/s41467-021-21736-w · Cited by 192
Molecular Characterization of KRAS Wild-type Tumors in Patients with Pancreatic Adenocarcinoma
Philip, P. A., Azar, I., Xiu, J., Hall, M. J., Hendifar, A. E., Lou, E., Hwang, J. J., Gong, J., Feldman, R., Ellis, M., et al. (2022) · Clinical Cancer Research · doi:10.1158/1078-0432.ccr-21-3581 · Cited by 191
Bispecific antibodies targeting mutant RAS neoantigens
Douglass, J., Hsiue, E. H.-C., Mog, B. J., Hwang, M. S., DiNapoli, S. R., Pearlman, A. H., Miller, M. S., Wright, K. M., Azurmendi, P. A., Wang, Q., et al. (2021) · Science Immunology · doi:10.1126/sciimmunol.abd5515 · Cited by 171
Endocrine-Exocrine Signaling Drives Obesity-Associated Pancreatic Ductal Adenocarcinoma
Chung, K. M., Singh, J., Lawres, L., Dorans, K. J., Garcia, C., Burkhardt, D. B., Robbins, R., Bhutkar, A., Cardone, R., Zhao, X., et al. (2020) · Cell · doi:10.1016/j.cell.2020.03.062 · Cited by 150
Self-citationDrugging KRAS: Current perspectives and state-of-art review
Parikh, K., Banna, G., Liu, S. V., Friedlaender, A., Desai, A., Subbiah, V., & Addeo, A. (2022) · Journal of Hematology & Oncology · doi:10.1186/s13045-022-01375-4 · Cited by 164
Identification of DHODH as a therapeutic target in small cell lung cancer
Li, L., Ng, S. R., Colón, C. I., Drapkin, B. J., Hsu, P. P., Li, Z., Nabel, C. S., Lewis, C. A., Romero, R., Mercer, K. L., et al. (2019) · Science Translational Medicine · doi:10.1126/scitranslmed.aaw7852 · Cited by 140
Self-citationYang, Y., Gabra, M. B. I., Hanse, E. A., Lowman, X. H., Tran, T. Q., Li, H., Milman, N., Liu, J., Reid, M. A., Locasale, J. W., et al. (2019) · Nature Communications · doi:10.1038/s41467-019-08759-0 · Cited by 129
Defining the KRAS- and ERK-dependent transcriptome in KRAS-mutant cancers
Klomp, J. A., Klomp, J. E., Stalnecker, C. A., Bryant, K. L., Edwards, A. C., Drizyte‐Miller, K., Hibshman, P. S., Diehl, J. N., Lee, Y. S., Morales, A. J., et al. (2024) · Science · doi:10.1126/science.adk0775 · Cited by 139
Pancreatic Cancer: Molecular Characterization, Clonal Evolution and Cancer Stem Cells
Pelosi, E., Castelli, G., & Testa, U. (2017) · Biomedicines · doi:10.3390/biomedicines5040065 · Cited by 128
Mechanisms of Resistance to KRASG12C Inhibitors
Dunnett-Kane, V., Nicola, P. A., Blackhall, F. H., & Lindsay, C. R. (2021) · Cancers · doi:10.3390/cancers13010151 · Cited by 122
Brown, W. S., McDonald, P. C., Nemirovsky, O., Awrey, S., Chafe, S. C., Schaeffer, D. F., Li, J., Renouf, D. J., Stanger, B. Z., & Dedhar, S. (2020) · Cell Reports Medicine · doi:10.1016/j.xcrm.2020.100131 · Cited by 111
Poggi, A. D., Varesano, S., & Zocchi, M. R. (2018) · Frontiers in Immunology · doi:10.3389/fimmu.2018.00262 · Cited by 113
Discovery of a selective inhibitor of doublecortin like kinase 1
Ferguson, F. M., Nabet, B., Raghavan, S., Liu, Y., Leggett, A. L., Kuljanin, M., Kalekar, R. L., Yang, A., He, S., Wang, J., et al. (2020) · Nature Chemical Biology · doi:10.1038/s41589-020-0506-0 · Cited by 102
Significance of TP53, CDKN2A, SMAD4 and KRAS in Pancreatic Cancer
Stefanoudakis, D., Frountzas, M., Schizas, D., Michalopoulos, N. V., Drakaki, A., & Toutouzas, K. G. (2024) · Current Issues in Molecular Biology · doi:10.3390/cimb46040177 · Cited by 110
Therapeutic trends in pancreatic ductal adenocarcinoma (PDAC)
Chandana, S. R., Babiker, H. M., & Mahadevan, D. (2018) · Expert Opinion on Investigational Drugs · doi:10.1080/13543784.2019.1557145 · Cited by 102
Combating pancreatic cancer with PI3K pathway inhibitors in the era of personalised medicine
Conway, J. R. W., Herrmann, D., Evans, T. J., Morton, J. P., & Timpson, P. (2018) · Gut · doi:10.1136/gutjnl-2018-316822 · Cited by 97
Weisner, J., Landel, I., Reintjes, C., Uhlenbrock, N., Trajkovic‐Arsic, M., Dienstbier, N., Hardick, J., Ladigan, S., Lindemann, M., Smith, S. P., et al. (2019) · Cancer Research · doi:10.1158/0008-5472.can-18-2861 · Cited by 99
KRAS G12C Mutations in NSCLC: From Target to Resistance
Addeo, A., Banna, G. L., & Friedlaender, A. (2021) · Cancers · doi:10.3390/cancers13112541 · Cited by 85
Najafi, M., Ahmadi, A., & Mortezaee, K. (2019) · Cell Biology International · doi:10.1002/cbin.11187 · Cited by 80
Yang, Y., Zhang, H., Huang, S., & Chu, Q. (2023) · Journal of Clinical Medicine · doi:10.3390/jcm12020709 · Cited by 77
Santana-Codina, N., Chandhoke, A. S., Yu, Q., Małachowska, B., Kuljanin, M., Gikandi, A., Stańczak, M., Gableske, S., Jedrychowski, M. P., Scott, D. A., et al. (2020) · Cell Reports · doi:10.1016/j.celrep.2020.03.021 · Cited by 77
CRISPR/Cas: From Tumor Gene Editing to T Cell-Based Immunotherapy of Cancer
Azangou‐Khyavy, M., Ghasemi, M., Khanali, J., Boroomand-Saboor, M., Jamalkhah, M., Soleimani, M., & Kiani, J. (2020) · Frontiers in Immunology · doi:10.3389/fimmu.2020.02062 · Cited by 80
YAP1 oncogene is a context-specific driver for pancreatic ductal adenocarcinoma
Tu, B., Yao, J., Ferri-Borgogno, S., Zhao, J., Chen, S., Wang, Q., Yan, L., Zhou, X., Zhu, C., Bang, S., et al. (2019) · JCI Insight · doi:10.1172/jci.insight.130811 · Cited by 75
Drugging the Undruggable: Advances on RAS Targeting in Cancer
Molina‐Arcas, M., Samani, A., & Downward, J. (2021) · Genes · doi:10.3390/genes12060899 · Cited by 76
Relevance of circulating hybrid cells as a non-invasive biomarker for myriad solid tumors
Dietz, M. S., Sutton, T. L., Walker, B. S., Gast, C. E., Zarour, L. R., Sengupta, S. K., Swain, J. R., Eng, J. R., Parappilly, M. S., Limbach, K. E., et al. (2021) · Scientific Reports · doi:10.1038/s41598-021-93053-7 · Cited by 70
Overcoming Resistance to Drugs Targeting KRAS Mutation
Jiao, D., & Yang, S. (2020) · The Innovation · doi:10.1016/j.xinn.2020.100035 · Cited by 61
Pandey, R., Zhou, M., Islam, S., Chen, B., Barker, N. K., Langlais, P. R., Srivastava, A., Luo, M., Cooke, L. S., Weterings, E., et al. (2019) · Scientific Reports · doi:10.1038/s41598-019-54545-9 · Cited by 63
K-Ras prenylation as a potential anticancer target
Baranyi, M., Buday, L., & Hegedűs, B. (2020) · Cancer and Metastasis Reviews · doi:10.1007/s10555-020-09902-w · Cited by 62
Phosphatidylserine binding directly regulates TIM-3 function
Smith, C. M., Li, A., Krishnamurthy, N., & Lemmon, M. A. (2021) · Biochemical Journal · doi:10.1042/bcj20210425 · Cited by 61
Kumarasamy, V. M., Frangou, C. G., Wang, J., Wan, Y., Dynka, A., Rosenheck, H. R., Dey, P., Abel, E. V., Knudsen, E. S., & Witkiewicz, A. K. (2024) · Cancer Research · doi:10.1158/0008-5472.can-23-2504 · Cited by 57
Targeting the α4–α5 dimerization interface of K-RAS inhibits tumor formation in vivo
Khan, I., Spencer-Smith, R., & O’Bryan, J. P. (2019) · Oncogene · doi:10.1038/s41388-018-0636-y · Cited by 54
Molecular pathways, resistance mechanisms and targeted interventions in non-small-cell lung cancer
Wang, Z., Xing, Y., Li, B., Li, X., Liu, B., & Wang, Y. (2022) · Molecular Biomedicine · doi:10.1186/s43556-022-00107-x · Cited by 62
CRISPR/Cas9-Mediated Knock-Out of KrasG12D Mutated Pancreatic Cancer Cell Lines
Lentsch, E., Li, L., Pfeffer, S., Ekici, A. B., Taher, L., Pilarsky, C. P., & Grützmann, R. (2019) · International Journal of Molecular Sciences · doi:10.3390/ijms20225706 · Cited by 54
Kshattry, S., Saha, A., Gries, P., Tiziani, S., Stone, E. M., Georgiou, G., & DiGiovanni, J. (2019) · npj Precision Oncology · doi:10.1038/s41698-019-0088-z · Cited by 54
Wang, Y., Fang, T., Huang, L., Wang, H., Zhang, L., Wang, Z., & Cui, Y. (2018) · Biochemical and Biophysical Research Communications · doi:10.1016/j.bbrc.2018.05.024 · Cited by 53
Development of drug-inducible CRISPR-Cas9 systems for large-scale functional screening
Sun, N., Petiwala, S. M., Wang, R., Lu, C., Hu, M., Ghosh, S., Hao, Y., Miller, C. P., & Chung, N. (2019) · BMC Genomics · doi:10.1186/s12864-019-5601-9 · Cited by 49
Walker, G., Brown, C., Ge, X., Kumar, S., Muzumdar, M. D., Gupta, K., & Bhattacharyya, M. (2023) · Nature Nanotechnology · doi:10.1038/s41565-023-01547-4 · Cited by 46
Self-citationAdaptive and Reversible Resistance to Kras Inhibition in Pancreatic Cancer Cells
Chen, P., Muzumdar, M. D., Dorans, K. J., Robbins, R., Bhutkar, A. J., Rosario, A. M. D., Mertins, P., Qiao, J., Schäfer, C., Gertler, F. B., et al. (2017) · Cancer Research · doi:10.1158/0008-5472.can-17-2129 · Cited by 47
Self-citationRole of RAS signaling in ovarian cancer
Therachiyil, L., Anand, A., Azmi, A., Bhat, A. A., Korashy, H. M., & Shahab Uddin, M. S. (2022) · F1000Research · doi:10.12688/f1000research.126337.1 · Cited by 46
Pancreatic cancer: molecular pathogenesis and emerging therapeutic strategies
Rozengurt, E., & Eibl, G. (2026) · Signal Transduction and Targeted Therapy · doi:10.1038/s41392-025-02499-y · Cited by 49
Yu, L., Teoh, S. T., Ensink, E., Ogrodzinski, M. P., Yang, C., Vazquez, A. I., & Lunt, S. Y. (2019) · Cancer & Metabolism · doi:10.1186/s40170-019-0205-z · Cited by 44
Li, C., Zeng, X., Yu, H., Gu, Y., & Zhang, W. (2018) · World Journal of Surgical Oncology · doi:10.1186/s12957-018-1519-y · Cited by 40
KRAS: A Promising Therapeutic Target for Cancer Treatment
Wu, H.-Z., Xiao, J., Xiao, S., & Cheng, Y. (2019) · Current Topics in Medicinal Chemistry · doi:10.2174/1568026619666190905164144 · Cited by 41
Insight into the mechanism of allosteric activation of PI3Kα by oncoprotein K-Ras4B
Li, X., Dai, J., Ni, D., He, X., Zhang, H., Zhang, J., Fu, Q., Liu, Y., & Lu, S. (2019) · International Journal of Biological Macromolecules · doi:10.1016/j.ijbiomac.2019.12.020 · Cited by 39
Oncolytic Virus-Mediated RAS Targeting in Rhabdomyosarcoma
Phelps, M., Yang, H., Patel, S. H., Rahman, M. M., McFadden, G., & Chen, E. Y. (2018) · Molecular Therapy — Oncolytics · doi:10.1016/j.omto.2018.09.001 · Cited by 38
Targeted chemotherapy overcomes drug resistance in melanomaPreprint
Yue, J., Vendramin, R., Liu, F., Lopez, O., Valencia, M. G., Santos, H. G. D., Gaidosh, G., Beckedorff, F., Blumenthal, E., Speroni, L., et al. (2020) · Genes & Development · doi:10.1101/gad.333864.119 · Cited by 38
The Role of Noncoding RNAs in the Regulation of Anoikis and Anchorage-Independent Growth in Cancer
Lee, H. Y., Son, S. W., Moeng, S., Choi, S. Y., & Park, J. K. (2021) · International Journal of Molecular Sciences · doi:10.3390/ijms22020627 · Cited by 35
Targeting KRAS in PDAC: A New Way to Cure It?
He, Q., Liu, Z., & Wang, J. (2022) · Cancers · doi:10.3390/cancers14204982 · Cited by 39
MEK nuclear localization promotes YAP stability via sequestering β-TrCP in KRAS mutant cancer cells
Xu, H., Zhou, S., Xia, H., Yu, H., Tang, Q., & Bi, F. (2019) · Cell Death and Differentiation · doi:10.1038/s41418-019-0309-6 · Cited by 34
Bilal, F., Arenas, E. J., Pedersen, K., Martínez-Sabadell, A., Nabet, B., Guruceaga, E., Vicent, S., Tabernero, J. M., Macarulla, T. M., & Arribas, J. (2021) · Cancer Research · doi:10.1158/0008-5472.can-20-4263 · Cited by 32
RAS Function in cancer cells: translating membrane biology and biochemistry into new therapeutics
Kattan, W. E., & Hancock, J. F. (2020) · Biochemical Journal · doi:10.1042/bcj20190839 · Cited by 33
Rozengurt, E., & Eibl, G. (2021) · Cancers · doi:10.3390/cancers13205126 · Cited by 31
Mollinedo, F., & Gajate, C. (2019) · Annals of Translational Medicine · doi:10.21037/atm.2019.06.40 · Cited by 29
Diehl, J. N., Klomp, J. E., Snare, K. R., Hibshman, P. S., Blake, D. R., Kaiser, Z. D., Gilbert, T. S. K., Baldelli, E., Pierobon, M., Papke, B., et al. (2021) · Journal of Biological Chemistry · doi:10.1016/j.jbc.2021.101335 · Cited by 30
A pan-KRAS degrader for the treatment of KRAS-mutant cancers
Yang, J., Wang, Q.-L., Wang, G., Ye, J.-C., Li, Z.-Q., Wang, J.-Y., Liang, Z., Li, S., Sun, C., Liao, W., et al. (2024) · Cell Discovery · doi:10.1038/s41421-024-00699-4 · Cited by 32
Escaping KRAS: Gaining Autonomy and Resistance to KRAS Inhibition in KRAS Mutant Cancers
Adachi, Y., Kimura, R., Hirade, K., & Ebi, H. (2021) · Cancers · doi:10.3390/cancers13205081 · Cited by 28
Genome-wide DNA methylation analysis of KRAS mutant cell lines
Tew, B. Y., Durand, J. K., Bryant, K. L., Hayes, T. K., Peng, S., Tran, N. L., Gooden, G. C., Buckley, D. N., Der, C. J., Baldwin, A. S., et al. (2020) · Scientific Reports · doi:10.1038/s41598-020-66797-x · Cited by 29
Stromal-derived NRG1 enables oncogenic KRAS bypass in pancreas cancerPreprint
Han, J., Xu, J., Liu, Y., Liang, S., LaBella, K. A., Chakravarti, D., Spring, D. J., Xia, Y., & DePinho, R. A. (2023) · Genes & Development · doi:10.1101/gad.351037.123 · Cited by 27
The KRAS/Lin28B axis maintains stemness of pancreatic cancer cells via the let‐7i/TET3 pathway
Liu, Y., Wang, D., Zhou, M., Chen, H., Wang, H., Min, J., Chen, J., Wu, S., Ni, X., Zhang, Y., et al. (2020) · Molecular Oncology · doi:10.1002/1878-0261.12836 · Cited by 25
CRISPR Cas9 in Pancreatic Cancer Research
Yang, H., Bailey, P. J., & Pilarsky, C. P. (2019) · Frontiers in Cell and Developmental Biology · doi:10.3389/fcell.2019.00239 · Cited by 24
Drivers of Gene Expression Dysregulation in Pancreatic Cancer
Venkat, S., Alahmari, A. A., & Feigin, M. E. (2021) · Trends in cancer · doi:10.1016/j.trecan.2021.01.008 · Cited by 23
CRISPR and KRAS: a match yet to be made
Bender, G., Yamaci, R. F., & Taneri, B. (2021) · Journal of Biomedical Science · doi:10.1186/s12929-021-00772-0 · Cited by 25
Gene and RNA Editing: Revolutionary Approaches to Treating Diseases
Li, J., Huang, J., Liao, Y., Hu, T., Wang, C., Zhang, W., & Huang, C. (2025) · MedComm · doi:10.1002/mco2.70389 · Cited by 23
Animal models for modeling pancreatic cancer and novel drug discovery
Bisht, S., & Feldmann, G. (2019) · Expert Opinion on Drug Discovery · doi:10.1080/17460441.2019.1566319 · Cited by 21
Suppression of the HBP Function Increases Pancreatic Cancer Cell Sensitivity to a Pan-RAS Inhibitor
Ricciardiello, F., Bergamaschi, L., Vitto, H. D., Yang, G., Zhang, T., Palorini, R., & Chiaradonna, F. (2021) · Cells · doi:10.3390/cells10020431 · Cited by 21
Khan, H. Y., Nagasaka, M., Aboukameel, A., Alkhalili, O. A., Uddin, M. H., Bannoura, S. F., Mzannar, Y., Azar, I. H., Beal, E. W., Tobon, M. E., et al. (2023) · Molecular Cancer Therapeutics · doi:10.1158/1535-7163.mct-23-0251 · Cited by 18
Preclinical characterization of tunlametinib, a novel, potent, and selective MEK inhibitor
Liu, Y., Cheng, Y., Huang, G., Xia, X., Wang, X., & Tian, H. (2023) · Frontiers in Pharmacology · doi:10.3389/fphar.2023.1271268 · Cited by 17
Dutta, D., Ray, P., De, A., Ghosh, A., Hazra, R. S., Ghosh, P., Banerjee, S., Díaz, F. J., Upadhyay, S. P., Quadir, M., et al. (2024) · PLoS ONE · doi:10.1371/journal.pone.0297749 · Cited by 17
Targeting KRAS G12C mutation in lung adenocarcinoma
Rohatgi, A., & Govindan, R. (2021) · Lung Cancer · doi:10.1016/j.lungcan.2021.12.021 · Cited by 17
KRAS RENAISSANCE(S) in Tumor Infiltrating B Cells in Pancreatic Cancer
Meng, Q., Valentini, D., Rao, M., & Maeurer, M. J. (2018) · Frontiers in Oncology · doi:10.3389/fonc.2018.00384 · Cited by 17
ERF deletion rescues RAS deficiency in mouse embryonic stem cellsPreprint
Mayor‐Ruiz, C., Olbrich, T., Drosten, M., Lecona, E., Vega-Sendino, M., Ortega, S., Domı́nguez, O., Barbacid, M., Ruiz, S., & Fernández-Capetillo, Ó. (2018) · Genes & Development · doi:10.1101/gad.310086.117 · Cited by 17
Becker, J. H., Metropulos, A. E., Spaulding, C., Marinelarena, A. M., Shields, M. A., Principe, D. R., Pham, T. D., & Munshi, H. G. (2024) · Cancer Research · doi:10.1158/0008-5472.can-23-3574 · Cited by 17
VPAC2 Receptor Signaling Promotes Growth and Immunosuppression in Pancreatic Cancer
Passang, T., Wang, S., Zhang, H., Zeng, F., Hsu, P.-C., Wang, W., Li, J.-M., Liu, Y., Ravindranathan, S., Lesinski, G. B., et al. (2024) · Cancer Research · doi:10.1158/0008-5472.can-23-3628 · Cited by 17
Conquering oncogenic KRAS and its bypass mechanisms
Hou, P., & Wang, Y. (2022) · Theranostics · doi:10.7150/thno.71260 · Cited by 18
KRAS-G12C covalent inhibitors: A game changer in the scene of cancer therapies
Naim, N., Moukheiber, S., Daou, S., & Kourié, H. R. (2021) · Critical Reviews in Oncology/Hematology · doi:10.1016/j.critrevonc.2021.103524 · Cited by 16
Sinkala, M., Mulder, N., & Martin, D. P. (2018) · Oncotarget · doi:10.18632/oncotarget.25632 · Cited by 16
Noormohamadi, H., Samarkhazan, H. S., Kargar, M., Maroufi, F., Servatian, N., & Davami, F. (2025) · Discover Oncology · doi:10.1007/s12672-025-03383-5 · Cited by 17
Models of pancreatic ductal adenocarcinoma
Dennaoui, R., Shrestha, H., & Wagner, K. (2021) · Cancer and Metastasis Reviews · doi:10.1007/s10555-021-09989-9 · Cited by 19
One-shot dual gene editing for drug-resistant pancreatic cancer therapy
Won, E.-J., Park, H., Chang, S.-H., Kim, J. H., Kwon, H., Cho, Y., & Yoon, T. (2021) · Biomaterials · doi:10.1016/j.biomaterials.2021.121252 · Cited by 15
Sinnett‐Smith, J. W., Anwar, T., Reed, E. F., Teper, Y., Eibl, G., & Rozengurt, E. (2022) · Molecular Cancer Therapeutics · doi:10.1158/1535-7163.mct-21-0964 · Cited by 17
Novel Targets in Pancreatic Cancer Therapy - Current Status and Ongoing Translational Efforts
Bisht, S., & Feldmann, G. (2018) · Oncology Research and Treatment · doi:10.1159/000493437 · Cited by 14
Endocrine-exocrine signaling drives obesity-associated pancreatic ductal adenocarcinomaPreprint
Chung, K. M., Singh, J., Lawres, L., Dorans, K. J., Garcia, C. C., Burkhardt, D. B., Robbins, R., Bhutkar, A. J., CARDONE, R. L., Zhao, X., et al. (2019) · bioRxiv (Cold Spring Harbor Laboratory) · doi:10.1101/663583 · Cited by 14
Self-citationClinical significance of genetic alterations in endoscopically obtained pancreatic cancer specimens
Takano, S., Fukasawa, M., Shindo, H., Takahashi, E., Hirose, S., Fukasawa, Y., Kawakami, S., Hayakawa, H., Kuratomi, N., Kadokura, M., et al. (2021) · Cancer Medicine · doi:10.1002/cam4.3723 · Cited by 13
Morphological and Molecular Characterization of KRAS G12C-Mutated Lung Adenocarcinomas
Pîrlog, R., Piton, N., Lamy, A., Guisier, F., Berindan‐Neagoe, I., Sabourin, J., & Marguet, F. (2022) · Cancers · doi:10.3390/cancers14041030 · Cited by 13
Spagnuolo, A., Maione, P., & Gridelli, C. (2022) · Translational Lung Cancer Research · doi:10.21037/tlcr-21-948 · Cited by 15
Rafael, D. F. D. S., Montero, S., Carcavilla, P., Andrade, F., German-Cortés, J., Díaz‐Riascos, Z. V., Seras‐Franzoso, J., Munive, M. L., Fernández, B., Pereira, A., et al. (2023) · ACS Applied Materials & Interfaces · doi:10.1021/acsami.2c19897 · Cited by 13
Basseville, A., Violet, P.-C., Safari, M., Sourbier, C., Linehan, W. M., Robey, R. W., Levine, M., Sackett, D. L., & Bates, S. E. (2022) · Cancers · doi:10.3390/cancers14112643 · Cited by 12
Complex interplay between RAS GTPases and RASSF effectors regulates subcellular localization of YAP
Singh, S., Astrain, G. B., Hincapie, A. M., Goudreault, M., & Smith, M. J. (2024) · EMBO Reports · doi:10.1038/s44319-024-00203-9 · Cited by 12
Metadata
- Authors
- Muzumdar, M. D., Chen, P.-Y., Dorans, K. J., Chung, K. M., Bhutkar, A., Hong, E., Noll, E. M., Sprick, M. R., Trumpp, A., & Jacks, T.
- Affiliations
- Harvard University (US)
- Koch Institute for Integrative Cancer Research At MIT (US)
- German Cancer Research Center (DE)
- Howard Hughes Medical Institute (US)
- Corresponding author
- Jacks, Tyler
- ORCID
- Venue
- Nature Communications
- Published
- 2017-10-23
- Volume
- 8
- Issue
- 1
- Pages
- 1090-1090
- ISSN
- 2041-1723 (ISSN-L)
- PMC
- PMC5653666
- OpenAlex
- W2765585947
- Cited by
- 177
- References
- 70
- Citations by year
- 2026: 10 · 2025: 17 · 2024: 20 · 2023: 19 · 2022: 23 · 2021: 30 · 2020: 19 · 2019: 21 · 2018: 16 · 2017: 2
- FWCI
- 6.99
- Type
- journal article
- Language
- en
- Open access
- gold
- doi.org
- Locations
- Nature Communications (publishedVersion, cc-by)
- PubMed Central (publishedVersion, cc-by)
- PubMed (publishedVersion)
- Digital Access to Scholarship at Harvard (DASH) (Harvard University) (submittedVersion, cc-by)
- RePEc: Research Papers in Economics (submittedVersion)
- DOAJ (DOAJ: Directory of Open Access Journals) (submittedVersion, cc-by-sa)
- DOAJ (DOAJ: Directory of Open Access Journals) (submittedVersion)
- DSpace@MIT (Massachusetts Institute of Technology) (submittedVersion, cc-by-nc)
- Nature
- Funders
- U.S. Department of Defense (W81XWH-12-043, P30-CA14051, W81XWH, W81XWH-12)
- Howard Hughes Medical Institute (P30-CA14051)
- Conquer Cancer Foundation
- Pancreatic Cancer Action Network
- American Society of Clinical Oncology
- Harvard University (KL2 TR001100)
- Harvard Catalyst (KL2 TR001100, TR001100)
- Koch Institute for Integrative Cancer Research, Massachusetts Institute of Technology (P30-CA14051, Grant P30-CA14051)
- National Institutes of Health (W81XWH, KL2TR001100)
- National Cancer Institute (K08CA208016, CA14051, K08-CA2080016, U01CA199253, Grant P30-CA14051, P30CA014051, P30-CA-14051)
- National Center for Research Resources
- National Center for Advancing Translational Sciences (TR001100)
- Topics
- Health Sciences › Medicine › Oncology › Pancreatic and Hepatic Oncology Research
- Life Sciences › Biochemistry, Genetics and Molecular Biology › Molecular Biology › Protein Kinase Regulation and GTPase Signaling
- Life Sciences › Biochemistry, Genetics and Molecular Biology › Cancer Research › Cancer Genomics and Diagnostics
- Keywords
- pancreatic ductal adenocarcinoma, KRAS, KRAS inhibition, PI3K signaling, MAPK signaling, PI3K inhibitors, drug resistance, metastasis-associated genes, gene expression profiling, CRISPR/Cas genome editing
- MeSH terms
- Proto-Oncogene Mas, Animals, Antineoplastic Agents, Benzimidazoles, Humans, Indazoles, Morpholines, Pancreatic Neoplasms, Phenylurea Compounds, Piperidines, Purines, Pyrimidines, Pyrimidinones, Sulfonamides, Thiazoles, Immunoblotting, Proto-Oncogene Proteins p21(ras), Carcinoma, Pancreatic Ductal, Mice, Quinazolinones, DNA Copy Number Variations
About these checks
Registry, retraction, Cites and statistics results are computed, not judged, with one exception: a printed reference that no index lists is read once by a model before it counts as a citation error. Claims are extracted by a model and kept only when their quote appears verbatim in the text; each cited source is then checked, with a model’s help, for whether it says what the claim relies on. Those verdicts can be wrong — read the claim’s quote and the cited source before relying on one.
Statistics and arithmetic are recomputed, not judged.
Confidence bands are shown only for fields calibrated on our annotated test set. None is calibrated yet, so no band is shown.
What counts as a claim ›How we measure confidence ›How we check this ›
Are you an author, or do you see a problem with this page? Request a review
