Cited by 335Muscle Physiology and DisordersExercise and Physiological ResponsesMuscle metabolism and nutrition

The DOI matches its Crossref record; 44 of the 44 references it cites were found in a registry or an index.

Irisin is a pro-myogenic factor that induces skeletal muscle hypertrophy and rescues denervation-induced atrophy

Open access

Abstract

Exercise induces expression of the myokine irisin, which is known to promote browning of white adipose tissue and has been shown to mediate beneficial effects following exercise. Here we show that irisin induces expression of a number of pro-myogenic and exercise response genes in myotubes. Irisin increases myogenic differentiation and myoblast fusion via activation of IL6 signaling. Injection of irisin in mice induces significant hypertrophy and enhances grip strength of uninjured muscle. Following skeletal muscle injury, irisin injection improves regeneration and induces hypertrophy. The effects of irisin on hypertrophy are due to activation of satellite cells and enhanced protein synthesis. In addition, irisin injection rescues loss of skeletal muscle mass following denervation by enhancing satellite cell activation and reducing protein degradation. These data suggest that irisin functions as a pro-myogenic factor in mice.

Overview

The claims and statistics of this paper haven’t been checked yet.

Run the check — free, no account needed. It reads the open-access text and checks the sources it cites.

A few free checks a day · papers already verified open instantly · results are public

Integrity signals

Registry

Crossref · 10.1038/s41467-017-01131-0

Cites

44 of 44 references verified0 citation errors · 0 not checkable

Statistics

Figures

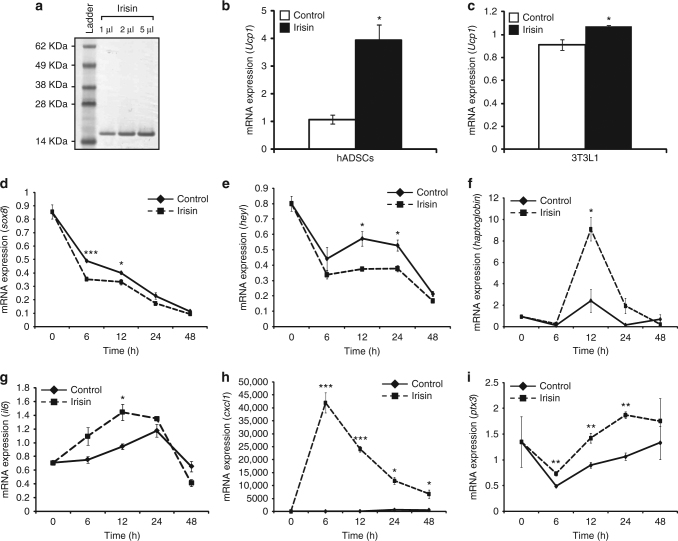
Fig. 1 Irisin induces gene expression changes and improves myogenesis. a Image of Coomassie-stained polyacrylamide gel showing recombinant His-tagged irisin protein. Recombinant irisin protein was detected as a single band at ~15 kDa. Lane 1 shows the SeeBlue Plus 2 Pre-Stained ladder. Lanes 2, 3, and 4 show 1, 2, and 5 μl of the purified His-tagged irisin protein, respectively. b Graph representing qPCR analysis of Ucp1 expression in human subcutaneous white adipose-derived stem cells (hADSCs) after 21 days of adipogenic differentiation in the presence of DB (control) or irisin (n = 2 biological replicates). c Graph representing qPCR analysis of Ucp1 in 3T3L1 fibroblasts after 4 days of adipogenic differentiation in the presence of DB (control) or irisin (n = 3 biological replicates). Graphs displaying qPCR analysis of sox8 (d), heyL (e), haptoglobin (f), il6 (g), cxcl1 (h), and ptx3 (i) in 72 h-differentiated C2C12 myotubes treated with DB (control) or recombinant irisin protein for 0, 6, 12, 24, and 48 h. All qPCR graphs show gene expression normalized to gapdh (n = 3 biological replicates). Error bars represent mean ± SEM. Student’s t-test was performed for b and all relevant figure panels between d and i, and one-way ANOVA was peformed for c. Significance is indicated with *p < 0.05, **p < 0.01 and ***p < 0.001
Fig. 1 Irisin induces gene expression changes and improves myogenesis. a Image of Coomassie-stained polyacrylamide gel showing recombinant His-tagged irisin protein. Recombinant irisin protein was detected as a single band at ~15 kDa. Lane 1 shows the SeeBlue Plus 2 Pre-Stained ladder. Lanes 2, 3, and 4 show 1, 2, and 5 μl of the purified His-tagged irisin protein, respectively. b Graph representing qPCR analysis of Ucp1 expression in human subcutaneous white adipose-derived stem cells (hADSCs) after 21 days of adipogenic differentiation in the presence of DB (control) or irisin (n = 2 biological replicates). c Graph representing qPCR analysis of Ucp1 in 3T3L1 fibroblasts after 4 days of adipogenic differentiation in the presence of DB (control) or irisin (n = 3 biological replicates). Graphs displaying qPCR analysis of sox8 (d), heyL (e), haptoglobin (f), il6 (g), cxcl1 (h), and ptx3 (i) in 72 h-differentiated C2C12 myotubes treated with DB (control) or recombinant irisin protein for 0, 6, 12, 24, and 48 h. All qPCR graphs show gene expression normalized to gapdh (n = 3 biological replicates). Error bars represent mean ± SEM. Student’s t-test was performed for b and all relevant figure panels between d and i, and one-way ANOVA was peformed for c. Significance is indicated with *p < 0.05, **p < 0.01 and ***p < 0.001CC BY · PubMed Central
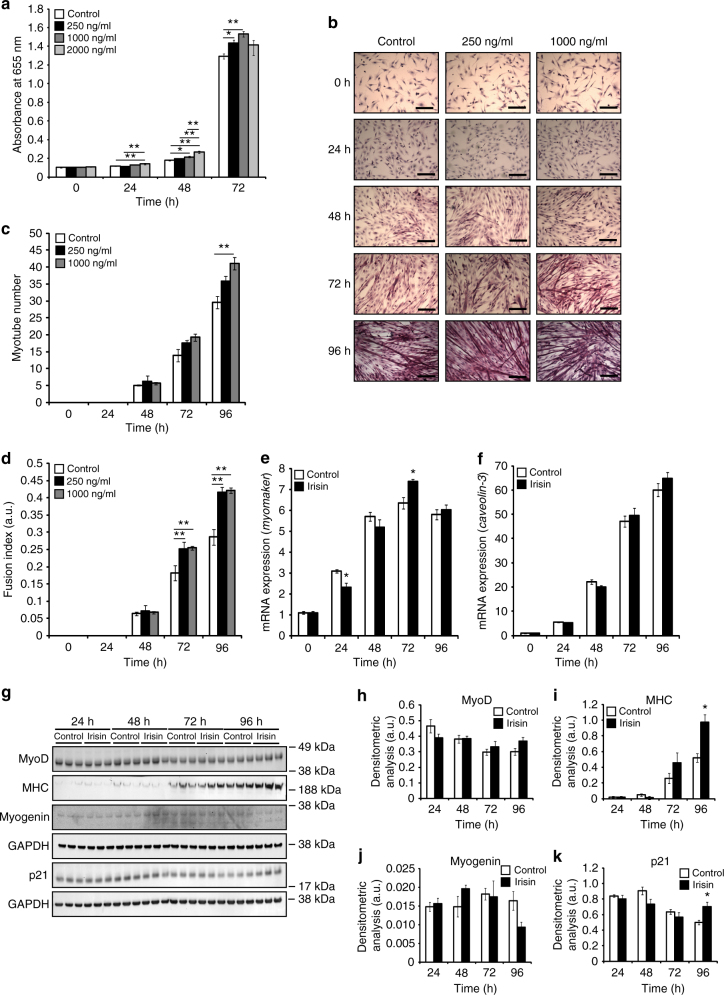
Fig. 2 Irisin promotes skeletal muscle differentiation. a Graph showing the absorbance readings of cells treated with DB (control) or increasing concentrations of irisin (250, 1000, and 2000 ng/ml) at 0, 24, 48, and 72 h of proliferation. Absorbance reading at 655 nm is proportional to the number of cells present and hence, indicative of myoblast proliferation. (n = 16 biological replicates). b Representative images of H&E-stained myoblasts at 0, 24, 48, 72, and 96 h of differentiation in the presence of DB (control) or irisin (250 and 1000 ng/ml). c Graph showing quantification of myotube number at 0, 24, 48, 72, and 96 h of differentiation in the presence of DB (control) or irisin (250 and 1000 ng/ml) (n = 3 biological replicates). d Graph showing quantification of fusion index at 0, 24, 48, 72, and 96 h of differentiation in the presence of DB (control) or irisin (250 and 1000 ng/ml) (n = 3 biological replicates). Graphs displaying qPCR analysis of e myomaker and f caveolin-3 expression normalized to GAPDH in differentiating myoblasts (0, 24, 48, 72, and 96 h) treated with DB (control) or irisin (1000 ng/ml) (n = 3 biological replicates). g IB analysis of MyoD, MHC, myogenin, and p21 protein levels. The levels of GAPDH were assessed as a loading control. Graphs show densitometric analysis of h MyoD, i MHC, j myogenin, and k p21 levels in arbitrary units (a.u), normalized to GAPDH (n = 3 biological replicates). Since MyoD, MHC, and myogenin IB analysis was performed on the same membrane, the same GAPDH was used to normalize the results. All IBs were performed on proteins collected from differentiating myotubes at 24, 48, 72, and 96 h treated with either DB (control) or irisin (1000 ng/ml). Error bars represent mean ± SEM. One-way ANOVA was performed for all relevant figure panels between a and d, and Student’s t-test was performed for all relevant figure panels between e and k. Significance is indicated with *p < 0.05 and **p < 0.01
Fig. 2 Irisin promotes skeletal muscle differentiation. a Graph showing the absorbance readings of cells treated with DB (control) or increasing concentrations of irisin (250, 1000, and 2000 ng/ml) at 0, 24, 48, and 72 h of proliferation. Absorbance reading at 655 nm is proportional to the number of cells present and hence, indicative of myoblast proliferation. (n = 16 biological replicates). b Representative images of H&E-stained myoblasts at 0, 24, 48, 72, and 96 h of differentiation in the presence of DB (control) or irisin (250 and 1000 ng/ml). c Graph showing quantification of myotube number at 0, 24, 48, 72, and 96 h of differentiation in the presence of DB (control) or irisin (250 and 1000 ng/ml) (n = 3 biological replicates). d Graph showing quantification of fusion index at 0, 24, 48, 72, and 96 h of differentiation in the presence of DB (control) or irisin (250 and 1000 ng/ml) (n = 3 biological replicates). Graphs displaying qPCR analysis of e myomaker and f caveolin-3 expression normalized to GAPDH in differentiating myoblasts (0, 24, 48, 72, and 96 h) treated with DB (control) or irisin (1000 ng/ml) (n = 3 biological replicates). g IB analysis of MyoD, MHC, myogenin, and p21 protein levels. The levels of GAPDH were assessed as a loading control. Graphs show densitometric analysis of h MyoD, i MHC, j myogenin, and k p21 levels in arbitrary units (a.u), normalized to GAPDH (n = 3 biological replicates). Since MyoD, MHC, and myogenin IB analysis was performed on the same membrane, the same GAPDH was used to normalize the results. All IBs were performed on proteins collected from differentiating myotubes at 24, 48, 72, and 96 h treated with either DB (control) or irisin (1000 ng/ml). Error bars represent mean ± SEM. One-way ANOVA was performed for all relevant figure panels between a and d, and Student’s t-test was performed for all relevant figure panels between e and k. Significance is indicated with *p < 0.05 and **p < 0.01CC BY · PubMed Central
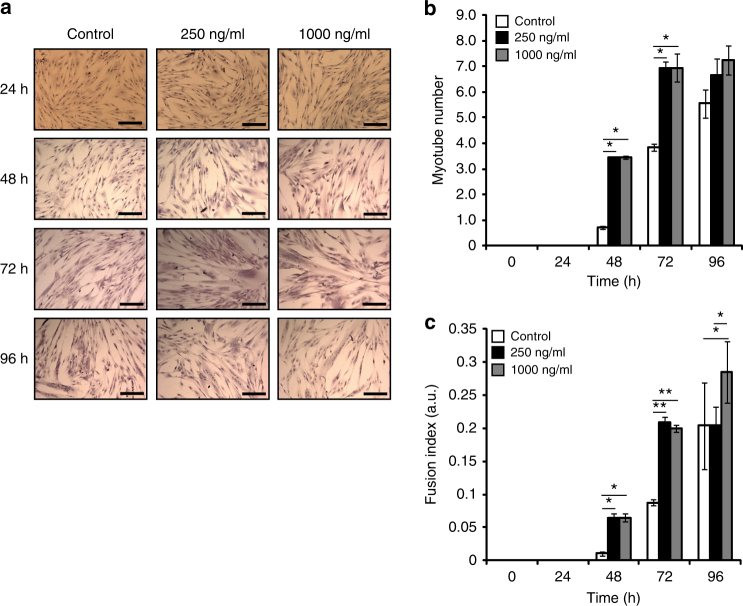
Fig. 3 Irisin enhances myogenesis in primary human myoblast cultures. a Representative images of H&E-stained 36C15Q primary myoblasts at 24, 48, 72, and 96 h of differentiation in the presence of DB (control) or irisin (250 and 1000 ng/ml). b Graph showing quantification of myotube number at 0, 24, 48, 72, and 96 h of differentiation in the presence of DB (control) or irisin (250 and 1000 ng/ml). c Graph showing quantification of fusion index at 0, 24, 48, 72, and 96 h of differentiation in the presence of DB (control) or irisin (250 and 1000 ng/ml) (n = 2 biological replicates). Error bars represent mean ± SEM. One-way ANOVA was performed for all relevant figure panels. Significance is indicated with *p < 0.05 and **p < 0.01
Fig. 3 Irisin enhances myogenesis in primary human myoblast cultures. a Representative images of H&E-stained 36C15Q primary myoblasts at 24, 48, 72, and 96 h of differentiation in the presence of DB (control) or irisin (250 and 1000 ng/ml). b Graph showing quantification of myotube number at 0, 24, 48, 72, and 96 h of differentiation in the presence of DB (control) or irisin (250 and 1000 ng/ml). c Graph showing quantification of fusion index at 0, 24, 48, 72, and 96 h of differentiation in the presence of DB (control) or irisin (250 and 1000 ng/ml) (n = 2 biological replicates). Error bars represent mean ± SEM. One-way ANOVA was performed for all relevant figure panels. Significance is indicated with *p < 0.05 and **p < 0.01CC BY · PubMed Central
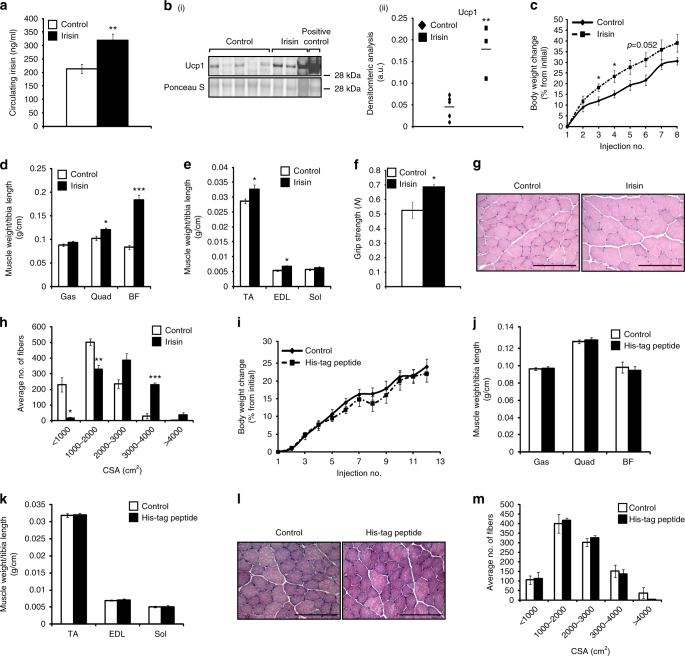
Fig. 4 Irisin improves protein synthesis and reduces protein degradation. a Graph showing levels of irisin circulating in serum of mice injected with DB (control) or recombinant irisin (n = 5 mice for DB-injected group and n = 6 mice for irisin-injected group). b (i) IB analysis of Ucp1 levels. The levels of Ponceau S were assessed as a loading control. b (ii) Graph showing densitometric analysis of Ucp1 levels in arbitrary units (a.u), normalized to Ponceau S. Brown adipose tissue was used as a positive control to detect Ucp1 (n = 5 mice for DB-injected group and n = 3 mice for irisin-injected group). c Graph showing body weight change (% from initial) in mice injected with either DB or irisin protein. Graphs displaying d Gas, Quad, and BF, and e TA, EDL, and Sol muscle weights of mice injected with DB (control) or irisin. All hindlimb muscle weights were normalized to tibia length. f Graph showing the grip strength of mice (in newton; N) injected with DB (control) or irisin (n = 5 mice for DB-injected group and n = 4 mice for irisin-injected group). g Representative images of H&E-stained TA muscle from mice injected with DB (control) or irisin. Images were captured using a ×20 objective. Scale bar represents 100 μm. h Graph showing the distribution of TA myofiber CSA in mice injected with DB (control) or irisin (n = 3 mice per group). i Graph showing body weight change (% from initial) in mice injected with either DB (control) or His-tagged peptide. Graphs displaying j Gas, Quad, and BF, and k TA, EDL, and Sol muscle weights of mice injected with DB (control) or His-tagged peptide. All hindlimb muscle weights were normalized to tibia length (n = 5 mice for each treatment group). l Representative images of H&E-stained TA muscle from mice injected with DB (control) or His-tagged peptide. Images were captured using a ×20 objective. Scale bar represents 100 μm. m Graph showing the distribution of TA myofiber CSA in mice injected with DB (control) or His-tagged peptide (n = 3 mice per treatment group). Error bars represent mean ± SEM. Student’s t-test was performed for all relevant figure panels. Significance is indicated with *p < 0.05, **p < 0.01 and ***p < 0.001
Fig. 4 Irisin improves protein synthesis and reduces protein degradation. a Graph showing levels of irisin circulating in serum of mice injected with DB (control) or recombinant irisin (n = 5 mice for DB-injected group and n = 6 mice for irisin-injected group). b (i) IB analysis of Ucp1 levels. The levels of Ponceau S were assessed as a loading control. b (ii) Graph showing densitometric analysis of Ucp1 levels in arbitrary units (a.u), normalized to Ponceau S. Brown adipose tissue was used as a positive control to detect Ucp1 (n = 5 mice for DB-injected group and n = 3 mice for irisin-injected group). c Graph showing body weight change (% from initial) in mice injected with either DB or irisin protein. Graphs displaying d Gas, Quad, and BF, and e TA, EDL, and Sol muscle weights of mice injected with DB (control) or irisin. All hindlimb muscle weights were normalized to tibia length. f Graph showing the grip strength of mice (in newton; N) injected with DB (control) or irisin (n = 5 mice for DB-injected group and n = 4 mice for irisin-injected group). g Representative images of H&E-stained TA muscle from mice injected with DB (control) or irisin. Images were captured using a ×20 objective. Scale bar represents 100 μm. h Graph showing the distribution of TA myofiber CSA in mice injected with DB (control) or irisin (n = 3 mice per group). i Graph showing body weight change (% from initial) in mice injected with either DB (control) or His-tagged peptide. Graphs displaying j Gas, Quad, and BF, and k TA, EDL, and Sol muscle weights of mice injected with DB (control) or His-tagged peptide. All hindlimb muscle weights were normalized to tibia length (n = 5 mice for each treatment group). l Representative images of H&E-stained TA muscle from mice injected with DB (control) or His-tagged peptide. Images were captured using a ×20 objective. Scale bar represents 100 μm. m Graph showing the distribution of TA myofiber CSA in mice injected with DB (control) or His-tagged peptide (n = 3 mice per treatment group). Error bars represent mean ± SEM. Student’s t-test was performed for all relevant figure panels. Significance is indicated with *p < 0.05, **p < 0.01 and ***p < 0.001CC BY · PubMed Central
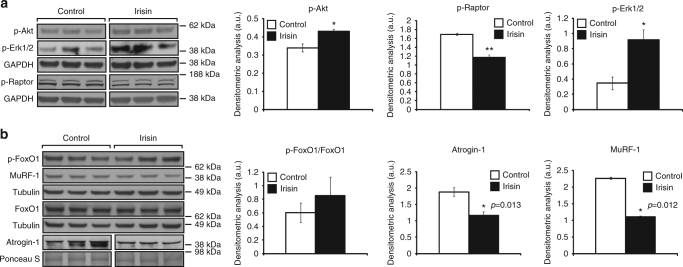
Fig. 5 Signalling behind irisin treatment. a IB analysis of p-Akt, p-Erk1/2, and p-Raptor protein levels. The levels of GAPDH were assessed as a loading control. Graphs show densitometric analysis of p-Akt (left), p-Raptor (middle), and p-Erk1/2 (right) levels in arbitrary units (a.u.), normalized to GAPDH (n = 3 biological replicates). Since p-Akt and p-Erk1/2 IB analysis was performed on the same membrane, the same GAPDH was used to normalize the results. b IB analysis of p-FoxO1, MuRF-1, FoxO1, and Atrogin-1 protein levels. The levels of tubulin or Ponceau S were assessed as loading controls. Graphs show densitometric analysis of pFoxO1/FoxO1 (left), Atrogin-1 (middle), and MuRF-1 (right) levels in a.u., normalized to tubulin or Ponceau S (n = 3 biological replicates). Since pFoxO1 and MuRF-1 IB analysis was performed on the same membrane, the same tubulin was used to normalize the results. All IBs were performed on proteins collected from 72 h-differentiated myotubes treated with either DB (control) or irisin (1000 ng/ml) for a further 48 h. Where necessary, intervening irrelevant bands were removed from the IBs, which is denoted by a gap between boxes in the figures. Error bars represent mean ± SEM. Student’s t-test was performed for all relevant figure panels. Significance is indicated with *p < 0.05 and **p < 0.01
Fig. 5 Signalling behind irisin treatment. a IB analysis of p-Akt, p-Erk1/2, and p-Raptor protein levels. The levels of GAPDH were assessed as a loading control. Graphs show densitometric analysis of p-Akt (left), p-Raptor (middle), and p-Erk1/2 (right) levels in arbitrary units (a.u.), normalized to GAPDH (n = 3 biological replicates). Since p-Akt and p-Erk1/2 IB analysis was performed on the same membrane, the same GAPDH was used to normalize the results. b IB analysis of p-FoxO1, MuRF-1, FoxO1, and Atrogin-1 protein levels. The levels of tubulin or Ponceau S were assessed as loading controls. Graphs show densitometric analysis of pFoxO1/FoxO1 (left), Atrogin-1 (middle), and MuRF-1 (right) levels in a.u., normalized to tubulin or Ponceau S (n = 3 biological replicates). Since pFoxO1 and MuRF-1 IB analysis was performed on the same membrane, the same tubulin was used to normalize the results. All IBs were performed on proteins collected from 72 h-differentiated myotubes treated with either DB (control) or irisin (1000 ng/ml) for a further 48 h. Where necessary, intervening irrelevant bands were removed from the IBs, which is denoted by a gap between boxes in the figures. Error bars represent mean ± SEM. Student’s t-test was performed for all relevant figure panels. Significance is indicated with *p < 0.05 and **p < 0.01CC BY · PubMed Central
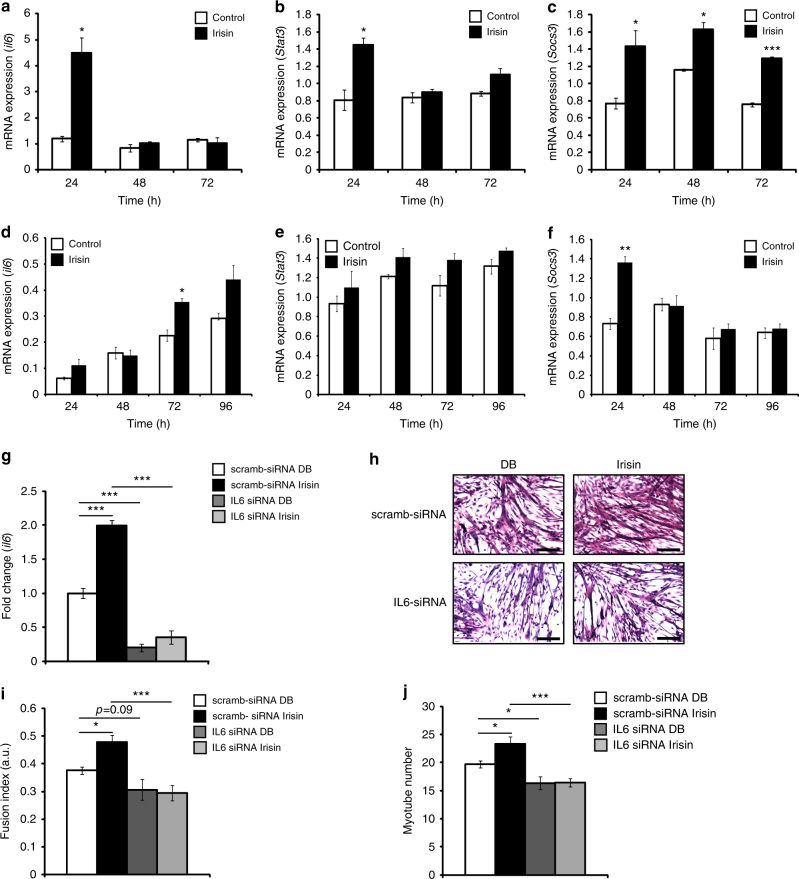
Fig. 6 Irisin treatment activates the IL6 pathway. Graphs displaying qPCR analysis of IL6 (a), Stat3 (b), and Socs3 (c) in proliferating myoblasts at 24, 48, and 72 h treated with DB (control) or irisin (1000 ng/ml). Graphs displaying qPCR analysis of IL6 (d), Stat3 (e), and Socs3 (f) in differentiating myoblasts at 24, 48, 72, and 96 h treated with DB (control) or irisin (1000 ng/ml). Graphs displaying qPCR analysis of IL6 (g) at 48 h treated with DB (control) or irisin (1000 ng/ml) in myoblasts transfected with IL6-specific siRNA (IL6 siRNA) or scrambled siRNA-transfected myoblasts (scramb-siRNA). All qPCR graphs show gene expression normalized to gapdh. h Representative images of H&E-stained IL6 knockdown (IL6 siRNA) and IL6-positive (scramb-siRNA) myoblasts differentiated for 72 h in the presence of DB (control) or irisin (1000 ng/ml). i Graph showing quantification of fusion index of IL6-knockdown (IL6 siRNA) and IL6-positive (scramb-siRNA) myoblasts differentiated for 72 h in the presence of DB (control) or irisin (1000 ng/ml). j Graph showing quantification of myotube number of IL6-knockdown (IL6 siRNA) and IL6-positive (scramb-siRNA) myoblasts differentiated for 72 h in the presence of DB (control) or irisin (1000 ng/ml) (n = 3 biological replicates for all experiments in this figure). Error bars represent mean ± SEM. Student’s t-test was performed for all figure panels between a and f, and two-way ANOVA was performed for all relevant figure panels between g and j. Significance is indicated with *p < 0.05, **p < 0.01 and ***p < 0.001
Fig. 6 Irisin treatment activates the IL6 pathway. Graphs displaying qPCR analysis of IL6 (a), Stat3 (b), and Socs3 (c) in proliferating myoblasts at 24, 48, and 72 h treated with DB (control) or irisin (1000 ng/ml). Graphs displaying qPCR analysis of IL6 (d), Stat3 (e), and Socs3 (f) in differentiating myoblasts at 24, 48, 72, and 96 h treated with DB (control) or irisin (1000 ng/ml). Graphs displaying qPCR analysis of IL6 (g) at 48 h treated with DB (control) or irisin (1000 ng/ml) in myoblasts transfected with IL6-specific siRNA (IL6 siRNA) or scrambled siRNA-transfected myoblasts (scramb-siRNA). All qPCR graphs show gene expression normalized to gapdh. h Representative images of H&E-stained IL6 knockdown (IL6 siRNA) and IL6-positive (scramb-siRNA) myoblasts differentiated for 72 h in the presence of DB (control) or irisin (1000 ng/ml). i Graph showing quantification of fusion index of IL6-knockdown (IL6 siRNA) and IL6-positive (scramb-siRNA) myoblasts differentiated for 72 h in the presence of DB (control) or irisin (1000 ng/ml). j Graph showing quantification of myotube number of IL6-knockdown (IL6 siRNA) and IL6-positive (scramb-siRNA) myoblasts differentiated for 72 h in the presence of DB (control) or irisin (1000 ng/ml) (n = 3 biological replicates for all experiments in this figure). Error bars represent mean ± SEM. Student’s t-test was performed for all figure panels between a and f, and two-way ANOVA was performed for all relevant figure panels between g and j. Significance is indicated with *p < 0.05, **p < 0.01 and ***p < 0.001CC BY · PubMed Central
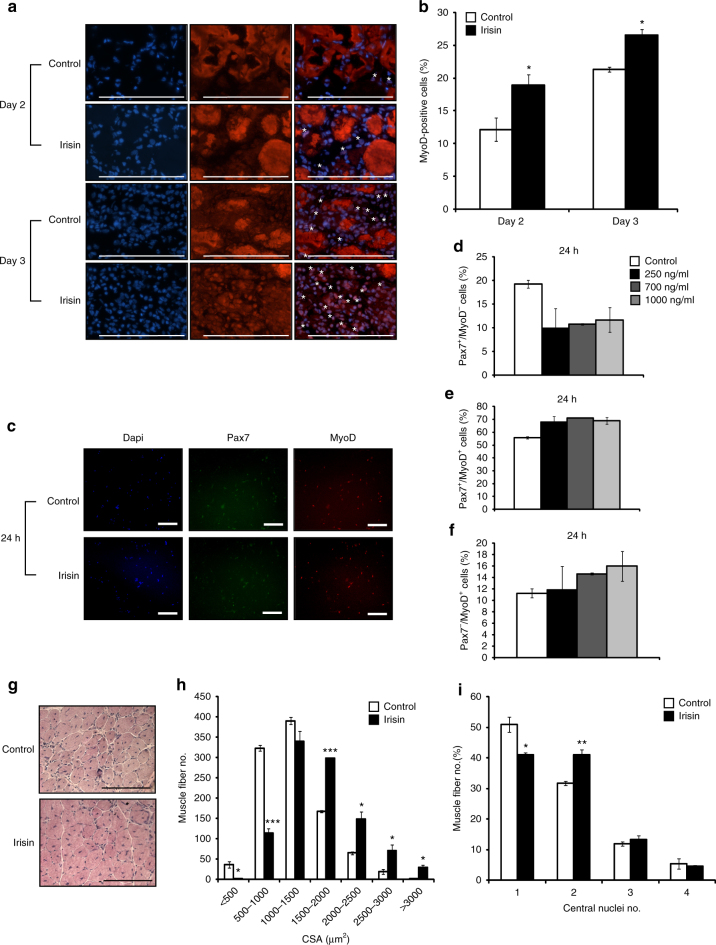
Fig. 7 Irisin improves regeneration of skeletal muscle. a Representative images of MyoD immunostaining of TA muscle sections from DB (control)- or irisin-injected mice at day 2 and day 3 post notexin injury. Images were captured using a ×40 objective. Scale bar represents 100 μm. Nuclei were counterstained with DAPI. White asterisks denote MyoD-positive cells. Linear brightness and contrast of ‘Merge’ panel was adjusted to visualize MyoD+ cells without altering the interpretation of results in any way. b Graph displaying the percentage of MyoD-positive cells in TA muscle sections from DB (control)- or irisin-injected mice at day 2 (n = 3 mice for both groups) and day 3 (n = 2 mice for control group and n = 3 mice for irisin-injected group) post notexin injury. c Representative images of MyoD and Pax7 immunostaining of primary satellite cell cultures treated with either DB (Control) or irisin (1000 ng/ml) for 24 h. Linear brightness and contrast of “Dapi”, “Pax7”, and “MyoD” panels was adjusted to visualize the positively stained nuclei without altering the interpretation of results in any way. Images were captured using a ×10 objective. Scale bar represents 100 μm. Graphs displaying the percentage of d quiescent (Pax7+/MyoD−), e proliferating (Pax7+/MyoD+), and f committed (Pax7−/MyoD+) satellite cells present following treatment with either DB (control) or increasing concentrations of irisin (250, 700, and 1000 ng/ml) for 24 h (n = 2 biological replicates). g Representative images of H&E-stained TA muscle at day 10 post notexin injury from mice injected with either DB (control) or irisin. Images were captured using a ×20 objective. Scale bar represents 100 μm. h Graphs showing the distribution of TA myofiber cross-sectional area (CSA) and the i percentage of myofibers with 1, 2, 3, or 4 centrally placed nuclei at day 10 post notexin injury from mice injected with either DB (control) or irisin (2.5 μg/g of body weight) (n = 3 mice for both groups). Error bars represent mean ± SEM. Student’s t-test was performed for b, h, i, and one-way ANOVA was performed for d–f. Significance is indicated with *p < 0.05, **p < 0.01 and ***p < 0.001
Fig. 7 Irisin improves regeneration of skeletal muscle. a Representative images of MyoD immunostaining of TA muscle sections from DB (control)- or irisin-injected mice at day 2 and day 3 post notexin injury. Images were captured using a ×40 objective. Scale bar represents 100 μm. Nuclei were counterstained with DAPI. White asterisks denote MyoD-positive cells. Linear brightness and contrast of ‘Merge’ panel was adjusted to visualize MyoD+ cells without altering the interpretation of results in any way. b Graph displaying the percentage of MyoD-positive cells in TA muscle sections from DB (control)- or irisin-injected mice at day 2 (n = 3 mice for both groups) and day 3 (n = 2 mice for control group and n = 3 mice for irisin-injected group) post notexin injury. c Representative images of MyoD and Pax7 immunostaining of primary satellite cell cultures treated with either DB (Control) or irisin (1000 ng/ml) for 24 h. Linear brightness and contrast of “Dapi”, “Pax7”, and “MyoD” panels was adjusted to visualize the positively stained nuclei without altering the interpretation of results in any way. Images were captured using a ×10 objective. Scale bar represents 100 μm. Graphs displaying the percentage of d quiescent (Pax7+/MyoD−), e proliferating (Pax7+/MyoD+), and f committed (Pax7−/MyoD+) satellite cells present following treatment with either DB (control) or increasing concentrations of irisin (250, 700, and 1000 ng/ml) for 24 h (n = 2 biological replicates). g Representative images of H&E-stained TA muscle at day 10 post notexin injury from mice injected with either DB (control) or irisin. Images were captured using a ×20 objective. Scale bar represents 100 μm. h Graphs showing the distribution of TA myofiber cross-sectional area (CSA) and the i percentage of myofibers with 1, 2, 3, or 4 centrally placed nuclei at day 10 post notexin injury from mice injected with either DB (control) or irisin (2.5 μg/g of body weight) (n = 3 mice for both groups). Error bars represent mean ± SEM. Student’s t-test was performed for b, h, i, and one-way ANOVA was performed for d–f. Significance is indicated with *p < 0.05, **p < 0.01 and ***p < 0.001CC BY · PubMed Central
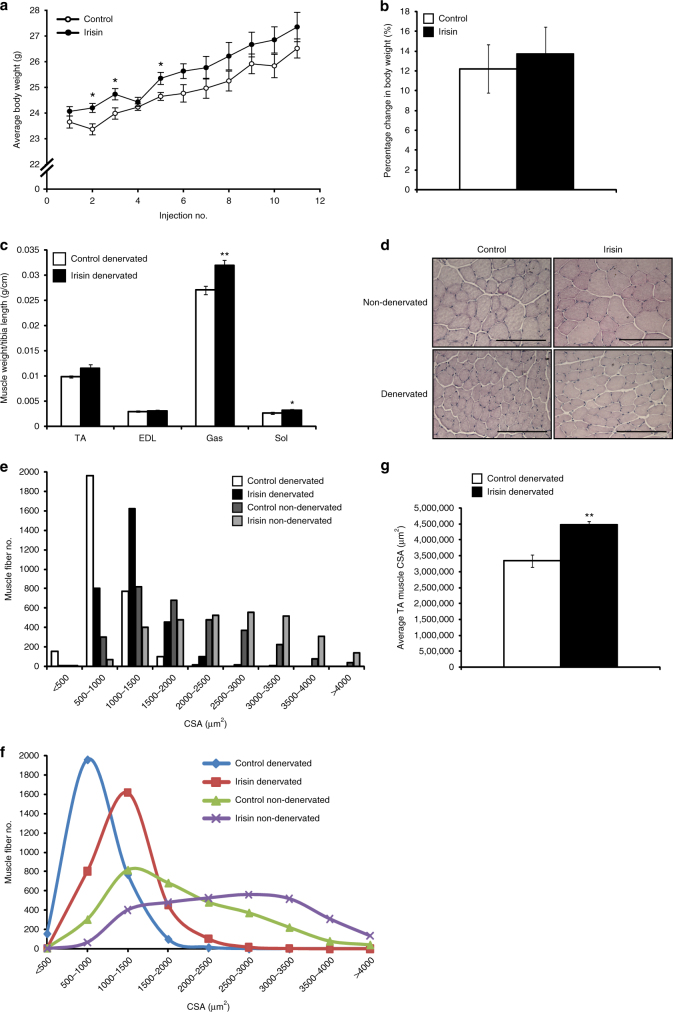
Fig. 8 Irisin rescues denervation-induced loss of muscle mass. a Graph showing average body weight (g) of mice injected with either DB (control) or irisin (2.5 μg/g body weight) three times a week, 1 week prior to, and 2 weeks post transection of the sciatic nerve. Body weights were measured prior to injection. b Graph showing the percentage change in body weight (from initial) in mice injected with either DB (control) or irisin pre and post sciatic nerve transection (n = 6 mice for both groups). c Graph displaying average TA, EDL, Gas, and Sol muscle weights of denervated mice injected with either DB (control) or irisin pre and post sciatic nerve transection. All hindlimb muscle weights were normalized to tibia length (n = 5 mice for DB-injected group and 6 mice for irisin-injected group). d Representative images of H&E-stained TA muscle from non-denervated and denervated mice injected with either DB (control) or irisin. e Histogram and f line graph showing the distribution of TA myofiber CSA in non-denervated and denervated mice injected with either DB (control) or irisin. g Graph displaying the average total cross-sectional area of TA muscles from denervated mice injected with either DB (control) or irisin (n = 3 mice for both groups). Error bars represent mean ± SEM. Student’s t-test was performed for all relevant figure panels. Significance is indicated with *p < 0.05 and **p < 0.01
Fig. 8 Irisin rescues denervation-induced loss of muscle mass. a Graph showing average body weight (g) of mice injected with either DB (control) or irisin (2.5 μg/g body weight) three times a week, 1 week prior to, and 2 weeks post transection of the sciatic nerve. Body weights were measured prior to injection. b Graph showing the percentage change in body weight (from initial) in mice injected with either DB (control) or irisin pre and post sciatic nerve transection (n = 6 mice for both groups). c Graph displaying average TA, EDL, Gas, and Sol muscle weights of denervated mice injected with either DB (control) or irisin pre and post sciatic nerve transection. All hindlimb muscle weights were normalized to tibia length (n = 5 mice for DB-injected group and 6 mice for irisin-injected group). d Representative images of H&E-stained TA muscle from non-denervated and denervated mice injected with either DB (control) or irisin. e Histogram and f line graph showing the distribution of TA myofiber CSA in non-denervated and denervated mice injected with either DB (control) or irisin. g Graph displaying the average total cross-sectional area of TA muscles from denervated mice injected with either DB (control) or irisin (n = 3 mice for both groups). Error bars represent mean ± SEM. Student’s t-test was performed for all relevant figure panels. Significance is indicated with *p < 0.05 and **p < 0.01CC BY · PubMed Central
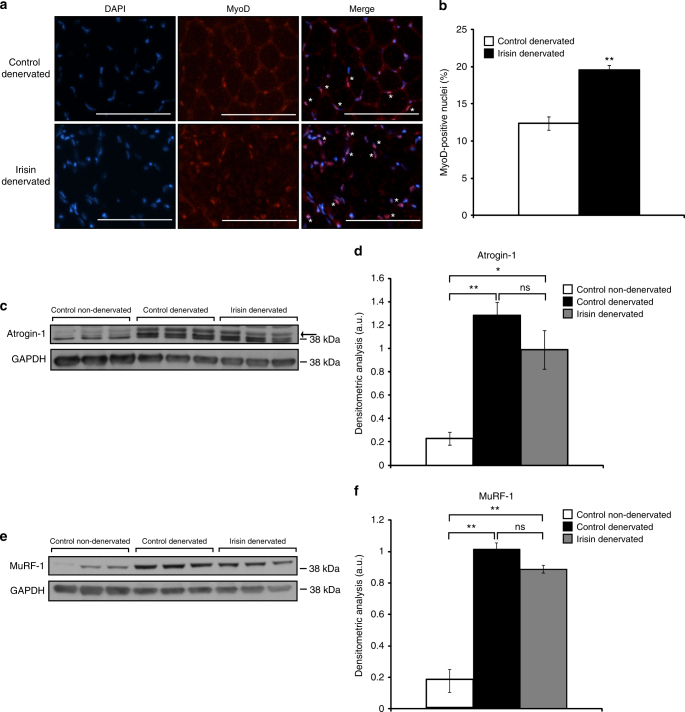
Fig. 9 Irisin treatment rescues denervation-induced muscle atrophy. a Representative images of MyoD immunostaining of TA muscle sections from denervated mice injected with either DB (control) or irisin. Images were captured using a ×20 objective. Scale bar represents 100 μm. Nuclei were counterstained with DAPI. White asterisks denote MyoD-positive cells. Linear brightness and contrast of ‘Merge’ panel was adjusted to visualize MyoD+ nuclei without altering the interpretation of results in any way. b Graph displaying the percentage of MyoD-positive cells in TA muscle sections from denervated mice injected with either DB (control) or irisin pre and post sciatic nerve transection. c IB analysis of Atrogin-1 protein levels in Gas muscle from non-denervated mice injected with DB (control) and denervated mice injected with either DB (control) or irisin. The levels of GAPDH were assessed as a loading control. Arrow indicates Atrogin-1 band. d Graph shows densitometric analysis of Atrogin-1 levels in arbitrary units (a.u), normalized to GAPDH. e IB analysis of MuRF-1 protein levels in Gas muscle from non-denervated mice injected with DB (control) or denervated mice injected with either DB (control) or irisin. The levels of GAPDH were assessed as a loading control. f Graph shows densitometric analysis of MuRF-1 levels in a.u, normalized to GAPDH (n = 3 biological replicates). Error bars represent mean ± SEM. Student’s t-test was performed for b and one-way ANOVA was performed for d and f. Significance is indicated with *p < 0.05 and **p < 0.01
Fig. 9 Irisin treatment rescues denervation-induced muscle atrophy. a Representative images of MyoD immunostaining of TA muscle sections from denervated mice injected with either DB (control) or irisin. Images were captured using a ×20 objective. Scale bar represents 100 μm. Nuclei were counterstained with DAPI. White asterisks denote MyoD-positive cells. Linear brightness and contrast of ‘Merge’ panel was adjusted to visualize MyoD+ nuclei without altering the interpretation of results in any way. b Graph displaying the percentage of MyoD-positive cells in TA muscle sections from denervated mice injected with either DB (control) or irisin pre and post sciatic nerve transection. c IB analysis of Atrogin-1 protein levels in Gas muscle from non-denervated mice injected with DB (control) and denervated mice injected with either DB (control) or irisin. The levels of GAPDH were assessed as a loading control. Arrow indicates Atrogin-1 band. d Graph shows densitometric analysis of Atrogin-1 levels in arbitrary units (a.u), normalized to GAPDH. e IB analysis of MuRF-1 protein levels in Gas muscle from non-denervated mice injected with DB (control) or denervated mice injected with either DB (control) or irisin. The levels of GAPDH were assessed as a loading control. f Graph shows densitometric analysis of MuRF-1 levels in a.u, normalized to GAPDH (n = 3 biological replicates). Error bars represent mean ± SEM. Student’s t-test was performed for b and one-way ANOVA was performed for d and f. Significance is indicated with *p < 0.05 and **p < 0.01CC BY · PubMed Central

Verification

Claims the paper makes

The claims and statistics of this paper haven’t been checked yet.

Run the check — free, no account needed. It reads the open-access text and checks the sources it cites.

A few free checks a day · papers already verified open instantly · results are public

Claims other papers make about this one

Each is checked against this paper’s own text: does it say what the citing paper says it does?

Self-check

Percentages, sums and reported differences re-computed from the paper’s own numbers.

The self-check needs the paper’s full text.

Citations

Cites

Show all 43 references

Cited by

Sorted by citations

Items 301–335 of 335

Metadata

Authors
Reza, M. M., Subramaniyam, N., Sim, C. M., Ge, X., Sathiakumar, D., McFarlane, C., Sharma, M., & Kambadur, R.
Affiliations
  • Nanyang Technological University (SG)
  • Agency for Science, Technology and Research (SG)
  • National University of Singapore (SG)
Corresponding author
Kambadur, Ravi
Venue
Nature Communications
Published
2017-10-24
Volume
8
Issue
1
Pages
1104-1104
ISSN
2041-1723 (ISSN-L)
OpenAlex
W2765141291
Cited by
335
References
43
Citations by year
2026: 33 · 2025: 50 · 2024: 47 · 2023: 48 · 2022: 54 · 2021: 37 · 2020: 29 · 2019: 27 · 2018: 9 · 2017: 1
FWCI
7.38
Type
journal article
Language
en
Open access
Locations
  • Nature Communications (publishedVersion, cc-by)
  • PubMed Central (publishedVersion, cc-by)
  • PubMed (publishedVersion)
  • UEA Digital Repository (University of East Anglia) (acceptedVersion)
  • ResearchOnline - JCU (James Cook University) (submittedVersion)
  • RePEc: Research Papers in Economics (submittedVersion)
  • DOAJ (DOAJ: Directory of Open Access Journals) (submittedVersion, cc-by-sa)
  • DOAJ (DOAJ: Directory of Open Access Journals) (submittedVersion)
  • DR-NTU (Nanyang Technological University) (submittedVersion, cc-by)
Funders
  • Agency for Science, Technology and Research
  • Nanyang Technological University
  • Medical Research Council
  • National Medical Research Council
Topics
  • Life Sciences › Biochemistry, Genetics and Molecular Biology › Molecular Biology › Muscle Physiology and Disorders
  • Health Sciences › Medicine › Physiology (medical) › Exercise and Physiological Responses
  • Health Sciences › Nursing › Nutrition and Dietetics › Muscle metabolism and nutrition
Keywords
irisin, myokines, skeletal muscle hypertrophy, denervation-induced atrophy, satellite cells, myogenesis, myoblast fusion, IL-6 signaling, muscle regeneration, skeletal muscle injury, protein synthesis, protein degradation
MeSH terms
Animals, Atrophy, Denervation, Fibronectins, Humans, Hypertrophy, Male, Mice, Inbred C57BL, Stem Cells, Interleukin-6, Muscle, Skeletal, Muscle Fibers, Skeletal, Muscle Development, Mice, Adipose Tissue, White

About these checks

Registry, retraction, Cites and statistics results are computed, not judged, with one exception: a printed reference that no index lists is read once by a model before it counts as a citation error. Claims are extracted by a model and kept only when their quote appears verbatim in the text; each cited source is then checked, with a model’s help, for whether it says what the claim relies on. Those verdicts can be wrong — read the claim’s quote and the cited source before relying on one.

Statistics and arithmetic are recomputed, not judged.

Confidence bands are shown only for fields calibrated on our annotated test set. None is calibrated yet, so no band is shown.

What counts as a claim ›How we measure confidence ›How we check this ›

Are you an author, or do you see a problem with this page? Request a review